Transcription
A List Of The MostImportant PriceAction Patterns
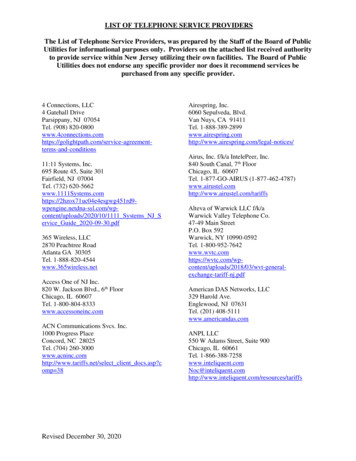
To be a price action trader means having a deep understanding of the variousdifferent price action patterns that form in the market. The problem with thesepattern, is that because there are so many of them that form in the market,knowing which ones you should take the time out to learn and which you shouldleave can be quite challenging. To solve this problem, I thought that today Iwould give you a list of what I believe to be the most important price actionpatterns you need to learn as a forex trader.As some of you reading this will probably already know, there are three basictypes of pattern that can form in the market: Price Action Reversal Patterns Price Action Continuation Patterns Price Action Candlestick PatternI'll begin today's article by first showing you what the most important price actionreversal patterns are, followed by which continuation patterns you need to haveknowledge on, and finally I'll show you the two most important price actioncandlestick patterns you need to watch out for in the market.Price Action Reversal PatternsReversal patterns are probably the most important set of price action patternsyou need to really have a deep understanding of, as they can give you earlyclues about if a movement in the market is coming to an end. The six patternsI'm going to be showing you in this section are all multi-swing shape patterns,which means that each one of the patterns forms from more than one upswingand downswing taking place in the market, and they all look similar to commonshapes upon their completion.The Head And Shoulders PatternThe first price action reversal pattern we're going to look at is the head andshoulders pattern. Without doubt one of the most popular and well known priceaction patterns in the market, the head and shoulders formation is one which allprice action traders need to memorize and understand if they want to becomegood at spotting reversals using price action. As you've probably alreadyguessed, the head and shoulders pattern is a reversal pattern which has a swingstructure very similar to that of person's head and shoulders.
Here's an image of a bearish head and shoulders pattern which formed on the1hour chart of EUR/USD.You can see from the image the structure of the pattern does bear a strikingresemblance to somebody standing up with their head straight and theirshoulders level with one another. Most head and shoulders patterns aresupposed to look like the one you can see in the image above, but a largepercentage of them will actually have features which are a little different from oneanother. For example, you might see a pattern form with one of the shouldersbeing a little bit higher than the other, or the distance of two shoulders from thehead will be smaller or bigger than what you can see in the pattern above.These small differences do not alter the pattern in any meaningful way. So longas the head is always found in the middle and the two shoulders are found to beeither side, it's a head and shoulder pattern. If the high of the right shoulder isfound to be below the swing low of the move up which created the head, then it'snot a head and shoulders pattern and should not be treated as such.The pattern itself comes in two variations. The one we just looked at in the imageabove is referred to as being a bearish head and shoulders pattern, which is asignal the market may reverse to the downside, whilst the one seen in the imagebelow is a bullish head and shoulders pattern, but is often refereed to as beingan inverse head and shoulders pattern due to the way the pattern is basically anupside down version of the bearish pattern.
Here's what an inverted head and shoulders pattern looks like on a chart.You can see that all the features of the pattern are the same as the bearishversion, only the opposite way around. Instead of the head pointing upwards likeit does with the bearish pattern it points down, as do the left and right shoulders.The only real difference between the two patterns is in what needs to happen inorder for the pattern to become invalidated.With the bullish head and shoulders pattern if the right shoulder forms below theswing low of the move up which created the head, the pattern is not a head andshoulders and is instead some other formation. The bearish head and shouldersfollows the same rule, only the right shoulder cannot form above the swing highof the move down which created the head, if it does it's not a bearish head andshoulders pattern.All in all the head and shoulders formation is usually quite a reliable signal thecurrent movement is going to reverse. If you want to learn the best way to tradethe head and shoulders pattern and get a more in-depth look at the way it shouldform on your charts, check out the article I've left below.The Easy Way To Trade The Head And Shoulder Pattern
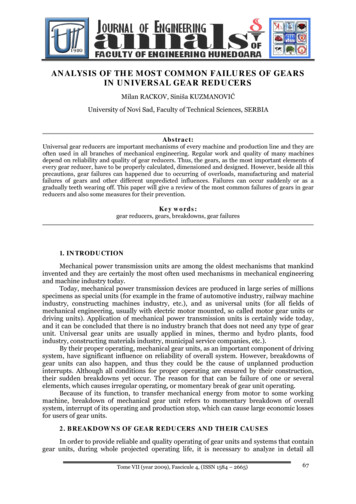
The Double Bottom And Double Top PatternsThe double bottom and double top formations are another couple of reallyimportant reversal patterns you need to be aware of forming in the market.They're two patterns which get their name from the way the market will make twodownswings with swing lows at similar prices to one another before reversing, (inthe case of the double bottom pattern) or two upswings with swing highs formingat similar prices to one another before reversing, in the case of the double toppattern.The image above shows an example of a double bottom pattern which formed onthe 1hour chart of USD/JPY.You can see the first part of the pattern forms after the market makes adownswing followed by an up-swing. The swing low that forms at the bottom ofthe swing higher is one of the two bottoms that forms during the pattern. Thenext swing low and bottom will always end up forming at a similar point to wherethis first swing low has formed, and the overall swing structure will usuallyresemble that of the letter W once the pattern has fully formed.
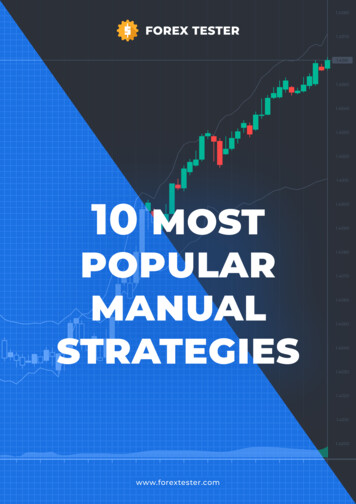
In this image we are looking at an example of the double top pattern.The double top is of course the opposite to the double bottom, which means thatit's formation involves two upswings taking place with swing highs forming atsimilar prices to one another instead of two swing lows.Both patterns become invalidated if the second top or bottom in each respectivepattern forms at a price which is far away from the price at which the first top orbottom has formed at. There isn't any exact guidelines on how far away thisshould be, but I'd say that if you see two or three large candlesticks close belowthe first bottom or above the first top, then it's probably not a double bottom ordouble top pattern.Overall the double bottom and double top patterns are two decent reversalformations, although they can be quite difficult patterns to trade effectively, due tothe way the swing seen after the second bottom or top has formed can easilyturn into a retracement or consolidation soon after you would have entered atrade.The Rising And Falling Wedge PatternThe final two price action reversal patterns we're going to look at, are the risingwedge and the falling wedge. The rising and falling wedges are two patternswhich get their name from the way the market sometimes contracts before theend of an up-move or down-move. The contraction of the swings is what createsthe wedge and gives the patterns their name.
Here's an image of a large rising wedge pattern which occurred on the daily chartof EUR/USD.You can see that at the beginning of the wedge the distance between the markethitting the upper wedge line and lower wedge line is quite large. As the patternprogresses though, the distance between the two lines becomes smaller andsmaller until eventually the two lines are really close to one another, almost as ifthey were about to form the tip on an arrow head.In this image we're looking at an example of a falling wedge pattern.The falling wedge is the bullish version of the wedge pattern and is always asignal the market may be about to reverse to the upside. It forms in much thesame way as the rising wedge pattern, with the only difference being that theswings contract to the downside rather than the upside like they do during theformation of the rising wedge.
In closing, the rising and falling wedges are two patterns which are important foryou to be able to recognize 0n a chart, but are not patterns which you should useto look for entries into trades, due to the way many false signals will appear asthe swings contract and the pattern nears completion.Price Action Continuation PatternsSo now that we've had a look at some of the most important price action reversalpatterns, I think it's time to move on and spend a little bit of time looking at themost important price action continuation patterns you can expect to see form inthe market. Price action continuation patterns are basically the opposite of thereversal patterns we have just looked at. Instead of signalling to us a reversal isgoing to take place, their appearance is a sign the current trend/movement isprobably going to continue.The Rising And Falling Wedge ContinuationWhilst the rising and falling wedges are most often found to be price actionreversal patterns, they can also be continuation patterns if they happen to formduring downtrends and up-trends respectively.Here's a falling wedge pattern which formed during a retracement that was takingplace during an up-swing on EUR/USD.The reversal formation of the falling wedge will always form at the end ofdowntrends or down-moves, but the continuation variation will only form duringup-trends and up-moves. You can see the wedge forms in the same way as itwould if it was signalling a reversal at the end of a downtrend.
The swings contract as the pattern progresses until an upside breakout occurs,pushing the market above the swing highs which had formed from the markethitting the sharper downside slope of the pattern.Here we have an image of rising wedge pattern which formed during adownmove that occurred on the 1hour chart of USD/JPY.In contrast to what we see with the falling wedge pattern, the rising wedge onlyforms as a continuation pattern during downtrends. If you see one form during anup-trend, it's not a continuation pattern and is instead the reversal pattern we justlooked at in the previous section.The vast majority of the wedge continuation patterns you'll see form in themarket will form as retracements during up or down moves. Their formation willtake place during the whole duration of the retracement, and the breakout seenat the end of each pattern will usually signal an end to not only the patternsformation, but the entire retracement itself.The Bullish And Bearish Flag PatternBullish and bearish flags (sometimes pronounced bull flag and bear flag) are twomore really common price action continuation patterns you'll see forming in themarket. They get their name from the way the structure of the pattern resemblesthat of flag mounted on top of a pole.
In the image above you can see an example of a bullish flag pattern that formedon AUD/USD.You can see the pattern is basically constructed off of two points. The first pointis the sharp bullish move higher which takes place right before retracementbegins (this is refereed to as being the pole of the flag) and the second point isthe retracement itself. The retracement is the flag part of the pattern and shouldalways terminate before reaching the 50% fibonacci retracement level of thedownswing which creates the flag pole. If you see the market retrace beyond the50% level it's usually a sign the pattern is changing from a flag into somethingelse.
This image shows a bearish flag pattern which formed on the 1hour chartEUR/USD.The bearish flag is basically an upside down version of the bullish flag. Bothpatterns form in the exact same way and they both abide by the same rulesregarding their formation i.e if the market moves beyond the 50% level of the flagpole swing the probability of pattern remaining a flag decreases dramatically.Both bull flags and bear flags form frequently in the market and are often quite areliable signal the current movement is going to continue. Usually the pointwhere a flag will terminate is the same point as where a supply or demand zonehas formed. So if you want to try to get an entry into a flag pattern trade, it's bestto do so around the point where a nearby supply or demand zone has formed, asthis is point where the flag is likely to end and cause the prior trend/movement toresume.The Descending And Descending Triangle PatternsThe last couple of continuation patterns we're going to have a look at are theascending triangle and the descending triangle. Triangle patterns are very muchlike the rising and falling wedge patterns we looked at earlier. They form in thesame way and have a similar swing structure to one another.The main difference between the two, is that the two triangle patterns alwaysform with one straight edge that acts as a resistance or support level until themarket breaks out of the pattern and continues to move in the direction of theprior trend.
Here's what an ascending triangle pattern looks like on a chart.The ascending triangle is the bullish variant of the two triangle patterns. It onlyforms during up-tends or up-swings and is always seen as being a signal thecurrent move is going to continue. The straight edge of the ascending triangle isa support level, and this level stops the market from moving lower during the timethe pattern is forming.In this image you can see a descending triangle pattern which formed on the1hour chart of AUD/USD.The descending triangle is the bearish version of the triangle pattern and it'sformation is a sign the current down-move/downtrend is likely going to continue.The only difference it has with the ascending triangle is that it's straight edge is aresistance level which stops prices from rising higher during the formation of thepattern in the market.The ascending and descending triangle patterns are good to know but not thatgreat for trading, due to the way a few false breakouts will usually take placebefore the real breakout occurs and causes the market to move in the direction itwas moving in prior to the pattern forming in the market.Price Action Candlestick PatternsThe final set of price action patterns we're going to to be looking at today areprice action candlestick patterns. There are lots of candlestick patterns out there,but I just want to focus on the two which I think are most important for priceaction traders to understand.
Pin Bar/Hammer CandlestickThe pin bar is a single candle pattern which can be found forming across allcurrencies and all time-frames in the market. It falls into the category of priceaction reversal patterns due the fact it's appearance is supposed to be a signal areversal is going to occur. Although it must be said that very few pin bars actuallycause large reversals to take place in the market, (I'll explain why in a minute).Like most price action patterns the pin bar comes in two varieties:The bullish pin bar, which signals a reversal to the upside may be about to takeplace, and the bearish pin bar, which is a sign a reversal to the downside isprobably going to occur.Here's an image of some bullish pin bars which formed on the 1 hour chart ofEUR/USDYou can see that the vast majority of these bullish pins did cause the market toreverse once they had formed, but they didn't all cause it to reverse for the sameduration of time. Some caused large upswings to take place whilst others onlycreated small retracements.
In this image we can see some bearish pin bars that formed on the 1 hour chart ofUSD/JPY.Again, you can see that the pin bars which formed on here also caused reversals ofvarying sizes to take place. The reason why pin bars cause different sized reversals tooccur, is because of the action that caused the pin bar to form in the first place. Pinbars and all the other candlesticks you see forming on your charts, form as a result oftraders making decisions in regards to the market price. Pin bars happen to formexclusively from the bank traders either placing trades because they want to make themarket reverse, or from taking profits off trades which they've already got placed.The reversal created by the pin bar which has formed as a result of the bank traderstaking profits off their trades, is naturally much smaller than the reversal caused by thepin which has formed from the bank traders placing trades to make the market reverse.It's obvious why this is, I mean if you took some profits off a trade you would want themarket to continue moving in the direction to which your trade had been placed so youcould make more money from the trade. The bank traders want the same to happenwhen they cause a pin bar to form from taking profits off their own trades, which is whythe reversal caused by some pin bars forming are much smaller than the reversalscaused by other pins forming.Bullish and bearish pin bars are really good reversal patterns to watch out for if you'rea price action trader, but they must be traded in the right way and you must understandwhy they form in the market. Most of the books and guides out there on pin bars do notteach traders what causes them to form, when it's knowing what causes them to formthat will allow you to determine which pins have a high probability of working outsuccessfully.
If you want to learn more about what causes pin bars to form in the market, go andcheck out some of the other pin bar articles I have available on the site, or take a lookat the Pin Bars Uncovered book found on the cool stuff page, as this is a bookdedicated solely to helping traders understand why pin bars form in the market andhow to trade them profitably.The Definite Guide To Trading Pin BarsEngulfing CandlesticksThe other really important candlestick pattern I think price action traders need to haveknowledge on is the engulfing candlestick. Like the pin bar the engulfing candle is areversal pattern, which means that a reversal is supposed to take place immediatelyafter you see one form in the market. Unlike the pin bar the engulfing candlestick is atwo bar reversal pattern, a pattern which requires there to be two candlesticks presentin order for it's formation to be complete.Here's an example of a bearish engulfing candle which caused a reversal tooccur on EUR/USD.The formation of a bearish engulf is always a signal that a reversal to thedownside is about to take place. The pattern itself consists of two candlesticks.The bearish engulfing candlestick itself, which I've marked with an arrow, and thebullish candlestick that formed an hour before. The bullish candle is first candlerequired in the bearish engulf setup. This is the candlestick which the market willalways engulf with a bearish candle immediately after it's formation.
In order for a bearish engulfing candle to form, a bullish candle must haveformed immediately prior. You can't have a bearish candlestick engulfing anotherbearish candle, it has t0 be a bullish candle in order for it to be a bearish engulf.Here you can see an image of a bullish engulfing setup which caused a reversalon EUR/USD.Bullish engulfing candlesticks are of course the opposite to bearish engulfingcandles, which means their appearance is a sign the market is going to reverseto the upside. Like the bearish engulfing candle they are also a two bar pattern,but instead of the first candle in the pattern being a bullish candlestick, like wesee with the bearish engulfing formation, the first candle in a bullish engulfingsetup will always engulf a bearish candle. A bullish engulfing candle cannotengulf another bullish candle, it can only engulf bearish candles.Engulfing candlesticks are best used as signals to enter trades at pre-existingpoints where you expect the market to reverse, such as support and resistancelevels or supply and demand
patterns you need to learn as a forex trader. As some of you reading this will probably already know, there are three basic types of pattern that can form in the market: Price Action Reversal Patterns Price Action Continuation Patterns Price Action Candlestick Pattern