Transcription
Sports Analyticsand Data ScienceWinning the Game with Methods and ModelsT HOMAS W. M ILLER
Publisher: Paul BogerEditor-in-Chief: Amy NeidlingerExecutive Editor: Jeanne Glasser LevineCover Designer: Alan ClementsManaging Editor: Kristy HartProject Editor: Andy BeasterManufacturing Buyer: Dan Uhrigc 2016 by Thomas W. MillerPublished by Pearson Education, Inc.Old Tappan, New Jersey 07675For information about buying this title in bulk quantities, or for special sales opportunities(which may include electronic versions; custom cover designs; and content particularto your business, training goals, marketing focus, or branding interests), please contactour corporate sales department at corpsales@pearsoned.com or (800) 382-3419.For government sales inquiries, please contact governmentsales@pearsoned.com.For questions about sales outside the U.S., please contact international@pearsoned.com.Company and product names mentioned herein are the trademarks or registeredtrademarks of their respective owners.All rights reserved. No part of this book may be reproduced, in any form or by anymeans, without permission in writing from the publisher.Printed in the United States of AmericaFirst Printing November 2015ISBN-10: 0-13-388643-3ISBN-13: 978-0-13-388643-6Pearson Education LTD.Pearson Education Australia PTY, Limited.Pearson Education Singapore, Pte. Ltd.Pearson Education Asia, Ltd.Pearson Education Canada, Ltd.Pearson Educación de Mexico, S.A. de C.V.Pearson Education—JapanPearson Education Malaysia, Pte. Ltd.Library of Congress Control Number: 2015954509
erstanding Sports Markets2Assessing Players233Ranking Teams374Predicting Scores495Making Game-Day Decisions616Crafting a Message697Promoting Brands and Products1018Growing Revenues1199Managing Finances133iii
ivSports Analytics and Data Science10 Playing What-if Games14711 Working with Sports Data16912 Competing on Analytics193A Data Science Methods197A.1 Mathematical Programming200A.2 Classical and Bayesian Statistics203A.3 Regression and Classification206A.4 Data Mining and Machine Learning215A.5 Text and Sentiment Analysis217A.6 Time Series, Sales Forecasting, and Market Response Models226A.7 Social Network Analysis230A.8 Data Visualization234A.9 Data Science: The Eclectic Discipline240B Professional Leagues and Teams255Data Science Glossary261Baseball Glossary279Bibliography299Index329
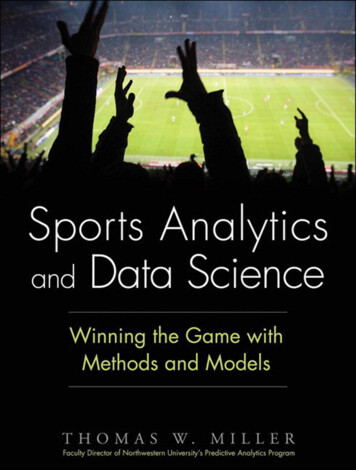
Preface“Sometimes you win, sometimes you lose, sometimes it rains.”—T IM R OBBINS AS E BBY C ALVIN L A L OOSH IN Bull Durham (1988)Businesses attract customers, politicians persuade voters, websites cajolevisitors, and sports teams draw fans. Whatever the goal or target, data andmodels rule the day.This book is about building winning teams and successful sports businesses.Winning and success are more likely when decisions are guided by data andmodels. Sports analytics is a source of competitive advantage.This book provides an accessible guide to sports analytics. It is writtenfor anyone who needs to know about sports analytics, including players,managers, owners, and fans. It is also a resource for analysts, data scientists,and programmers. The book views sports analytics in the context of datascience, a discipline that blends business savvy, information technology,and modeling techniques.To use analytics effectively in sports, we must first understand sports—the industry, the business, and what happens on the fields and courts ofplay. We need to know how to work with data—identifying data sources,gathering data, organizing and preparing them for analysis. We also needto know how to build models from data. Data do not speak for themselves.Useful predictions do not arise out of thin air. It is our job to learn fromdata and build models that work.v
viSports Analytics and Data ScienceThe best way to learn about sports analytics and data science is throughexamples. We provide a ready resource and reference guide for modelingtechniques. We show programmers how to solve real world problems bybuilding on a foundation of trustworthy methods and code.The truth about what we do is in the programs we write. The code isthere for everyone to see and for some to debug. Data sets and computerprograms are available from the website for the Modeling Techniques series at http://www.ftpress.com/miller/. There is also a GitHub site athttps://github.com/mtpa/.When working on sports problems, some things are more easily accomplished with R, others with Python. And there are times when it is good tooffer solutions in both languages, checking one against the other.One of the things that distinguishes this book from others in the area ofsports analytics is the range of data sources and topics discussed. Many researchers focus on numerical performance data for teams and players. Wetake a broader view of sports analytics—the view of data science. There aretext data as well as numeric data. And with the growth of the World WideWeb, the sources of data are plentiful. Much can be learned from publicdomain sources through crawling and scraping the web and utilizing application programming interfaces (APIs).I learn from my consulting work with professional sports organizations.Research Publishers LLC with its ToutBay division promotes what can becalled “data science as a service.” Academic research and models can takeus only so far. Eventually, to make a difference, we need to implement ourideas and models, sharing them with one another.Many have influenced my intellectual development over the years. Therewere those good thinkers and good people, teachers and mentors for whomI will be forever grateful. Sadly, no longer with us are Gerald Hahn Hinklein philosophy and Allan Lake Rice in languages at Ursinus College, andHerbert Feigl in philosophy at the University of Minnesota. I am also mostthankful to David J. Weiss in psychometrics at the University of Minnesotaand Kelly Eakin in economics, formerly at the University of Oregon.
PrefaceMy academic home is the Northwestern University School of ProfessionalStudies. Courses in sports research methods and quantitative analysis, marketing analytics, database systems and data preparation, web and networkdata science, web information retrieval and real-time analytics, and datavisualization provide inspiration for this book. Thanks to the many students and fellow faculty from whom I have learned. And thanks to colleagues and staff who administer excellent graduate programs, includingthe Master of Science in Predictive Analytics, Master of Arts in Sports Administration, Master of Science in Information Systems, and the AdvancedCertificate in Data Science.Lorena Martin reviewed this book and provided valuable feedback whileshe authored a companion volume on sports performance measurementand analytics (Martin 2016). Adam Grossman and Tom Robinson providedvaluable feedback about coverage of topics in sports business management.Roy Sanford provided advice on statistics. Amy Hendrickson of TEXnologyInc. applied her craft, making words, tables, and figures look beautiful inprint—another victory for open source. Candice Bradley served dual rolesas a reviewer and copyeditor for all books in the Modeling Techniques series.And Andy Beaster helped in preparing this book for final production. I amgrateful for their guidance and encouragement.Thanks go to my editor, Jeanne Glasser Levine, and publisher, Pearson/FTPress, for making this book possible. Any writing issues, errors, or items ofunfinished business, of course, are my responsibility alone.My good friend Brittney and her daughter Janiya keep me company whentime permits. And my son Daniel is there for me in good times and bad, afriend for life. My greatest debt is to them because they believe in me.Thomas W. MillerGlendale, CaliforniaOctober 2015vii
This page intentionally left blank
.46.57.17.27.37.47.58.19.19.29.39.49.510.1MLB, NBA, and NFL Average Annual SalariesMLB Team Payrolls and Win/Loss Performance (2014 Season)A Perceptual Map of Seven SportsMultitrait-Multimethod Matrix for Baseball MeasuresAssessing Team Strength: NBA Regular Season (2014–2015)Work of Data ScienceData and Models for ResearchTraining-and-Test Regimen for Model EvaluationTraining-and-Test Using Multi-fold Cross-validationTraining-and-Test with Bootstrap ResamplingPredictive Modeling Framework for Team SportsHow Sports Fit into the Entertainment Space (Or Not)Indices of Dissimilarity Between Pairs of Binary VariablesConsumer Preferences for Dodger Stadium SeatingChoice Item for Assessing Willingness to Pay for TicketsThe Market: A Meeting Place for Buyers and SellersDodgers Attendance by Day of WeekDodgers Attendance by MonthDodgers Weather, Fireworks, and AttendanceDodgers Attendance by Visiting TeamRegression Model Performance: Bobbleheads and AttendanceCompetitive Analysis for an NBA Team: Golden State WarriorsCost-Volume-Profit AnalysisHigher Profits Through Increased SalesHigher Profits Through Lower Fixed CostsHigher Profits Through Increased EfficiencyDecision Analysis: Investing in a Sports Franchise (Or Not)Game-day Simulation (Offense 7108129135136137137143152
xSports Analytics and Data 411.5A.1A.2A.3A.4A.5A.6A.7A.8A.9Mets’ Away and Yankees’ Home Data (Offense and Defense)Balanced Game-day Simulation (Offense and Defense)Actual and Theoretical Runs-scored DistributionsPoisson Model for Mets vs. Yankees at Yankee StadiumNegative Binomial Model for Mets vs. Yankees at Yankee StadiumProbability of Home Team Winning (Negative Binomial Model)Strategic Modeling Techniques in SportsSoftware Stack for a Document Search and Selection SystemThe Information Supply Chain of Professional Team SportsAutomated Data Acquisition by Crawling, Scraping, and ParsingAutomated Data Acquisition with an APIGathering and Organizing Data for AnalysisMathematical Programming Modeling MethodsEvaluating the Predictive Accuracy of a Binary ClassifierLinguistic Foundations of Text AnalyticsCreating a Terms-by-Documents MatrixData and Plots for the Anscombe QuartetVisualizing Many Games Across a Season: Differential Runs PlotMoving Fraction Plot for BasketballVisualizing Basketball Play-by-Play DataData Science: The Eclectic 12218221235236237239241
.110.2A.1A.2B.1B.2B.3B.4B.5B.6Sports and Recreation Activities in the United StatesMLB Team Valuation and Finances (March 2015)NBA Team Valuation and Finances (January 2015)NFL Team Valuation and Finances (August 2014)World Soccer Team Valuation and Finances (May 2015)Levels of MeasurementNBA Team Records (2014–2015 Season)Twenty-five States of a Baseball Half-InningDissimilarity Matrix for Entertainment Events and ActivitiesConsumer Preference Data for Dodger Stadium SeatingBobbleheads and Dodger DogsRegression of Attendance on Month, Day of Week, and PromotionDiscounted Cash Flow Analysis of a Player ContractWould you like to buy the Brooklyn Nets?New York Mets’ Early Season Games in 2007New York Yankees’ Early Season Games in 2007Three Generalized Linear ModelsSocial Network Data: MLB Player TransactionsWomen’s National Basketball Association (WNBA)Major League Baseball (MLB)Major League Soccer (MLS)National Basketball Association (NBA)National Football League (NFL)National Hockey League 56257258259260
This page intentionally left blank
11.2A.1A.2A.3A.4A.5A.6MLB, NBA, and NFL Player Salaries (R)Payroll and Performance in Major League Baseball (R)Making a Perceptual Map of Sports (R)Assessing Team Strength by Unidimensional Scaling (R)Mapping Entertainment Events and Activities (R)Mapping Entertainment Events and Activities (Python)Preferences for Sporting Events—Conjoint Analysis (R)Preferences for Sporting Events—Conjoint Analysis (Python)Shaking Our Bobbleheads Yes and No (R)Shaking Our Bobbleheads Yes and No (Python)Team Winning Probabilities by Simulation (R)Team Winning Probabilities by Simulation (Python)Simple One-Site Web Crawler and Scraper (Python)Gathering Opinion Data from Twitter: Football Injuries (Python)Programming the Anscombe Quartet (Python)Programming the Anscombe Quartet (R)Making Differential Runs Plots for Baseball (R)Moving Fraction Plot: A Basketball Example (R)Visualizing Basketball Games (R)Seeing Data Science as an Eclectic Discipline 246248252
This page intentionally left blank
1Understanding Sports Markets“Those of you on the floor at the end of the game, I’m proud of you. Youplayed your guts out. I’m only going to say this one time. All of you havethe weekend. Think about whether or not you want to be on this teamunder the following condition: What I say when it comes to this basketballteam is the law, absolutely and without discussion.”—G ENE H ACKMAN AS C OACH N ORMAN D ALE IN Hoosiers (1986)In applying the laws of economics to professional sports, we must considerthe nature of sports and the motives of owners. Professional sports aredifferent from other forms of business.There are sellers and buyers of sports entertainment. The sellers are theplayers and teams within the leagues of professional sports. The buyersare consumers of sports, many of whom never go to games in person butwho watch sports on television, listen to the radio, and buy sports teamparaphernalia.Sports compete with other forms of entertainment for people’s time andmoney. And various sports compete with one another, especially whentheir seasons overlap. Sports teams produce entertainment content that isdistributed through the media. Sports teams license their brand names andlogos to other organizations, including sports apparel manufacturers.1
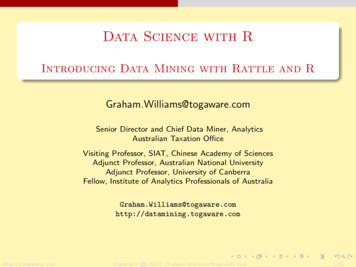
2Sports Analytics and Data ScienceSports teams are not independent businesses competing with one another.While players and teams compete on the fields and courts of play, theycooperate with one another as members of leagues. The core product ofsports is the sporting contest, a joint product of two or more players or twoor more teams.Fifty-four sports and recreation activities, shown in table 1.1, are tracked bythe National Sporting Goods Association (2015), which serves the sportinggoods industry. In recent years, participation in baseball, basketball, football, and tennis has declined, while participation in soccer has increased.There has been growth in individual recreational sports, such as skateboarding and snowboarding. Of course, levels of participation in sports arenot necessarily an indicator of levels of interest in sports as entertainment.Sports businesses produce entertainment products by cooperating with oneanother. While it is illegal for businesses in most industries to collude insetting output and prices, sports leagues engage in cooperative output andpricing as a standard part of their business model. The number of games,indeed the entire schedule of games in a sport, is determined by the league.In fact, aspects of professional sports are granted monopoly power by thefederal government in the United States.When developing a model for a typical business or firm, an economistwould assume profit maximization as a motive. But for a professionalsports team, an owner’s motives may not be so easily understood. Whileone owner may operate his or her team for profit year by year, anothermay seek to maximize wins or overall utility. Another may look for capitalappreciation—buying, then selling after a few years. Lacking knowledge ofowners’ motives, it is difficult to predict what they will do.Gaining market share and becoming the dominant player is a goal of firmsin many industries. Not so in the business of professional sports. If oneteam were assured of victory in almost all of its contests, interest in thosecontests could wane. A team benefits by winning more often than losing,but winning all the time may be less beneficial than winning most of thetime. Professional sports leagues claim to be seeking competitive balance,although there are dominant teams in many leagues.
Chapter 1. Understanding Sports MarketsTable 1.1.Sports and Recreation Activities in the United StatesAerobic ExercisingArchery (Target)Backpack/Wilderness CampingBaseballBasketballBicycle RidingBilliards/PoolBoating (Motor/Power)BowlingBoxingCamping (Vacation/Overnight)CanoeingCheerleadingDart ThrowingExercise WalkingExercising with EquipmentFishing (Fresh Water)Fishing (Salt Water)Football (Flag)Football (Tackle)Football (Touch)GolfGymnasticsHikingHockey (Ice)Hunting with Bow & ArrowHunting with FirearmsIce/Figure SkatingIn-Line Roller SkatingKayakingLacrosseMartial Arts/MMA/Tae Kwon DoMountain Biking (Off Road)MuzzleloadingPaintball GamesRunning/JoggingScuba Diving (Open Water)SkateboardingSkiing (Alpine)Skiing (Cross Country)SnowboardingSoccerSoftballSwimmingTable Tennis/Ping PongTarget Shooting (Airgun)Target Shooting (Live Ammunition)TennisVolleyballWater SkiingWeight LiftingWork Out at Club/Gym/Fitness StudioWrestlingYoga3
4Sports Analytics and Data ScienceSports is big business as shown by valuations and finances of the major professional sports in the United States and worldwide. Data from Forbes forMajor League Baseball (MLB), the National Basketball Association (NBA),the National Football League (NFL), and worldwide soccer teams are shownin tables 1.2 through 1.5.Professional sports teams most certainly compete with one another in thelabor market, and labor in the form of star players is in short supply. Someargue that salary caps are necessary to preserve competitive balance. Salarycaps also help teams in limiting expenditures on players.Most professional sports in the United States have salary caps. The 2015salary cap for NFL teams, with fifty-three player rosters, is set at 143.28million (Patra 2015). Most teams have payrolls at or near the cap, making the average salary of an NFL player about 2.7 million. One playeron an NFL team may be designated as a franchise player, restricting thatplayer from entering free agency. The league sets minimum salaries forfranchise players. For example, a franchise quarterback has a minimumsalary of 18.544 million in 2015. The highest annual salary among NFLplayers is 22 million for Aaron Rodgers, Green Bay Packers quarterback(spotrac 2015c). The minimum annual salary is 420 thousand.NBA teams have a 70 million salary cap for the 2015–16 season, withpenalties for teams going over the cap. Maximum player salaries are basedon a percentage of cap and years of service. For example, LeBron James,with ten years of experience, would have a maximum salary of 23 million(Mahoney 2015). New Orleans Pelicans Anthony Davis’ average salary of 29 million is the highest among NBA players (spotrac 2015b). Team rostersinclude fifteen players under contract, with as many as thirteen available toplay in any particular game. The minimum annual salary is 428,498.Major League Baseball (MLB) has a “luxury tax” for teams with payrollsin excess of 189 million. There is a regular-player roster of twenty-fiveor twenty-six players for double-header days/nights. A forty-man rosterincludes players under contract and eligible to play. Between September1 and the end of the regular season the roster is expanded to forty players.The roster drops back to twenty-five players for the playoffs. The minimumMLB annual salary is 505,700 in 2015. The highest MLB annual salary is 31 million for Miguel Cabrera of the Detroit Tigers (spotrac 2015a).
Chapter 1. Understanding Sports MarketsTable 4252627282930TeamNew York YankeesLos Angeles DodgersBoston Red SoxSan Francisco GiantsChicago CubsSt Louis CardinalsNew York MetsLos An
sports analytics is the range of data sources and topics discussed. Many re-searchers focus on numerical performance data for teams and players. We take a broader view of sports analytics—the view of data science. There are text data as well as numeric data. And with the growth of the World Wide Web, the sources of data are plentiful.