Transcription
EthiopiaE UNICEF Ethiopia/2017/Julie-PudlowskiNational Budget BriefUpdated for 2016/17Key Messages Aggregate national spending has increased more than two-fold from ETB 163 billion in 2012/13 to ETB 334 billionin 2016/17 (an annual average growth rate of 17 per cent) with most of the spending going to public investmentsprimarily intended to ensure inclusive and equitable development. However, in real terms national spendingincreased from ETB 163 billion in 2012/13 to only ETB 231 billion in 2016/17 (an annual average growth rate of6.7 per cent). In terms of financing the national budget, although external assistance remains a key source of financing, itsfalling share in GDP as well as the declining share of this revenue as a percentage of total government revenueover the past several years is resulting in relatively greater reliance on domestic financing. The share of total government revenue to GDP was 16.3 per cent in 2016/17, which is a level much lower thanother countries in the eastern and southern Africa region, suggesting the availability of additional fiscal space toincrease government revenue. Ethiopia’s macroeconomic context of a low tax-to-GDP ratio (10.5 per cent), a high saving–investment gap (16.2per cent of GDP), a high current account deficit (10 per cent of GDP), and a high level of external debt (30.4 percent of GDP) in 2016/17, will necessitate boosting revenues and strategic spending options. Fostering taxpayereducation and sensitization, encouraging voluntary tax compliance and strengthening enforcement efforts cancontribute to the tax revenue base. Not all external funding is captured in the national budget, with significant resources directed through off-budgetchannels, making it difficult to track how much is being spent on social sectors, such as social protection, health,water and sanitation and education. A shift of off-budget support to on-budget records would enable improvedbudget assessments vis-à-vis development outcomes.This national overview budget brief, which is complemented by three further briefs on health, education, and socialprotection, analyses budget and expenditure that are recorded on-budget for the Federal Ministry of Finance (MoF)and its affiliated sub-national level Bureaus of Finance (BoF) and district-level Woreda Offices of Finance. Highlightsof the 2018/19 Federal Budget Proclamation is also provided. The main objective of this budget brief is to synthesizecomplex budget and expenditure information so that it is easily understood by stakeholders, to foster discourse,and where possible to inform policy and financial decision-making processes.
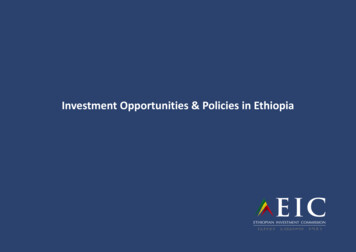
Lowering budget deficits coupled with targetedbudget subsidies have contributed to attaining asingle digit level of inflation. The overall inflationrate rose to 9.4 per cent in November 2017 from 7 percent in November 2016, mainly because of high foodinflation (Figure 2). Food inflation increased to 11.6per cent in November 2017, the highest rate since2013. By contrast, non-food inflation recorded thelowest increase in more than a decade, reaching 6.9per cent in November 2017. The relative slowdown innon-food inflation is likely due to the lagged effects ofdeclining international prices and tighter monetarypolicy measures over the past year.1. Macro and Socioeconomic ContextEthiopia has registered fast and broad-basedeconomic growth for the last decade, which hasprovided momentum for accelerated economicdevelopment. GDP per capita reached an all-timehigh of US 863 in 2016/17, which is more than a twofold increase from the 2010/11 level of US 396 percapita. Economic growth has remained robust, andreal GDP grew by 10.9 per cent in 2016/17, up from 8per cent in 2015/16, as agriculture fully recovered fromthe drought impact and grew by 14.7 per cent (Figure1). Overall growth has been driven by massivegovernment investment in infrastructure, as well aswholesale and retail trade services.Figure 2: Inflation rate (Consumer Price Index,comparing the current month versus the same monthlast year)40Figure 1: Real GDP growth (per 0.70.73.12.302.60.9Nov-10 Nov-11 Nov-12 Nov-13 Nov-14 Nov-15 Nov-16 152015/16Over all InflationNon-food Inflation2016/17Food InflationSource: Data from Central Statistical Agency (CSA).Other ServicesTrade and HotelConstructionAgricultureTransport and CommunicationOther IndustryManufacturingReal GDP growthBox 1: Key Macroeconomic Indicators Source: Data from the National Planning Commission (NPC).Historically, agriculture was the predominantsector in the Ethiopian economy. However, itscontribution to GDP has consistently declined.According to the 2016/17 National PlanningCommission (NPC) estimate, agriculture was thesecond highest contributor (35.9 per cent) to thecountry’s GDP and provides employment to almost 80per cent of the working population. Services andindustrial sectors have a 38.9 per cent and 25.2 percent share in GDP, respectively, in the same year. Thecontribution of the industrial sector to GDP has beenincreasing, albeit from a low base. This low levelindicates that economic transformation has yet to takeshape. To bring sustainable transformation of theeconomy, the Government of Ethiopia (GoE) needs topromote private investment, particularly in thestrategic priority area of the agro-processingmanufacturing sector and strengthen the industrialbase. GDP growth rate (2016/17, NPC): 10.9 per cent.GDP per capita (2016/17, NPC): US 863.Share of agriculture sector to GDP (2016/17, NPC):35.9 per cent.Share of service sector to GDP (2016/17, NPC):38.9 per cent.Share of industry sector to GDP (2016/17, NPC):25.2 per cent.Public debt-to-GDP ratio (2016/17, IMF): 53.8 percent.Overall inflation rate (November 2017, CentralStatistical Agency (CSA)): 9.4 per cent.Food inflation rate (November 2017, CSA): 11.6 percent.Non-food inflation rate (November 2017, CSA): 6.9per cent.Ethiopia’s strong growth has helped to achievesocial gains across sectors and halved povertyover the past decade. The incidence of poverty(poverty headcount) declined to 23.5 per cent in2
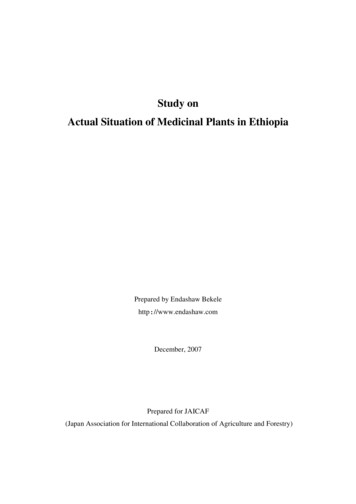
2015/16, from 38.7 per cent in 2004/051 (Figure 3).The sharp decline in poverty is partly attributable tothe implementation of social protection programmes,such as the Productive Safety Net Programme(PSNP), as well as urban food distribution andsubsidies.2 Despite the reduction in povertyheadcount, food poverty is high, with a large share ofhousehold spending going on food.3 Thus, foodsecurity is a concern that remains on top of thenational agenda.Despite the substantial results achieved over thepast decade, significant headwinds to growth andsocio-economic transformation remain. Accordingto the 2014 World Risk Report, Ethiopia is subject toincreased vulnerability to climate change, and it is oneof the countries with the highest lack of adaptivecapabilities worldwide. Drought represents the mainnatural threat which affects a significant proportion ofthe population each time it strikes. In 2015/16, forexample, drought exacerbated by El Niño, combinedwith extensive flooding, disease outbreaks and thedisruption of basic public services, continued to haveadverse impacts on the lives and livelihoods ofmillions of people. The negative consequences ofthese regular shocks, such as destruction of assetsand livelihoods, poverty, food insecurity anddisplacement, adversely affect the supply side of theeconomy, further threatening children’s well-being.The incidence and severity of child poverty is alsostill high in the country. According to povertyestimates based on the 2011 HouseholdConsumption and Expenditure Survey (HCES) andthe Welfare Monitoring Survey (WMS), the povertyheadcount for children was 32.4 per cent,4 comparedto 29.6 per cent5 for the whole population, whereas theextreme poverty headcount was 5.2 per cent forchildren, compared to 4.5 per cent for the entirepopulation. These represent 13 million and 2 millionchildren, respectively. Although the povertyheadcount figures show a declining trend in overallpoverty levels, in terms of multi-dimensional poverty,88 per cent of children in Ethiopia under the age of 18(36 million) lack access to basic services in at leastthree basic dimensions of the nine dimensionsstudied.6 Stark geographical inequalities exist, with 94per cent of children in rural areas multi-dimensionallydeprived compared to 42 per cent of children in urbanareas, while rates of child poverty range from 18 percent in Addis Ababa to 91 per cent in Afar, Amhara,and SNNPR. Oromia and Somali (90 per cent each),and Benishangul-Gumuz (89 per cent), also have highrates of poverty.7Box 2: Key Social Indicators Figure 3: People living below the national poverty line(per cent) 403530 38.73825 33.629.615 24.820 23.510 5 02004/05Poverty headcount2010/112015/16Total population (2017, CSA, 94.4 million).Child population below 5 years of age (2017, CSA,projection): 13.3 million.Population growth rate (Census, 2007): 2.6 percent.Poverty headcount rate (2017, NPC): 23.5 per cent.Food poverty headcount rate (2017, NPC): 24.8 percent.Child poverty headcount rate (2011 HCES/WMS,CSA): 32.4 per cent.Rank on Human Development Index (2017,UNDP): 173/186.Infant mortality per 1,000 births;( EDHS, 2016): 48.Maternal mortality rate (per 100,000 births EDHS,2016): 412.Stunting prevalence (children 5 years; EDHS,2016): 38 per cent.Female genital mutilation in 15–49 age group(EDHS, 2016): 65.2 per cent.Net Attendance Ratio (Primary, G1–8; EDHS,2016): 71.3 per cent.Gender Parity Index (Primary, G1–8; EDHS, 2016):1.01 per cent.Student-to-teacher ratio (G1–8; GESAA, 2015/16):46.Population using improved drinking water sources(EDHS, 2014): 52.7 per cent.Households practising open defecation (EDHS,2014): 34.3 per cent.Food poverty headcountSource: Household Consumption and Expenditure Surveys, CSA.National Planning Commission. September 2017. Ethiopia’s Progresstowards Eradicating Poverty፡ an Interim Report on 2015/16 Poverty AnalysisStudy.2African Development Bank. The 2016 African Economic Outlook (AEO),Ethiopia Country Note.3The World Bank. 2014. Ethiopia Poverty Assessment. Report No. AUS6744.4CSA, UNICEF and OPM. 2015. Child Well-Being in Ethiopia: Analysis ofChild Poverty using the HCES and WMS 2011 Datasets.5FDRE, Ministry of Finance and Economic Cooperation (MoFEC). 2013.Development and Poverty in Ethiopia 1995/96 to 2010/11.16UNICEF Ethiopia and Central Statistical Agency. 2019. Multi-dimensionalChild Deprivation in Ethiopia: First National Estimates. The nine dimensionsstudied were physical development (stunting), health, nutrition, education,health-related knowledge, information and participation, water, sanitationand housing).7ibid.3
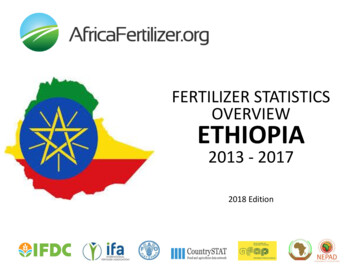
2. Aggregate Spending Trends and PrioritiesFigure 5: Total government expenditure (per cent ofGDP), 2016Aggregate national spending has increased more thantwo-fold, from ETB 163 billion in 2012/13 to about ETB334 billion in 2016/17, showing an annual averagegrowth rate of 17 per cent and 6.7 per cent in nominaland real terms, respectively (Figure 4). In per capitaterms, nominal spending has increased from ETB3130 in 2015/16 to ETB 3540 in 2016/17. The majorityof the budget has been going to public investments,primarily intended to ensure inclusive and equitabledevelopment. This demonstrates the government’sfirm determination to enhance and improve Ethiopia’ssocial and economic infrastructure and build thenation’s productive ure 4: Nominal and real spending (in billion ETB)400350334286300200Source: Data from the International Monetary Fund (IMF).231250193188163150231216170Pro-Poor National Spending10050It is evident that investments in social sectors are vitalin the fight against poverty and even more essentialfor children’s wellbeing. In essence, publicexpenditure has been aligned to poverty reductionpriorities in Ethiopia. Sub-national expenditures arealso consistent with poverty reduction goals. In thisregard, the GoE has leveraged huge resources toboost spending in what it refers to as the ‘main propoor sectors’, namely health, education, water andenergy (which includes all energy projects, such asthe construction of mega dams and power plants),roads, as well as agriculture and food security (withapproximately half of the agriculture budget allocatedto the PSNP).8 National expenditure on thesesectors averaged 64 per cent of total nationalexpenditure over the past five years (Figure 6).02012/132013/142014/15Nominal expenditure2015/162016/17Real expenditureSource: Data from Ministry of Finance (MoF). Real values arecalculated by the authors, with 2012/13 as the base year.In terms of allocation of expenditure across the broadcategories, on average, the largest share of thenational expenditure between 2012/13 and 2016/17was allocated to finance economic development,followed by social services, and finally administrativeand general services. Ethiopia’s general governmenttotal expenditure was 18.5 per cent of GDP in2016/17. Compared to selected sub-SaharanAfrican (SSA) countries, Ethiopia’s position is low,as depicted in Figure 5 below.8The World Bank. 2014. Ethiopia Poverty Assessment. Report No.AUS6744, p.v.4
Figure 6: Distribution of pro-poor expenditure (per centof total expenditure)expenditure to run and maintaininvestments that had been gure 7: Capital and recurrent expenditure (per cent oftotal 45410Water, energy and electricity expenditureHealth and nutrition expenditureAgriculture and food security expenditureRoad construction expenditureEducation expenditurePro-poor expenditure202012/132013/142014/15Recurrent Expenditure2015/162016/17Capital ExpenditureSource: Data from MoF.Source: Data from MoF.As shown in Figure 6 above, the strong commitmentto educational development is reflected in expenditureallocated to the sector, which has increased steadilysince 2012/13 to reach 27 per cent of total governmentexpenditure in 2016/17. Road construction as well asagriculture and food security each received 10 percent of national expenditure in 2016/17, while healthand nutrition, and water, energy and electricityreceived 8 per cent and 7 per cent of nationalspending respectively in the same period. Thedisproportionateallocationofbudgetaryresources to the water sector and specifically toinstitutional water and sanitation, mightnegatively affect educational outcomes and childand maternal health.Recurrent expenditure as a share of totalexpenditure increased consistently from 41 percent in 2013/14 to 55 per cent in 2016/17 (Figure 7).The higher share of recurrent expenditure in 2015/16and 2016/17 was in part due to the implementation ofsalary adjustments for public servants and anadditional supplementary budget for drought-affectedareas. During this period, half of the national recurrentexpenditure was channelled towards financingeducation, health and nutrition, water and energy,roads, as well as agriculture and food onalIn view of devolving fiscal decision-making tolower tiers of government, the GoE designed afiscal decentralization strategy with the specificobjective of promoting basic services to citizens.Accordingly, most of the budgetary resources (closeto 51.1 per cent) were being managed by the regionalgovernments in 2016/17 (Figure 8). Regionalgovernments are entitled to general and specificsector responsibilities, including basic social servicedelivery, such as the construction of primary andsecondary schools, health posts and health centres,water and sanitation, rural roads, agriculturedevelopment and natural resources protection. Thefederal government, on the other hand, is responsiblefor investing in highways, universities, powergeneration and dissemination, natural resourcesdevelopment and food security, which areimplemented throughout the country.Recurrent versus Capital ExpenditureBefore 2014/15, the national expenditure patternmainly focused on allocating more resource forbuilding economic and social infrastructure toprovide basic services. To this end, the lion’s shareof the annual budget was devoted to capitalexpenditure, which is critical to bringing future benefitsthrough building physical assets and infrastructures,as well as promoting human resources development.Recently, however, capital expenditure as a share oftotal expenditure declined consistently from 59 percent in 2013/14 to 45 per cent in 2016/17 (Figure 7).Although both capital and recurrent expenditure areincreasing in absolute terms, the share of capital intotal expenditure is declining. Past capital spendingwill also require increased current and future recurrent5
Figure 8: Federal and regional expenditure (per cent oftotal spending)Budget CredibilityWithin a context of an increasing budget, Ethiopiafaces resource constraints to adequately meet itsfinancing needs which can be exacerbated byinefficient budget utilization. In order for the budgetto be an effective instrument of implementation ofpublic policies, it is important that it is realisticand that it is implemented as it was approved.Budget credibility is measured as actual expenditureas a share of the original approved budget. In thisregard, the credibility of the federal government’sbudget indicates that the actual amounts spent werenot very different from the approved budget, except in2015/16 (Figure 10). Budget credibility would beexpected to show deviation as a result ofsupplementary budgets that are approved halfwaythrough the fiscal year. A budget increase later in thefiscal year would be harder to spend effectively. Otherreasons for deviation from the original approvedbudget could probably be limited capacity for budgetpreparation and forecasting, and unpredictability ofexternal 48.970%60%50%40%30%20%10%0%2012/13 2013/14 2014/15 2015/16 2016/17Federal expenditureRegional expenditureSource: Data from MoF.Compared to the regional governments, thefederal government is spending a larger portion ofits budgetary resource on capital expenditure inan effort to address the infrastructure gapthroughout the country. The federal government’sshare in total recurrent spending has declined from 46per cent in 2015/16 to a low of 39 per cent in 2016/17(Figure 9). Regional governments are primarilyundertaking recurrent expenditure, leaving moreresponsibility for the federal government to financelarge, countrywide, capital investment projects. As aresult, and as can be seen in Figure 9, regionalgovernments’ share of total recurrent expenditure ishigher than the federal government’s share. Thisimplies that the bulk of the national recurrentexpenditure (close to 61 per cent) was allocated tofinance regional-level recurrent spending in 2016/17.Figure 10: Federal government budget ure 9: Federal and regional capital and recurrentspending (per cent of total capital andrecurrent spending)2014/152015/162016/17Source: Data from MoF (information for sub-national levels ofgovernment has not been made available).100%80%363737463. Financing the National Budget39The overall government budget is financed fromdomestic and external sources, with the latterconsisting of borrowing and assistances in the form ofgrants from bilateral and multilateral developmentpartners. With increases over time in both domesticand external revenue sources, total revenue(including external grants and loan) increasedsignificantly from ETB 267 billion in 2015/16 to ETB294 billion in 2016/17. However, total governmentrevenue declined from 17.3 per cent of GDP in2015/16 to 16.3 per cent in 2016/17 (Figure 11),which is a level much lower than other countriesin the eastern and southern Africa region,suggesting the availability of additional fiscalspace to increase government revenue that can al capital expenditureFederal recurrent expenditure2015/162016/17Federal capital expenditureRegional recurrent expenditureSource: Data from MoF.6
channelled towards further investment in thesocial sectors. External assistance continues to be akey source of financing and its share in GDP hasincreased from 2.2 percent in 2015/16 to 2.5 percentin 2016/17. However, considering its trend since2012/13, its share in GDP has been decliningindicating relatively greater reliance on domesticfinancing.concerned, annual income below ETB 7,000 is freefrom income tax.Figure 12: Domestic revenue sources (per cent ofdomestic revenue)100.090.016.680.0Figure 11: Sources of government budget (per cent 111.829.42012/1313.72013/142014/15Direct taxesIndirect taxes (domestic)4.02015/162016/17Foreign trade taxesNon-tax revenueSource: Data from MoF.2.00.02012/132013/14Domestic revenueExternal loan2014/152015/162016/17Among the major domestic revenue sources,indirect tax such as Value Added Tax (VAT) hasbecome an important and growing source ofrevenue to the national government. The share ofdomestic VAT revenue averaged 22.8 per cent ofdomestic revenue for the past five years (Figure 12).Foreign trade taxes entirely collected from importedgoods make up the largest share of the total domesticrevenue next to direct tax, averaging 28.8 per cent forthe past five years. On the other hand, domesticrevenue collected from non-tax sources, mainlygenerated from government fees and charges,contribute less to government finance. Less relianceon non-tax sources indicates the low level of fees andcharges attached to basic government services. Theshare between tax and non-tax revenue sourcesshows a relatively constant trend over time.External grantTotal revenueSource: Data from MoF.In terms of domestic financing, Ethiopia generatesthe majority of its resources from taxes, whichamounted to 76.5 per cent of domestic revenue in2016/17, lowering from 88.2 per cent in 2013/14. Asan agrarian economy that is not fully monetized, witha large, untaxed, non-agrarian informal sector, thecontribution of direct tax sources remains relativelylimited, and its average share remained constant ataround 31 per cent of domestic revenue in the pastfive years (Figure 12). While contributing about 35.9per cent of the national GDP, agriculture provides lessthan 0.5 per cent of tax revenue in 2016/17. Most ofthe revenues from direct taxes are generated frompayroll tax and taxes on profits of enterprises andindividuals.The tax-to-GDP ratio remains low (10.5 per cent ofGDP in 2016/17) compared to the sub-Saharanaverage of 18 per cent. Thus, fostering taxpayereducation and sensitization, encouraging voluntarytax compliance and strengthening enforcement effortscan contribute to the tax revenue base. Ethiopia’smacroeconomic context of a low tax-to-GDP ratio, ahigh saving–investment gap (16.2 per cent of GDP), ahigh current acco
Development and Poverty in Ethiopia 1995/96 to 2010/11. Despite the substantial results achieved over the past decade, significant headwinds to growth and socio-economic transformation remain. According to the 2014 World Risk Report, Ethiopia is subject to increased vulnerability to climate change, and it is one