Transcription
FEDERAL RESERVE BANK OF ST. LOUISSUPERVISORY POLICY ANALYSIS WORKING PAPERWorking Paper 2007-05Understanding the Subprime Mortgage CrisisYuliya DemyanykEconomistFederal Reserve Bank of St. LouisOtto Van HemertAssistant ProfessorNew York UniversityThis draft: August 2008The views expressed in this paper are those of the author(s), not necessarily those of the FederalReserve Bank of St. Louis or the Federal Reserve System.
Understanding the Subprime Mortgage CrisisYuliya Demyanyk, Otto Van Hemert This Draft: August 19, 2008First Draft: October 9, 2007AbstractUsing loan-level data, we analyze the quality of subprime mortgage loans by adjusting their performance for differences in borrower characteristics, loan characteristics, and house price appreciationsince origination. We find that the quality of loans deteriorated for six consecutive years before thecrisis and that securitizers were, to some extent, aware of it. We provide evidence that the rise and fallof the subprime mortgage market follows a classic lending boom-bust scenario, in which unsustainablegrowth leads to the collapse of the market. Problems could have been detected long before the crisis,but they were masked by high house price appreciation between 2003 and 2005. Demyanyk: Banking Supervision and Regulation, Federal Reserve Bank of St. Louis, P.O. Box 442, St. Louis, MO63166, Yuliya.Demyanyk@stls.frb.org. Van Hemert: Department of Finance, Stern School of Business, New York University,44 W. 4th Street, New York, NY 10012, ovanheme@stern.nyu.edu. The authors would like to thank Cliff Asness, JoostDriessen, William Emmons, Scott Frame, Xavier Gabaix, Dwight Jaffee, Ralph Koijen, Andreas Lehnert, Chris Mayer,Andrew Meyer, Toby Moskowitz, Lasse Pedersen, Robert Rasche, Matt Richardson, Stefano Risa, Bent Sorensen, Stijn VanNieuwerburgh, James Vickery, Jeff Wurgler, and seminar participants at the Federal Reserve Bank of St. Louis, the FloridaAtlantic University, the International Monetary Fund, the second New York Fed – Princeton liquidity conference, LehmanBrothers, the Baruch-Columbia-Stern real estate conference, NYU Stern Research Day, Capula Investment Management, AQRCapital Management, the Conference on the Subprime Crisis and Economic Outlook in 2008 at Lehman Brothers, FreddieMac, Federal Deposit and Insurance Corporation (FDIC), US Securities and Exchange Comission (SEC), Office of FederalHousing Enterprise Oversight (OFHEO), Board of Governors of the Federal Reserve System, Carnegie Mellon University,Baruch, University of British Columbia, University of Amsterdam, the 44th Annual Conference on Bank Structure andCompetition at the Federal Reserve Bank of Chicago, and the Federal Reserve Research and Policy Activities Pertainingto the Recent Turmoil in Financial Markets, Atlanta. The views expressed are those of the authors and do not necessarilyreflect the official positions of the Federal Reserve Bank of St. Louis or the Federal Reserve System.
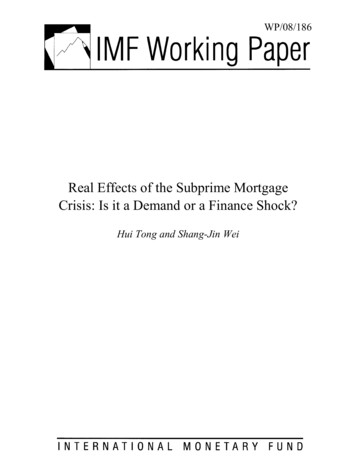
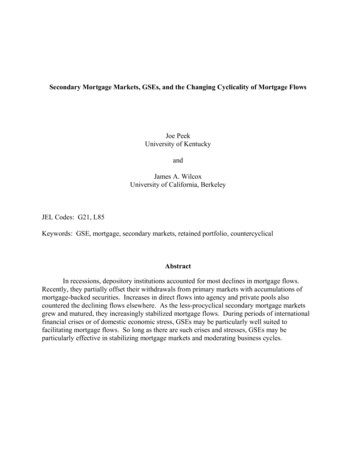
1IntroductionThe subprime mortgage crisis of 2007 was characterized by an unusually large fraction of subprime mortgages originated in 2006 and 2007 being delinquent or in foreclosure only months later. The crisis spurredmassive media attention; many different explanations of the crisis have been suggested. The goal of thispaper is to answer the question: “What do the data tell us about the possible causes of the crisis?” Tothis end we use a loan-level database containing information on about half of all U.S. subprime mortgagesoriginated between 2001 and 2007.The relatively poor performance of vintages 2006 and 2007 loans is illustrated in Figure 1 (left panel).At every mortgage loan age, loans originated in 2006 and 2007 show a much higher delinquency rate thanloans originated in earlier years at the same ages.Figure 1: Actual and Adjusted Delinquency RateThe figure shows the age pattern in the actual (left panel) and adjusted (right panel) delinquency rate for the different vintage years.Delinquency is defined as being 60 or more days late with the monthly mortgage payment, in foreclosure, real-estate owned, or defaulted.The adjusted delinquency rate is obtained by adjusting the actual rate for year-by-year variation in FICO scores, loan-to-value ratios,debt-to-income ratios, missing debt-to-income ratio dummies, cash-out refinancing dummies, owner-occupation dummies, documentationlevels, percentage of loans with prepayment penalties, mortgage rates, margins, house price appreciation since origination, compositionof mortgage contract types, and origination amounts.Actual Delinquency Rate (%)32Adjusted Delinquency Rate 00520042003200220011412108126844200246810 12 14 16Age (Months)18202224246810 12 14 16Age (Months)18202224We document that the poor performance of the vintage 2006 and 2007 loans was not confined to aparticular segment of the subprime mortgage market. For example, fixed-rate, hybrid, purchase-money,cash-out refinancing, low-documentation, and full-documentation loans originated in 2006 and 2007 allshowed substantially higher delinquency rates than loans made the prior five years. This contradicts a1
widely-held belief that the subprime mortgage crisis was mostly confined to hybrid or low-documentationmortgages.We explore to what extent the subprime mortgage crisis can be attributed to different loan characteristics, borrower characteristics, and subsequent house price appreciation. The subsequent house priceappreciation is measured as the MSA-level house price change between the moment of origination andthe moment of loan performance evaluation. For the empirical analysis, we run logit regressions with theprobability of delinquency being a function of these factors.We find that loan and borrower characteristics are very important in terms of explaining the crosssection of loan performance. However, because these characteristics were not sufficiently different in 2006and 2007 compared with the prior five years, they cannot explain the unusually weak performance ofvintage 2006 and 2007 loans. For example, a one-standard-deviation increase in the debt-to-income ratioraises the probability of delinquency 12 months after origination by as much as 1.1 percentage points.However, because the average debt-to-income ratio was only 0.2 standard deviations higher in 2006 thanits level in previous years, it contributes very little to explain the inferior performance of vintage 2006loans. The only variable in the considered logit regression model that contributed substantially to thecrisis is the low subsequent house price appreciation for vintage 2006 and 2007 loans, which can explainabout a 2 to 4 percentage points higher-than-average delinquency rate 12 months after origination.1 Dueto geographical heterogeneity in house price changes, some areas have experienced larger-than-averagehouse price declines and therefore have a larger explained increase in delinquency and foreclosure rates.2We analyze the quality of loans based on their performance, adjusted for differences in observed loancharacteristics, borrower characteristics, and subsequent house price appreciation. For the analysis, wecompute the prediction error as the difference between the actual delinquency rate and the estimatedprobability of delinquency based on the logit regression model. In Figure 1 (right panel) we plot theadjusted delinquency rates, which are obtained by adding up the prediction errors and the weightedaverage actual rates. This ensures having the same weighted average for the actual (Figure 1, left panel)and adjusted (Figure 1, right panel) delinquency rates.As shown in Figure 1 (right panel), the adjusted delinquency rates have been steadily rising for thepast seven years. In other words, loan quality—adjusted for observed characteristics and subsequent house1Other papers that research the relationship between house prices and mortgage financing include Genesove and Mayer(1997), Genesove and Mayer (2001), and Brunnermeier and Julliard (2007).2Also, house price appreciation may differ in cities versus rural areas. See for example Glaeser and Gyourko (2005) andGyourko and Sinai (2006).2
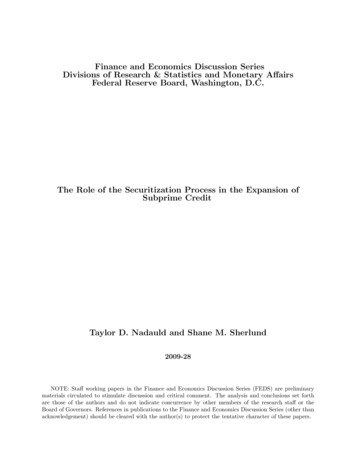
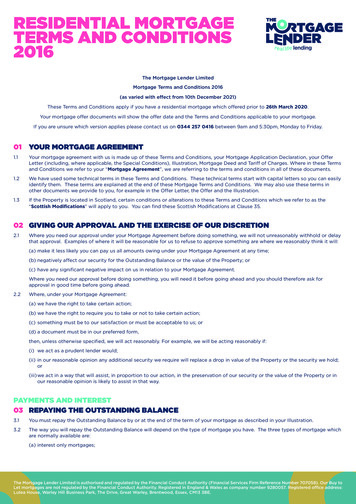
price appreciation—deteriorated monotonically between 2001 and 2007. Interestingly, 2001 was amongthe worst vintage years in terms of actual delinquency and foreclosure rates, but is in fact the best vintageyear in terms of the adjusted rates. High interest rates, low average FICO credit scores, and low houseprice appreciation created the “perfect storm” in 2001, resulting in a high actual delinquency rate; afteradjusting for these unfavorable circumstances, however, the adjusted delinquency rates are low.In addition to the monotonic deterioration of loan quality, we show that over time the average combinedloan-to-value ratio increased, the fraction of low documentation loans increased, and the subprime-primerate spread decreased. The rapid rise and subsequent fall of the subprime mortgage market is thereforereminiscent of a classic lending boom-bust scenario.3 The origin of the subprime lending boom has oftenbeen attributed to the increased demand for so-called private-label mortgage-backed securities (MBSs)by both domestic and foreign investors. Our database does not allow us to directly test this hypothesis,but an increase in demand for subprime MBSs is consistent with our finding of lower spreads and highervolume. Mian and Sufi (2008) find evidence consistent with this view that increased demand for MBSsspurred the lending boom.The logit regression specification used to compute the adjusted delinquency and foreclosure ratesassumes that the regression coefficients on the different explanatory variables remain constant over time.We test the validity of this assumption for all variables and find that it is the most strongly rejected forthe loan-to-value (LTV) ratio. High-LTV borrowers in 2006 and 2007 were riskier than those in 2001 interms of the probability of delinquency or foreclosure, for given values of the other explanatory variables.Were securitizers aware of the increasing riskiness of high-LTV borrowers?4 To answer this question, weanalyze the relationship between the mortgage rate and LTV ratio (along with the other loan and borrowercharacteristics). We perform a cross-sectional ordinary least squares (OLS) regression, with the mortgagerate as the dependent variable, for each quarter from 2001Q1 to 2007Q2 for both fixed-rate mortgagesand 2/28 hybrid mortgages. Figure 2 shows that the coefficient on the first-lien LTV variable, scaled bythe standard deviation of the first-lien LTV ratio, has been increasing over time. We thus find evidencethat securitizers were aware of the increasing riskiness of high-LTV borrowers, and adjusted mortgage3Berger and Udell (2004) discuss the empirical stylized fact that during a monetary expansion lending volume typicallyincreases and underwriting standards loosen. Loan performance is the worst for those loans underwritten toward the endof the cycle. Demirgüç-Kunt and Detragiache (2002) and Gourinchas, Valdes, and Landerretche (2001) find that lendingbooms raise the probability of a banking crisis. Dell’Ariccia and Marquez (2006) show in a theoretical model that a changein information asymmetry across banks might cause a lending boom that features lower standards and lower profits. Ruckes(2004) shows that low screening activity may lead to intense price competition and lower standards.4For loans that are securitized (as are all loans in our database), the securitizer effectively dictates the mortgage ratecharged by the originator.3
rates accordingly.Figure 2: Sensitivity of Mortgage Rate to First-Lien Loan-to-Value RatioThe figure shows the effect of the first-lien loan-to-value ratio on the mortgage rate for first-lien fixed-rate and 2/28 hybrid mortgages.The effect is measured as the regression coefficient on the first-lien loan-to-value ratio (scaled by the standard deviation) in an ordinaryleast squares regression with the mortgage rate as the dependent variable and the FICO score, first-lien loan-to-value ratio, second-lienloan-to-value ratio, debt-to-income ratio, missing debt-to-income ratio dummy, cash-out refinancing dummy, owner-occupation dummy,prepayment penalty dummy, origination amount, term of the mortgage, prepayment term, and margin (only applicable to 2/28 hybrid)Scaled Regression Coefficient (%)as independent variables. Each point corresponds to a separate regression, with a minimum of 18,784 observations.5FRM2/28 Hybrid.4.3.2.102001200220032004Year200520062007We show that our main results are robust to analyzing mortgage contract types separately, focussingon foreclosures rather than delinquencies, and numerous different regression specifications like allowingfor interaction effects between different loan and borrower characteristics. The latter includes taking intoaccount risk-layering—the origination of loans that are risky in several dimensions, such as the combinationof a high LTV ratio and a low FICO score.As an extension, we estimate our regression model using data just through year-end 2005 and againobtain the continual deterioration of loan quality since 2001. This means that the seeds for the crisis weresown long before 2007, but detecting them was complicated by high house price appreciation between2003 and 2005—appreciation that masked the true riskiness of subprime mortgages.There is a large literature on the determinants of mortgage delinquencies and foreclosures, datingback to at least Von Furstenberg and Green (1974). Recent contributions include Cutts and Van Order(2005) and Pennington-Cross and Chomsisengphet (2007).5 Other papers analyzing the subprime crisis5Deng, Quigley, and Van Order (2000) discuss the simultaneity of the mortgage prepayment and default option. Campbelland Cocco (2003) and Van Hemert (2007) discuss mortgage choice over the life cycle.4
include Gerardi, Shapiro, and Willen (2008), Mian and Sufi (2008), DellAriccia, Igan, and Laeven (2008),and Keys, Mukherjee, Seru, and Vig (2008). Our paper makes several novel contributions. First, wequantify how much different determinants have contributed to the observed high delinquency rates forvintage 2006 and 2007 loans, which led up to the 2007 subprime mortgage crisis. Our data enablesus to show that the effect of different loan-level characteristics as well as low house price appreciationwas quantitatively too small to explain the poor performance of 2006 and 2007 vintage loans. Second,we uncover a downward trend in loan quality, determined as loan performance adjusted for differencesin loan and borrower characteristics as well as subsequent house price appreciation. We further showthat there was a deterioration of lending standards and a decrease in the subprime-prime mortgage ratespread during the 2001–2007 period. Together these results provide evidence that the rise and fall of thesubprime mortgage market follows a classic lending boom-bust scenario, in which unsustainable growthleads to the collapse of the market. Third, we show that continual deterioration of loan quality could havebeen detected long before the crisis by means of a simple statistical exercise. Fourth, securitizers were,to some extent, aware of this deterioration over time, as evidenced by changing determinants of mortgagerates.The structure of this paper is as follows. In Section 2 we show the descriptive statistics for the subprimemortgages in our database. In Section 3 we present the econometric results and discuss explanatory factorsfor delinquency. In Section 4 we discuss the increasing riskiness of high-LTV borrowers, and the extentto which securitizers were aware of this risk. In Section 5 we analyze the subprime-prime rate spread andin Section 6 we conclude. We provide several additional robustness checks in the appendices.2Descriptive AnalysisIn this paper we use the First American CoreLogic LoanPerformance (henceforth: LoanPerformance)database, which covers loan-level data on about 85 percent of all securitized subprime mortgages; morethan half of the U.S. subprime mortgage market.6 Since the first version of this paper in October 2007,LoanPerformance has responded to the request by trustees’ clients to reclassify some of its subprimeloans to Alt-A status. While it is not clear to us whether the pre- or post-classification subprime datais the most appropriate for research purposes, it is reassuring that our results proved to be robust to6Mortgage Market Statistical Annual (2007) reports securitization shares of subprime mortgages each year from 2001 to2006 equal to 54, 63, 61, 76, 76, and 75 percent respectively.5
the reclassification. In this version we focus on the post-classification data. In Appendix A we providemore details on the reclassification of the LoanPerformance database and show the robustness of our mainresults to using pre-reclassification data.There is no consensus on the exact definition of a subprime mortgage loan. The term subprime can beused to describe certain characteristics of the borrower (e.g., a FICO credit score less than 620),7 lender(e.g., specialization in high-cost loans),8 security of which the loan can become a part (e.g., high projecteddefault rate for the pool of underlying loans), or mortgage contract type (e.g., no money down and nodocumentation provided, or 2/28 hybrid). The common element across definitions of a subprime loan isa high default risk. In this paper, subprime loans are those underlying subprime securities. We do notinclude less-risky Alt-A mortgage loans in our analysis. We focus on first-lien loans and consider the 2001through 2008 sample period.We first discuss the main characteristics of the loans in our database at origination. Second, we discussthe delinquency rates of these loans for various segments of the subprime mortgage market.2.1Loan Characteristics at OriginationTable 1 provides the descriptive statistics for the subprime mortgage loans in our database that wereoriginated between 2001 and 2007. In the first block of Table 1 we see that the annual number oforiginated loans increased by a factor four between 2001 and 2006. The average loan size almost doubledover those five years. The total dollar amount originated in 2001 was 57 billion, while in 2006 it was 375billion. In 2007, in the wake of the subprime mortgage crisis, the dollar amount originated fell sharply to 69 billion, primarily originated in the first half of 2007.In the second block of Table 1, we split the pool of mortgages into four main mortgage contract types.Most numerous are the hybrid mortgages, accounting for more than half of all our subprime loans. Ahybrid mortgage carries a fixed rate for an initial period (typically 2 or 3 years) and then the rate resets toa reference rate (often the 6-month LIBOR) plus a margin. The fixed-rate mortgage contract has becomeless popular in the subprime market over time and accounted for just 20 percent of the total number of7The Board of Governors of the Federal Reserve System, The Office of the Controller of the Currency,the Federal Deposit Insurance Corporation, and the Office of Thrift Supervision use this definition.See 1a.html8The U.S. Department of Housing and Urban Development uses HMDA data and interviews lenders to identify subprimelenders among them. There are, however, some subprime lenders making prime loans and some prime lenders originatingsubprime loans.6
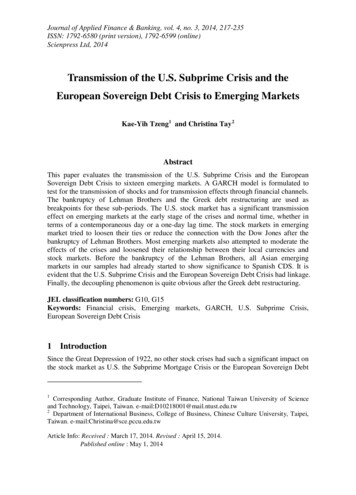
Table 1: Loan Characteristics at Origination for Different VintagesDescriptive statistics for the first-lien subprime loans in the LoanPerformance database.2001200220032004200520062007SizeNumber of Loans (*1000)452737 1, 258 1, 911 2, 274 1, 772316Average Loan Size (* 1000)126145164180200212220Mortgage TypeFRM (%)33.229.033.623.818.619.927.5ARM (%)0.40.40.30.30.40.40.2Hybrid (%)59.968.265.375.876.854.543.8Balloon (%)6.52.50.80.24.225.228.5Loan PurposePurchase (%)29.729.330.135.841.342.429.6Refinancing (cash out) (%)58.457.457.756.552.451.459.0Refinancing (no cash out) (%)11.212.911.87.76.36.211.4Variable MeansFICO Score601.2 608.9618.1618.3620.9618.1 613.2Combined Loan-to-Value Ratio (%)79.480.182.083.684.985.982.8Debt-to-Income Ratio (%)38.038.538.939.440.241.141.4Missing Debt-to-Income Ratio Dummy .2Documentation Dummy (%)76.570.467.866.463.462.366.7Prepayment Penalty Dummy (%)75.975.374.073.172.571.070.2Mortgage Rate (%)9.78.77.77.37.58.48.6Margin for ARM and Hybrid Mortgage Loans (%)6.46.66.36.15.96.16.0Investor Dummy (%)7
loans in 2006. In contrast, in the prime mortgage market, most mortgage loans are of the fixed-rate type.9In 2007, in the wake of the subprime mortgage crisis, it increased again to 28%. The proportion of balloonmortgage contracts jumped substantially in 2006, and accounted for 25 percent of the total number ofmortgages originated that year. A balloon mortgage does not fully amortize over the term of the loanand therefore requires a large final (balloon) payment. Less than 1 percent of the mortgages originatedover the sample period were adjustable-rate (non-hybrid) mortgages.In the third block of Table 1, we report the purpose of the mortgage loans. In about 30 to 40 percentof cases, the purpose is to finance the purchase of a house. Approximately 55 percent of our subprimemortgage loans were originated to extract cash, by refinancing an existing mortgage loan into a larger newmortgage loan. The share of loans originated in order to refinance with no cash extraction is relativelysmall.In the final block of Table 1, we report the mean values for the variables that we will use in theregression analysis (see Table 2 for a definition of these variables). The average FICO credit score rose20 points between 2001 and 2005. The combined loan-to-value (CLTV) ratio, which measures the valueof all-lien loans divided by the value of the house, slightly increased over 2001–2006, primarily becauseof the increased popularity of second-lien and third-lien loans. The (back-end) debt-to-income ratio (ifprovided) and the fraction of loans with a prepayment penalty were fairly constant. For about a thirdof the loans in our database, no debt-to-income ratio was provided (the reported value in those cases iszero); this is captured by the missing debt-to-income ratio dummy variable. The share of loans with fulldocumentation fell considerably over the sample period, from 77 percent in 2001 to 67 percent in 2007.The mean mortgage rate fell from 2001 to 2004 and rebounded after that, consistent with movements inboth the 1-year and 10-year Treasury yields over the same period. Finally, the margin (over a referencerate) for adjustable-rate and hybrid mortgages stayed rather constant over time.We do not report summary statistics on the loan source, such as whether a mortgage broker intermediated, as the broad classification used in the database rendered this variable less informative.9For example Koijen, Van Hemert, and Van Nieuwerburgh (2007) show that the fraction of conventional, single-family,fully amortizing, purchase-money loans reported by the Federal Housing Financing Board in its Monthly Interest Rate Surveythat are of the fixed-rate type fluctuated between 60 and 90 percent from 2001 to 2006. Vickery (2007) shows that empiricalmortgage choice is affected by the eligibility of the mortgage loan to be purchased by Fannie Mae and Freddie Mac.8
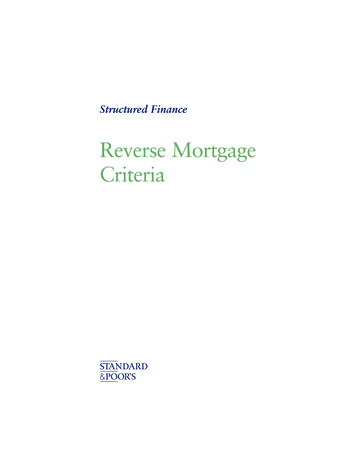
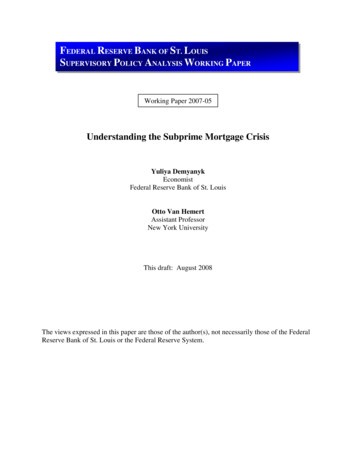
2.2Performance of Loans by Market SegmentsIn Figure 1 (left panel) we showed that for the subprime mortgage market as a whole, vintage 2006 and2007 loans stand out in terms of high delinquency rates (for variable definitions, see Table 2). In Figure3, we again plot the age pattern in the delinquency rate for vintages 2001 through 2007 and split thesubprime mortgage market into various segments. As the figure shows, the poor performance of the 2006and 2007 vintages is not confined to a particular segment of the subprime market, but rather reflects amarket-wide phenomenon.In the six panels of Figure 3 we see that for hybrid, fixed-rate, purchase-money, cash-out refinancing,low-documentation, and full-documentation mortgage loans, the 2006 and 2007 vintages show the highestdelinquency rate pattern. In general, vintages 2001 and 2005 come next in terms of delinquency rates,and vintage 2003 loans have the lowest delinquency rates. Notice that the scale of the vertical axis differsacross the panels. The delinquency rates for the fixed-rate mortgages (FRMs) are lower than those forhybrid mortgages but exhibit a remarkably similar pattern across vintage years.In Figure 4 we plot the delinquency rates of all outstanding mortgages. Notice that the fraction ofFRMs that are delinquent remained fairly constant from 2005Q1 to 2007Q2. These rates are consistentwith those used in an August 2007 speech by the Chairman of the Federal Reserve System (Bernanke(2007)), who said “For subprime mortgages with fixed rather than variable rates, for example, seriousdelinquencies have been fairly stable.” It is important, though, to realize that this result is driven by anaging effect of the FRM pool, caused by a decrease in the popularity of FRMs over 2001-2006 (see Table1). In other words, FRMs originated in 2006 in fact performed unusually poorly (Figure 3, upper-rightPanel), but if one plots the delinquency rate of outstanding FRMs over time (Figure 4, left Panel), theweaker performance of vintage 2006 loans is masked by the aging of the overall FRM pool.3Empirical Analysis of Delinquency DeterminantsIn this section we investigate to what extent a logit regression model can explain the high levels ofdelinquencies for the vintage 2006 and 2007 mortgage loans in our database. All results in this sectionare based on a random sample of one million first-lien subprime mortgage loans, originated between 2001and 2007.9
Figure 3: Actual Delinquency Rate for Segments of the Subprime Mortgage MarketThe figure shows the age pattern in delinquency rate for the different vintages. Each of the six panels focuses on a different segment ofthe subprime mortgage market.Hybrid Mortgage Loans (%)32Fixed Rate Mortgage 6200520042003200220011412108126844200246810 12 14 16Age (Months)1820222424Purchase Money Mortgage Loans362824201612840246810 12 14 16Age (Months)18202224242016182022246810 12 14 16Age (Months)182022242224Low or No Doc Mortgage Loans3220072006200520042003200220012410 12 14 16Age (Months)2007200620052004200320022001Full Documentation Mortgage Loans288Cash Out Refinancing Morgage 0246810 12 14 16Age (Months)1820222421046810 12 14 16Age (Months)1820
Figure 4: Actual Delinquency Rates of Outstanding MortgagesThe Figure shows the actual delinquency rates of all outstanding FRMs and hybrids from January 2000 through June 2008.Actual Delinquency Rate (%)4035FRMHybrid3025201510502000 2001 2002 2003 2004 2005 2006 2007 2008Year3.1Empirical Model SpecificationWe run the following logit regressionPr(event) Φ(β 0 X),(1)where the event is delinquency of a subprime mortgage loan after a given number of months; Φ(x) 1/(1 exp( x)) is the logit function; X is the vector of explanatory variables; and β is the vector ofregression coefficients. We will report the following statistics for each explanatory variable i:marginali Φ(β 0 X̄ βi σi ) Φ(β 0 X̄)deviation01i (X01i X̄i )/σicontribution01i Φ(β 0 X̄ βi (X01i X̄i )) Φ(β 0 X̄) marginali deviation01i(2)(3)(4)(5)where X̄ is the vector with mean values, σi is the standard deviation of the i-th variable, and X01i is themean value of the i-th variable for vintage 2001 loans. We define mean value, deviation, and contributionfor vintage years other than 2001 in a similar fashion. Equation (5) emerges from a first-order Taylorapproximation with the derivative of the logit function with respect to the i-th variable approximated by11
marginali .10 The marginal statistic measures the effect of a one-standard-deviation increase in a variable(from its mean) on the probability of an event. The deviation statistic measures the number of standarddeviations that the mean value of a variable in a particular vintage year was different from the mean valuemeasured over the entire sample. The contribution statistic measures the deviation of the (average) eventprobability in a particular vintage year from the (average) event probability over the entire sample thatcan be explained by a particular variable.For any subgroup of loans, such as a particular vintage, we can determine the predicted probability ofan event by computing:predicted LXΦ(β 0 X j )/L,(6)j 1where the superscript j refers to the loan number and L is the total number of loans in the subgroup.3.2Variable DefinitionsTable 2 provides the definitions of the dependent and independent (explanatory) variables used in theempirical analysis. We use the delinquency dummy variable as the dependent variable for the mainanalysis and consider a foreclosure dummy variable in Appendix B. We define a loan to be delinquent ifpayments on the loan are 60 or more days late, or the loan is reported as in foreclosure, real estate owned,or default. We do not always observe for a terminated loan whether the loan was prepaid or there wasa default. In those cases we classify a terminated loan as a default if in the prior month the loan was inforeclosure, and as a prepayment otherwise. In Appendix C we provide a robustness check by omittingall terminated loans.The borrower and loan characteristics we use in the analysis are: the FICO credit score, the combinedloan-to-value ratio, the value of the debt-to-income ratio (when provided), a dummy variable indicatingwhether the debt-to-income ratio was missing (reported as zero), a dummy variable
The subprime mortgage crisis of 2007 was characterized by an unusually large fraction of subprime mort-gages originated in 2006 and 2007 being delinquent or in foreclosure only months later. The crisis spurred massive media attention; many difierent explanations of the crisis have been suggested. The goal of this