Transcription
A&A 621, L6 stronomy&Astrophysicsc ESO 2019LETTER TO THE EDITORThe angular momentum of disc galaxies at z 1A. Marasco1,2 , F. Fraternali1 , L. Posti1 , M. Ijtsma1 , E. M. Di Teodoro3 , and T. Oosterloo1,2123Kapteyn Astronomical Institute, University of Groningen, PO Box 800, 9700 AV Groningen, The Netherlandse-mail: marasco@astro.rug.nlASTRON, Netherlands Institute for Radio Astronomy, Oude Hoogeveensedijk 4, 7991 PD Dwingeloo, The NetherlandsResearch School of Astronomy and Astrophysics – The Australian National University, Canberra, ACT 2611, AustraliaReceived 18 October 2018 / Accepted 20 December 2018ABSTRACTWe investigate the relation between stellar mass (M? ) and specific stellar angular momentum ( j? ), or “Fall relation”, for a sampleof 17 isolated, regularly rotating disc galaxies at z 1. All galaxies have rotation curves determined from Hα emission-line data;HST imaging in optical and infrared filters; and robust determinations of their stellar masses. We use HST images in f814w andf160w filters, roughly corresponding to rest-frames B and I bands, to extract surface-brightness profiles for our systems. We robustlybracket j? by assuming that rotation curves beyond the outermost Hα rotation point stay either flat or follow a Keplerian fall-off. Bycomparing our measurements with those determined for disc galaxies in the local universe, we find no evolution in the Fall relation inthe redshift range 0 z 1, regardless of the band used and despite the uncertainties in the stellar rotation curves at large radii. Thisresult holds unless stellar masses at z 1 are systematically underestimated by &50%. Our findings are compatible with expectationsbased on a ΛCDM cosmological framework and support a scenario where both the stellar Tully–Fisher and mass-size relations forspirals do not evolve significantly in this redshift range.Key words. galaxies: kinematics and dynamics – galaxies: evolution – galaxies: high-redshift – galaxies: photometry1. IntroductionThe stellar mass M? and angular momentum J? of agalaxy are two fundamental properties that are related qualitatively to the amount of material in the system, its rotational speed, and its size. Observationally, as first derivedby Fall et al. (1983), M? and specific angular momentumj? J? /M? are related as j? M?α (α 2/3) with a normalisation that depends on the galaxy morphological type, increasing from early- to late-type systems (Romanowsky & Fall 2012;Fall & Romanowsky 2013).This “Fall” relation represents a key benchmark for modelsof galaxy evolution in a ΛCDM framework. While tidal torquetheory (Peebles 1969; Efstathiou & Jones 1979) defines preciserelations between the virial mass of halos and their specificangular momentum, which is also that of the baryonic matter,the mode by which the latter is redistributed within the stellardisc with time depends on the uncertain details of the galaxyevolution process (e.g. Mo et al. 1998; Dutton & van den Bosch2012; Kravtsov 2013; Posti et al. 2018a). Early numerical studiessuffered from dramatic angular momentum losses and stronglyunderpredicted the j? of galaxies at all M? (e.g. Katz & Gunn1991; Navarro & Steinmetz 2000), but the situation has steadilyimproved in the years thanks to a better numerical resolution and to more effective stellar feedback implementations(Governato et al. 2010; Genel et al. 2015; Lagos et al. 2017). Itstill holds, though, that realistic models of galaxy evolutions - analytical or numerical – must aim at reproducing the Fall relation inthe local universe as well as its evolution with cosmic time.The j? M? relation in the local universe was recently restudied by Posti et al. (2018b) using a sample of 92 isolated,regularly rotating disc galaxies from the Spitzer Photometry andAccurate Rotation Curves (SPARC; Lelli et al. 2016) database,revealing a remarkably tight relation between the two quantitiesover four orders of magnitude in M? . The advent of modern IFU,like the KMOS and MUSE instruments on ESO/VLT, unveiledgas and stellar kinematics for galaxies at higher redshifts andopened the possibility to determine the evolution of the j? M?relation with time. Harrison et al. (2017) studied a sample of586 Hα-detected star-forming galaxies at 0.6 z 1 from theKMOS Redshift One Spectroscopic Survey (KROSS, Stott et al.2016), finding a power-law j? M? relation with the same slopeas in the local universe, but with an offset of 0.2 0.3 dex towardslower j? which they explained as due to the smaller disc sizes.Similar results were obtained by Swinbank et al. (2017) usingKMOS and MUSE data for a sample of 405 galaxies at z 0.84,and by Burkert et al. (2016) for 360 galaxies at 0.8 z 2.6.In contrast, Contini et al. (2016) studied a smaller sample of 28galaxies at 0.2 z 1.4 with MUSE, finding no evolution in theFall relation in this redshift range for galaxies with large enoughrotational support.The reliability of j? measurements depends on how accuratelyrotation curves and surface-brightness profiles can be determined.Di Teodoro et al. (2016, hereafter TFM16) selected 18 isolated,main-sequence disc galaxies at z 1 with intermediate inclination and high-quality Hα data from the KROSS and the KMOS3D(Wisnioski et al. 2015) surveys, and derived their Hα rotationcurve and velocity dispersion profiles using the tilted-ring code3DBarolo (Di Teodoro & Fraternali 2015). This approach, basedon the modelling of the entire emission-line data cube, virtuallybypasses any beam-smearing problem associated to low spatialresolution of the data and thus allows us to break the degeneracyArticle published by EDP SciencesL6, page 1 of 11
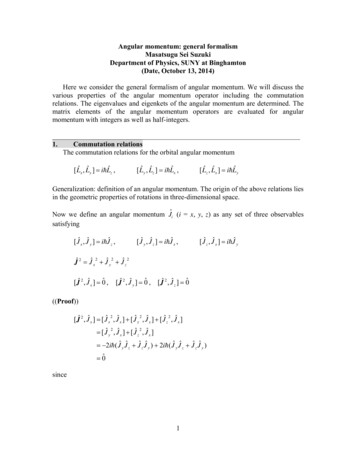
A&A 621, L6 (2019)between rotation velocity and velocity dispersion. TFM16 concluded that the Hα kinematical properties of these z 1 systems are analogous to those measured at z 0, with no evidence for additional dispersion support as previously claimed(e.g. Epinat et al. 2012; Kassin et al. 2012).In this Letter, we determine the j? M? relation for thegalaxy sample of TFM16 by combining their accurate Hα kinematical measurements with surface-brightness profiles that weextract from HST images.2. MethodIn an axisymmetric disc, the specific stellar angular momentumenclosed within a given radius R is defined asRRΣ? (R0 ) v? (R0 ) R0 2 dR0j? ( R) 0 R R,(1)0 ) R0 dR0Σ(R?0where Σ? (R0 ) and v? (R0 ) are the surface density and theazimuthal velocity radial profiles of the stellar component.In what follows, we focus on the task of computing j? viaEq. (1) for the galaxy sample of TFM16 and do not attempt ourown determination of M? . Instead, we use the stellar masseslisted in Table 1 of TFM16, which come either from the Cosmic Assembly Near-infrared Deep Extragalactic Legacy Survey (CANDELS; Grogin et al. 2011; Koekemoer et al. 2011)as average values based on different techniques (Santini et al.2015), or (for 5 galaxies) from the COSMOS (Scoville et al.2007) and 3D-HST (Brammer et al. 2012) catalogues, which arederived by fitting stellar population synthesis templates to broadband photometry with the Fitting and Assessment of SyntheticTemplates (FAST, Kriek et al. 2009) code.The main properties of the galaxies studied in this work arereported in Table A.1. We note that we follow the same galaxyname and IDs as in Table 1 of TFM16. For consistency withTFM16, throughout this work we adopt a flat ΛCDM cosmologywith Ωm,0 0.27, ΩΛ,0 0.73 and H0 70 km s 1 Mpc 1 .2.1. Surface-brightness profilesWe use optical/infrared surface-brightness profiles I(R) as aproxy for Σ? (R) in Eq. (1) under the assumption that light tracesstellar mass. We determine I(R) using publicly available HSTimages from CANDELS or, for systems 3, 8, and 17, fromCOSMOS. No images were found for system 7 (zcos z1 192),which we left out of our analysis. We focus on two different filters, f160w and f814w, which at the redshift of 1 roughly correspond to rest-frames I- and B-bands, respectively. Accordingto Skelton et al. (2014), images in f160w (f814w) filter have anangular resolution of 0.1900 ( 0.1000 ), corresponding to about1.5 kpc (0.8 kpc) in physical units, approximately three (six)times better than the KMOS IFU data. In spite of the fact thatthe B-band is not the best tracer for stellar mass, we show belowthat our results are nearly independent of the band used, whichstrengthens our conclusions.The procedure used to extract I(R) from the images consistsof several steps. We first compute the central value Ibkg and widthσbkg of the background noise distribution. This is a crucial step, asan incorrect estimate for Ibkg affects the outer regions of the lightprofile, which may contain a significant fraction of j? . We focuson the pixel intensity distribution in a region of the image outsidethe main galaxy and fit a Gaussian function to a window encompassing the mode of such a distribution. The mean and the standardL6, page 2 of 11deviation of the best-fit Gaussian give Ibkg and σbkg respectively.Ibkg is then subtracted from the image before any further analysis.We then define an “optical” centre by using an iterativeapproach on the f160w image: we compute an initial intensityweighted centroid using all pixels within a circle centred atthe galaxy coordinates given by TFM16 and with a radius of 500 , and progressively shrink the circle and re-centre it to thenewly computed centroid until convergence is reached. The finalcentre coordinates are used for both bands and are reported inTable A.1. We notice that optical and kinematic centres are ingood agreement with each other (see Fig. 2 in TFM16) and thatour results are fairly robust against small (.0.300 ) off-centring,given that most j? is locked in the galaxy outskirts.To extract I(R), we consider a series of concentric annuli,centred on the optical centre, spaced out by one resolutionelement ( 3 pixels) and with constant axis-ratio and orientation given by the inclination and position angle determined byTFM16. As in Schombert (2007), a sigma-rejection algorithm isused to find and mask pixels contaminated by foreground starsor external galaxies. The surface brightness of each ring is computed as the mean intensity of the unmasked pixels, while theuncertainty associatedto such a measurement, δI, is given by max(σbkg , σ)/ N, σ being the rms intensity of the unmaskedpixels and N the number of resolution elements in that ring. Weproceed ring by ring until the signal-to-noise ratio I/δI dropsbelow a value of 2.5. Finally, we fit the profile with an exponential function in order to derive the scale length Rd of the disc. Inorder to avoid contamination from bars/bulges, we exclude fromthe fit a region with R Rsph . We obtain satisfying fits by choosing Rsph 3.5 kpc for all galaxies but we stress that, contrary toother works (e.g. Swinbank et al. 2017; Harrison et al. 2017), inthis analysis Rd does not enter directly into the computation ofj? . We find 2 . Rd . 6 kpc, as reported in Table A.1.The first three panels in Fig. 1 demonstrate our procedure forsystem zmus z1 119. We note that the optical profiles extendmuch further than the Hα emission, as shown by the outermostsolid and dashed ellipses in the leftmost panels of Fig. 1. Wealso note the similarity between the normalised profiles in thetwo bands considered (third panel). The cumulative light profilesflatten out in both bands, which corroborates the validity of ourprocedure. This is the case for all the galaxies in our sample, aswe show in Fig. A.1.2.2. Stellar rotation curvesThe computation of Eq. (1) requires measurements for the stellar rotation curves, v? (R), that cover the full extent of the stellardiscs. At z 1, such measurements are very challenging (for arecent attempt, see Bezanson et al. 2018). Fortunately, from thestudy of TFM16 we have access to Hα rotation curves, vHα (R),although limited to the innermost (star-forming) regions. Therefore, we must convert vHα to v? via an asymmetric drift correction and then make assumptions for the shape of the rotationcurve beyond the outermost measured velocity point.The computation of v? is made in three steps: we first convertvHα to a circular velocity vcirc up to the outermost Hα radius, wesubsequently extrapolate vcirc up to the outermost optical radius(see below), and finally we convert the whole vcirc profile to a v?profile. More quantitatively, we havev2? v2circ v2AD,? v2Hα v2AD,Hα v2AD,? ,(2)with vAD,Hα and vAD,? being the asymmetric drift correctionsfor the gas and the stellar components. Following Meurer et al.(1996), and assuming that galaxies have constant scale heights,
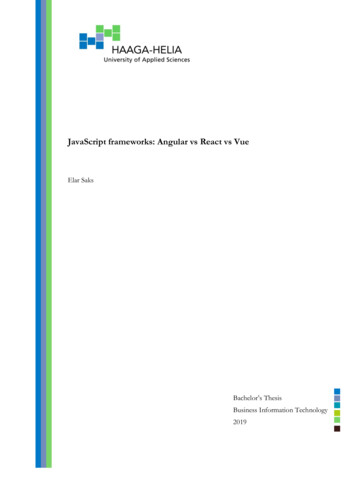
A. Marasco et al.: The angular momentum of disc galaxies at z 1Fig. 1. Photometry and kinematics of galaxy zmus z1 119. First panel: HST image in f160w band (rest-frame I band). The concentric ellipsesshow the annuli where the surface brightness is computed. The green dashed ellipse shows the radius of the outermost Hα rotation velocity point.The blank region in the f814w image has been masked by our sigma-rejection algorithm (see text). Second panel: as in the first panel, but for thef814w band (rest-frame B band). Third panel: surface-brightness profiles in bands f160w (red circles) and f814w (blue triangles), normalised tothe total light within the outermost ring. The thin dashed lines show exponential fits for R 3.5 kpc, the solid thick lines show the cumulative lightprofile. Fourth panel: rotation curves. Points with error bars show vHα as determined by TFM16. The black and the red solid (dashed) lines showour fiducial profiles for vcirc and v? respectively, assuming a flat (Keplerian) extrapolation for the circular velocity.these can be generically written as!2 ln Σ(R)σ (R)2 zσ(R)zv2AD (R) R,β R2.3. Fiducial values and error budget(3)where Σ(R) is the surface density profile of the component considered, and β is defined as σz /σR , σz and σR being the verticaland radial components of the velocity dispersion1 .To determine vAD,Hα we assume isotropy (β 1) and a constant σz set to the values listed by TFM16 in their Table 1. Forfurther simplification, we assume ΣHα to follow an exponentialprofile with scale-length equal to that of the stellar disc determined in the f814w band (see Sect. 2.1). For vAD,? we use thesurface-brightness profiles determined in the f160w and f814wbands as a proxy for Σ, as well as an exponentially decreasingσz profile with e-folding length given by 2Rd and central dispersion given by σz (0) (0.248 0.038) v2.2Rd , with v2.2Rd beingthe circular velocity measured at R 2.2Rd (Martinsson et al.2013). In order to avoid unrealistically small values for σz atlarge radii, we further impose a stellar-velocity dispersion floor2of 15 km s 1 . Finally, we assume 0.5 β 1.0 in order toaccount for the uncertainty in the velocity anisotropy in the errorbudget (see Sect. 2.3).For the extrapolation of vcirc we consider two scenarios:either the rotation velocity remains constant at the value set bythe last measured point, or it follows a Keplerian fall-off. Theformer represents a typical case for a late-type galaxy at z 0,while the latter is extreme and sets a conservative lower limiton j? .As an example, in the rightmost panel of Fig. 1 we show the“fiducial” vcirc and v? profiles derived for system zmus z1 119.As we discuss in Sect. 2.3, several realisations contribute to produce these fiducial profiles, each may differ markedly from thoseshown here. Clearly, the type of extrapolation adopted dominates the uncertainty on the rotation curve (difference betweensolid and dashed lines), while the overall impact of the asymmetric drift corrections is small (difference between black andred lines). For this reason, the two types of extrapolation will betreated separately in our study.As is common in the literature, we have implicitly assumed that σR σφ and that the off-diagonal elements of the velocity dispersion tensorare negligible.2The exact value of this floor has little impact on our results.1Given the many sources of uncertainty, we adopt a Monte-Carloapproach to estimate “fiducial” values and associated errors onj? . Our approach consists of producing 5 104 random realisations of the following quantities for any given galaxy: theHα rotation curve vHα (R), the Hα velocity dispersion σHα , thestellar surface-brightness profile I(R), the central vertical dispersion for the stars σz (0), and the stellar dispersion anisotropy β.For the randomisation of vHα (R) and σHα we adopt Gaussianuncertainties based on the error bars determined by TFM16.For I(R) we use Gaussian uncertainties, δI, computed as discussed in Sect. 2.1. For σz (0) we use the formal (Gaussian)error determined by Martinsson et al. (2013) on their relationσz (0) (0.248 0.038) v2.2Rd , where both Rd and v2.2Rd are nowrandom quantities depending on the realisation of the brightnessand velocity profiles. Finally, β is randomly extracted from a uniform distribution between 0.5 and 1.For each galaxy we compute Eqs. (2) and (1) in all randomrealisations, and use the median and half the difference betweenthe 84th and the 16th percentiles as our fiducial measurementsand 1σ uncertainties associated to them, respectively. The computation is done four times in total: once for each band separatelyand, for a given band, once for each extrapolation of the rotationcurve (flat or Keplerian).3. ResultsFigure 2 shows the cumulative j? computed via Eq. (1) for allsystems in our sample assuming a flat extrapolation for vcirc . Allprofiles shown are normalised by 2Rd vf,? (where vf,? is maximum v? in the extrapolated region of the curve), correspondingto the integrated j? for an exponential disc with scale-length Rdand constant rotational speed vf,? . The left (right) panel showsthe results for the f160w (f814w) band. As expected, profiles inthe f160w band show less scatter and a more uniform behaviourwith respect to those in the f814w band, with a cleaner convergence towards unity. Following Posti et al. (2018b), we verifiedthat all 17 systems satisfy in both bands the criteria for a “converging” j? profile, j? / j? 0.1 and log j? / logR 0.5,where is measured using the last two annuli of the profile.Trivially, convergence is ensured also for the Keplerian extrapolation. We note that none of the systems would pass the convergence test if we limited our study to their innermost regionsL6, page 3 of 11
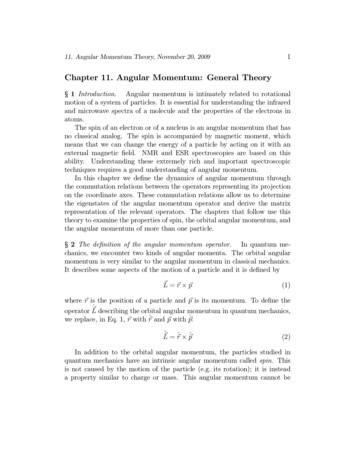
A&A 621, L6 (2019)Fig. 2. Cumulative j? profiles for our 17 galaxies in the f160w (leftpanel) and f814w (right panel) bands. Coloured solid lines show theinnermost regions where rotation velocities from Hα data are available,while solid black lines show the extrapolation for a flat rotation curve.All profiles are either converging or have fully converged.traced by the Hα emission, represented by the coloured portionof the curves shown in Fig. 2.The Fall relation for our z 1 galaxies is presented in Fig. 3(points with error bars) and compared to that determined in thelocal universe by Posti et al. (2018b3 ; grey-shaded region) for theSPARC sample (log( j? ) 0.55(log(M? / M ) 11) 3.34, witha perpendicular scatter of 0.17 dex. Squared symbols (upwardstriangles) represent the median j? computed for a flat (Keplerian)extrapolation for the rotation curves. Upwards triangles have beenfurther shifted downwards by 1σ in order to represent strict lowerlimits. Remarkably, all z 1 measured points sit comfortably onthe z 0 relation of Posti et al. (2018b) with little dependenceon the band adopted. We reiterate that corrections for asymmetricdrift (Sect. 2.2) have a very small impact on our measurements,and stress that even our lower limits are typically enclosed withinthe scatter of the z 0 relation.By assuming that the slope of the Fall relation does not vary inthe redshift range considered, from our fiducial j? measurementsin f160w (f814w) band we infer a growth in the zero-point of therelation by 0.05 (0.03) dex from z 0 to z 1. This positive offset is mainly driven by systems 4, 17 and 18. We test whether thismeasurement is compatible with zero offset by randomly extracting 105 sets of 17 points in the ( j? , M? ) plane using the relationof Posti et al. (2018b) as a probability distribution, taking intoaccount both the intrinsic scatter and the typical error-bars of ourz 1 data. We then compute the zero-point for each set, obtaining a distribution with a standard deviation of 0.05 dex, similarto the offset in the data. This indicates that our measurements arecompatible with no evolution in the zero-point of the Fall relationfor disc galaxies in the redshift range considered.4. DiscussionOur findings indicate that disc galaxies move along a welldefined j? M? sequence while evolving from z 1 to z 0.As stellar mass grows, j? increases by an amount defined by theFall relation.We stress that, while stellar masses for our z 1 sample come from broadband SED fitting, the SPARC sample (onwhich the z 0 Fall relation is based) adopts a constantM? /L[3.6] of 0.5 M /L (Lelli et al. 2016). It is unclear whether3As shown by Fall & Romanowsky (2018), this relation is in excellentagreement with those determined previously by Fall & Romanowsky(2013) and Obreschkow & Glazebrook (2014) for disc-dominatedgalaxies.L6, page 4 of 11or not these two methods are compatible: while SED fitting techniques applied to nearby galaxies give masses corresponding tolower M? /L[3.6] ( 0.1 0.3 M /L ; see Ponomareva et al. 2018;Hunt et al. 2019), at a higher z this may no longer be the case.An in-depth analysis of these methods is beyond the purpose ofthis work, but a hint may come from the fact that our z 1 galaxies follow the same stellar Tully–Fisher (TF) relation as those inthe local universe (TFM16): were our stellar masses significantlyunderestimated, the zero-point of the TF would increase withredshift, against all theoretical expectations (e.g Somerville et al.2008; Übler et al. 2017; Ferrero et al. 2017). Our measurementsremain compatible with no evolution in the Fall relation unlessstellar masses at z 1 (z 0) are systematically under(over)estimated by &0.15 0.20 dex ( 50%).Our results appear to be in tension with those ofHarrison et al. (2017), who studied the Hα kinematics of 586star-forming galaxies at z 0.6 1 from the KROSS survey andconcluded that, at a given M? , these galaxies have a deficiencyof 0.2 0.3 dex in j? with respect to their local counterpart.To understand this discrepancy we cross-matched our samplewith that of Harrison et al. (2017), finding 12 systems in common. These galaxies do not occupy a preferred position in the(M? , j? ) plane, thus are well representative for the overall population of rotationally dominated systems at z 1. This excludesthat our sample is biased towards high- j? systems and indicatesthat the difference between the two works lies in the method. Wederive rotation velocity and velocity dispersion profiles via a 3Dmodelling of the Hα datacubes, while Harrison et al. (2017) usemajor-axis vHα and σHα profiles, an approach that often leadsto underestimation of the former and overestimation of the latter(e.g. Di Teodoro & Fraternali 2015). Also, they adopt an approximate estimator for j? which relies on accurate measurements ofdisc sizes (see their Eq. (5)). By comparing the properties of the12 galaxies in common we found that, while stellar masses aresimilar, our velocities and disc sizes are larger by about 0.08 and0.14 dex, respectively, leading to a 0.2-dex larger j? , similar tothe quoted deficiency with respect to the z 0 spirals. Analogous arguments apply to the results of Swinbank et al. (2017).One may wonder whether our results must be expected on thebasis of simple, first-principles models. A straightforward, empirical approach is to consider j? Rd vf and relate the evolution ofj? with that observed in the mass-size (MS) relation M? Rd andin the stellar TF relation M? vf . Observationally, the evolution ofboth these relations is highly debated. Our results support a scenario where both relations do not significantly change betweenz 0 and z 1, in agreement with the findings of Conselice et al.(2005), Miller et al. (2011), and TFM16 for the TF relation andwith those of Barden et al. (2005) for the MS relation of discgalaxies. More recent measurements (van der Wel et al. 2014;Huang et al. 2017; Somerville et al. 2018) have reported onlya modest evolution ( 0.1 dex) in the MS relation of late-typegalaxies for the (M? , z) range of interest.A more theoretical approach is to consider galaxyevolution models in a cosmological framework. FollowingObreschkow et al. (2015), the j? of a galaxy with stellar massM? that reside in a virialized spherical halo at a given redshift zcan be written asj? λ fj fm 2/3 H(z) 1/3 c (z) 1/6 M?2/3 ,(4)where λ is the halo spin parameter ( constant in a ΛCDM universe), fm M? /Mh is the stellar-to-halo mass ratio, fj j? / jhis the stellar-to-halo specific angular momentum ratio, H(z) isthe Hubble parameter and c (z) is the halo over-density relative tothe mean density of the universe. Both fm and fj are, in principle,
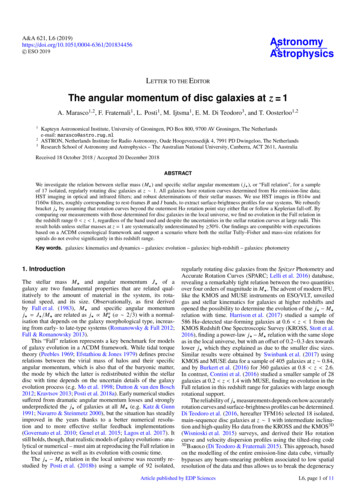
log10(j [kpc km s 1])A. Marasco et al.: The angular momentum of disc galaxies at z 13.4 f160wf814w3.23.02.82.6z 0 (Posti 18a)z 0 (Posti 18a)2.4z 1 (this work)z 1 (this work)9.09.5 10.0 10.5 11.09.5 10.0 10.5 11.0log10(M [M ])log10(M [M ])11171331146181215 1413 3109817410896 165516211181221514Fig. 3. Fall relation for our sample of disc galaxies at z 1. Left (right) panel: results derived using the f160w (f814w) HST band. The squaredsymbols show the j? determined for a flat rotation curve extrapolation, while the upwards triangles represent lower limits derived from theassumption of a Keplerian fall-off. Numbers correspond to galaxy IDs from Table A.1. The black-dashed line and the grey-shaded region showthe Fall relation and its intrinsic scatter, respectively, as determined by Posti et al. (2018b) for disc galaxies in the local universe from the SPARCdata of Lelli et al. (2016).functions of M? and z. Equation (4) leads immediately to5. Conclusions"#"#"#"#fj (M? , z) fm (M? , z) 2/3 H(z) 1/3 c (z) 1/6j? (M? , z) ,j? (M? , 0)fj (M? , 0) fm (M? , 0)H(0) c (0)(5)In this Letter we have studied the j? M? “Fall” relation for a sample of 17 regularly rotating disc galaxies at z 1. For all galaxiesin our sample there exist resolved Hα kinematics from KMOSIFU data, Hα rotation curves from Di Teodoro et al. (2016), HSTimages in optical and infrared bands from CANDELS, and robuststellar masses determinations. We have determined their surfacebrightness profiles from HST images in f160w and f814w filters(rest-frame I and B bands, respectively), corrected the Hα rotation curves for asymmetric drift, and computed j? by assumingthat either rotation velocities stay constant beyond the outermostHα data point or follow a Keplerian fall-off. The latter scenario provides a lower limit on j? . All systems show convergingj? profiles, which makes them suitable for our study.We have found that the Fall relation at this redshift is compatible with that determined by Posti et al. (2018b) for spirals in thelocal universe, unless z 1 stellar masses derived via SED fittinghave been underestimated by more than 50%. This implies thatthe Fall relation for disc galaxies has not evolved significantly inthe last 8 Gyr. Our findings are in line with expectations basedon simple galaxy evolution models and with cosmological simulation in a ΛCDM framework, and support a scenario where boththe stellar Tully–Fisher relations and the mass–size relations ofdisc galaxies do not evolve significantly between redshifts of 1and 0.where we have explicitly written the dependence on (M? , z) ofthe various quantities.The fm (M? , z) in Eqs. (4) and (5) is fully determined byassuming a stellar-to-halo mass relation (SHMR). Here we usethe SHMR of Moster et al. (2013), which is well defined at allredshifts and is thought to be well representative for the localuniverse (e.g. Katz et al. 2017). If we ignore for a moment anyevolution in fj , the right-hand term of Eq. (5) computed at z 0.9(the mean redshift of our sample) gives values ranging from 0.08 dex at log(M? / M ) 9.5 to 0.08 dex at log(M? / M ) 10.7. Adopting the SHMR of Behroozi et al. (2013) leads to aslightly larger range ( 0.1 dex). Alternatively, we can assumefj fms as in a “biased collapse” formation model wherestars form inside-out according to the cooling time of the available gas reservoir, meaning that the angular momentum retention efficiency fj correlates with the star-formation efficiency fm(see van den Bosch 1998; Fall et al. 2002; Romanowsky & Fall2012; Posti et al. 2018a) at all redshifts. If we adopt s 0.68 asdetermined by Posti et al. (2018a), then in Eq. (4) fj fm 2/3 ' 1and j? (0.9)/ j? (0) ' 0.79 ( 0.10 dex), constant over the interested M? range. These predicted values, although uncertain, arewithin the scatter of the Fall relation, indicating that the lack ofa strong variation in the relation between z 0 and 1 is consistent with simple galaxy-evolution models.Finally, conclusions similar to ours have been drawn byLagos et al. (2017) from the analysis of the EAGLE cosmological simulations in a full ΛCDM framework (Schaye et al. 2015).They found that the mean j? computed within the half-M?radius of star-forming galaxies with 10 log(M? / M ) 10.5decreases only marginally ( 0.05 dex, see their Fig. 7) in the redshift range considered, while differences become more markedat higher z. We plan to test this prediction in the near future byapplying our technique to galaxies at z 2.Acknowledgements. The authors thank the referee for an insightful report, andare grateful to M. Fall for his comments and insights. A.M. thanks F. Lelli foruseful discussions. L.P. acknowledges financial support from a VICI grant fromthe Netherlands Organisation for S
The angular momentum of disc galaxies at z 1 A. Marasco 1,2 , F. Fraternali 1 , L. Posti 1 , M. Ijtsma 1 , E. M. Di Teodoro 3 , and T. Oosterloo 1,2 1 Kapteyn Astronomical Institute, University of Groningen, PO Box 800, 9700 AV Groningen, The Netherlands