Transcription
Published bythe InternationalSociety ofProtistologistsThe Journal ofEukaryotic MicrobiologyJournal of Eukaryotic Microbiology ISSN 1066-5234ORIGINAL ARTICLEFunctional Ecology of the Ciliate Glaucomides bromelicola,and Comparison with the Sympatric Species BromeliothrixmetopoidesThomas Weissea, Ulrike Scheffela, Peter Stadlera & Wilhelm Foissnerba Research Institute for Limnology, University of Innsbruck, Herzog Odilostrasse 101, Mondsee, 5310, Austriab Department of Organismic Biology, University of Salzburg, Hellbrunnerstrasse 34, Salzburg, 5020, AustriaKeywordsCompetition; feeding threshold; growth rate;life strategy; macrostome formation;neotropics; pH response; Polytomella sp.CorrespondenceT. Weisse, Research Institute for Limnology,University of Innsbruck, Herzog Odilostrasse101, 5310 Mondsee, AustriaTelephone number: 43 (0) 512-507-50200;FAX number: 43 (0) 512-507-50299;e-mail: thomas.weisse@uibk.ac.atReceived: 11 February 2013; revised 12April 2013; accepted May 21, 2013.doi:10.1111/jeu.12063ABSTRACTWe investigated the ecology and life strategy of Glaucomides bromelicola (family Bromeliophryidae), a very common ciliate in the reservoirs (tanks) of bromeliads, assessing its response to food quality and quantity and pH. Further, weconducted competition experiments with the frequently coexisting species Bromeliothrix metopoides (family Colpodidae). In contrast to B. metopoides andmany other colpodean ciliates, G. bromelicola does not form resting cysts,which jeopardizes this ciliate when its small aquatic habitats dry out. Bothspecies form bactivorous microstomes and flagellate-feeding macrostomes.However, only G. bromelicola has a low feeding threshold and is able to adaptto different protist food. The higher affinity to the local bacterial and flagellatefood renders it the superior competitor relative to B. metopoides. Continuousencystment and excystment of the latter may enable stable coexistence of bothspecies in their natural habitat. Both are tolerant to a wide range of pH (4–9).These ciliates appear to be limited to tank bromeliads because they either lackresting cysts and vectors for long distance dispersal (G. bromelicola) and/orhave highly specific food requirements (primarily B. metopoides).GLAUCOMIDES BROMELICOLA Foissner, 2013 has beenrecently described in the context of a comprehensive project on the diversity and ecology of ciliates from tank bromeliads (Foissner 2013). Bromeliads are species-richepiphytic and terrestrial plants that are wide-spread inCentral and South America. Many are able to store waterin a reservoir formed by the tightly overlapping bases oftheir rosette leaves. Such phytotelmata (Varga 1928), alsoknown as tanks or cisterns, may contain up to 30 litres ofwater; they represent a highly specialized aquatic habitat(Armbruster et al. 2002; Foissner et al. 2003; Kitching2000). In contrast to larger aquatic habitats, tank bromeliads are disconnected from each other. Thus, phytotelmata represent natural model systems for studying majorfunctional characteristics of food webs and for testingcommunity theories (Armbruster et al. 2002; Kitching2001).As yet, ca. 40 new ciliate taxa have been discovered intank bromeliads and several have already been described(Dunthorn et al. 2012; Foissner 2003a,b, 2010, 2013;Foissner and Stoeck 2013; Foissner and Wolf 2009;Foissner et al. 2003, 2011; Omar and Foissner 2011,2012). Glaucomides bromelicola belongs to the578Bromeliophryidae and is distantly related to Glaucoma(Foissner 2013; Foissner and Stoeck 2013). While thegenus Glaucoma radiated in more common freshwaterhabitats, G. bromelicola is widespread in tank bromeliads,commonly occurring in several bromeliad species fromsouthern Chile to Mexico (Foissner 2013). The originaldescription focused on morphological and molecular characteristics while the ecology received little attention.Details of the ecology of ciliates from tank bromeliads arehitherto known only from one species, Bromeliothrix metopoides (Weisse et al. 2013b). Accordingly, the goalof this study was to investigate the functional ecology ofG. bromelicola in comparison to that of B. metopoides. Incontrast to B. metopoides and many other colpodean ciliates, G. bromelicola does not form cysts (Foissner 2013),which renders this species vulnerable to extinction following desiccation in the tanks. Water volume (typically ca.0.01–3 liters), light, pH (usually ranging from 4.0 to 7.0),nutrients, and allochtonous organic input from leaf litterare the most important abiotic factors characterizingphytotelmata of tank bromeliads (Brouard et al. 2012; Janetzky 1997; Laessle 1961; Lopez et al. 2009; Marino et al.2011). 2013 The Author(s) Journal of Eukaryotic Microbiology 2013 International Society of ProtistologistsJournal of Eukaryotic Microbiology 2013, 60, 578–587This is an open access article under the terms of the Creative Commons Attribution-NonCommercial-NoDerivs License, which permits use anddistribution in any medium, provided the original work is properly cited, the use is non-commercial and no modifications or adaptations are made.
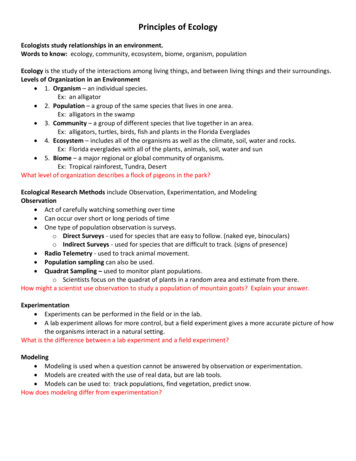
Weisse et al.We hypothesized that G. bromelicola should haveevolved adaptations different from those of B. metopoidesto compensate for the lack of cyst formation and promoteits survival in astatic aquatic environments. We focusedon food (quantity and quality), competition, and pH asmajor environmental variables that are amenable to experimental manipulation in the laboratory. As G. bromelicolaoften co-occurs with B. metopoides, the ciliate speciesthat is second in common in tank bromeliads, the traitsthat enable coexistence are of special interest. To thisend, we performed competition experiments in the laboratory. We did not consider temperature in this studybecause typical temperature variation in the tanks of bromeliads is in the range of (only) 10 C (summarized byWeisse et al. 2013b), i.e. presumably of minor importancerelative to the other physico-chemical variables.MATERIALS AND METHODSOrigin and maintenance of stock culturesGlaucomides bromelicola Foissner, 2013 represents a newtetrahymenid genus and species that is frequent in tankbromeliads of Central and South America (Foissner 2013).Similar to B. metopoides Foissner, 2010, G. bromelicolaforms macrostomes when bacterial food is depleted. Thecommon in vivo cell size of cultivated specimen is ca.57 9 30 lm (microstomes), respectively, 80 9 50 lm(macrostomes).The organisms used in this study were collected fromtanks of small tree bromeliads either in a subtropical forest of Brazil (B. metopoides, Polytomella sp., heterotrophic bacteria) or in the botanical garden of Puerto Plata,Dominican Republic (G. bromelicola). Details of the originof our study organisms have been reported by Foissner(2010, 2013). Cultures were established in Eau de Volvic(French table water) enriched with some sterilized,crushed wheat grains to promote growth of indigenousbacteria and bacterivorous flagellates. Monospecific protistcultures were obtained by repeated dilution with Volvicand pipetting of individual target cells, respectively, byremoving unwanted predators or competitors. Ciliate stockcultures were maintained in “filter caps” culture flasks(Biomedica) with 50 ml of Eau de Volvic enriched withone to two wheat grains. The stock cultures were kept inan incubator at 22.5 C under a 14:10 h light–dark cycle;pH was ca. 7.5. New cultures were inoculated once perweek by transferring 25 ml of the aged culture to a newflask containing 25 ml Eau de Volvic and one new wheatgrain.We kept G. bromelicola in nonaxenic stock cultures withand without the as-yet-undescribed flagellate Polytomellasp.; this flagellate, which was isolated together with B.metopoides, is variable in cell size (10–40 lm), has fourflagella at the basis of a distinct papilla, four contractilevacuoles, lacks an eyespot, and has the nucleus in theanterior body half (Foissner 2010). The genus Polytomellacomprises several colorless nutritionally versatile speciesthat thrive on acetate and other organic acids, peptone,Life Strategies of Two Ciliates from Bromeliadsand yeast extract (de la Cruz and Gittleson 1981; Pringsheim 1955). We added two wheat grains to 50 ml of Eaude Volvic to provide an organic-rich medium for ourPolytomella sp. cultures. Ciliate cell numbers in stock cultures usually ranged from 0.5 to 2.0 9 104 cells/ml.Growth experiments with different food organismsWe measured specific growth rates (l) of G. bromelicolain response to different food quality (heterotrophic bacteriaand the flagellates Polytomella sp. and Cryptomonas sp.)and quantity. Polytomella sp. coexists with the ciliate intank bromeliads, Cryptomonas sp. is a cryptophyte common in many freshwater bodies and the preferred food ofmany planktonic ciliates (Skogstad et al. 1987; Weisse ller 1998). If not specified, cell numbers of G. broand Mumelicola include microstomes and macrostomes in the following. In asexually reproducing ciliates, l is a directproxy of their fitness (Weisse 2006). The ciliate was inoculated together with the respective food organism(s) into50-ml culture flasks. Treatments with food organisms butwithout ciliates served as controls. Target food levelslower than satiating ( 2 mg C/L; experiments reported inFig. 1–3) were obtained by diluting strongly growingFigure 1 Numerical response of the ciliate Glaucomides bromelicola.(A) With the auxotrophic flagellate Polytomella sp. as food. (B) Withthe phototrophic flagellate Cryptomonas sp. as food. The solid linesrepresent the fit to Eq. 4 (see text). 2013 The Author(s) Journal of Eukaryotic Microbiology 2013 International Society of ProtistologistsJournal of Eukaryotic Microbiology 2013, 60, 578–587579
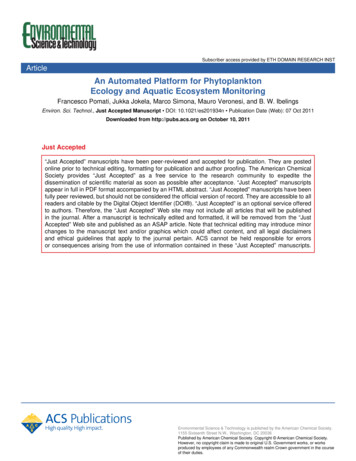
Life Strategies of Two Ciliates from BromeliadsWeisse et al.Figure 3 Population dynamics of the ciliates Bromeliothrix metopoides and Glaucomides bromelicola fed bacteria and the flagellate Polytomella sp. (A) B. metopoides in single growth experiments. (B) G.bromelicola in single growth experiments. (C) Both ciliates in pairwisegrowth ( competition) experiments. Symbols represent means oftriplicates; error bars denote 1 SD.Figure 2 Population dynamics of the ciliate Glaucomides bromelicolafed bacteria and the flagellate Cryptomonas sp. at four different foodlevels (A–D). Symbols represent means of triplicates; error barsdenote 1 SD.cultures with Eau de Volvic. Flagellate prey concentrationranged from a few hundred cells/ml to 80,000 cells/ml(equivalent to 0.05– 2 mg C/L), depending on theexperimental conditions. Bacterial levels ranged from 106to 108 cells/ml. Except for the experiments with Cryptomonas sp., the bacterial flora used in this study wasenriched from the original habitat. The bacteria present inthe Cryptomonas cultures remained unidentified but were,most likely, qualitatively different from those used in theother experiments. The initial experimental ciliate abundance was 20–110 cells/ml. All growth experiments wereperformed in the dark to prevent photoautotrophic food(the flagellate Cryptomonas sp.) from growing. Similarly,we removed remnants from wheat grains from the experimental containers to limit bacterial growth. The experiments lasted from several days to several weeks.580Samples (5 ml) were taken from the experimental containers at 24 h intervals and fixed with acid Lugol’s iodine(final concentration 2% v/v). Ciliate cell numbers weredetermined microscopically either in counting chambers of3 ml volume or in Sedgewick Rafter chambers of 1 ml volume. Flagellate cell numbers were also counted microscopically, either together with the ciliates or separately ina 1-ml Sedgewick chamber. At higher abundance( 104 cells/ml), flagellates were also counted and sizedelectronically by means of an automatic particlecounter (CASY 1-model TTC; Sch arfe System, Reutlingen,Germany; Weisse and Kirchhoff 1997). Bacterial levelswere measured in Formalin-fixed (2% v/v) samples (2 ml)taken together with the ciliate samples. Bacterial cell numbers were assessed by flow cytometry after staining withthe green fluorescent nucleic acid stain SYTO-13 (MolecularProbes, InvitrogenTM, Carlsbad, CA, USA), using aFACSCalibur flow cytometer (Becton Dickinson BD Biosciences, San Jose, CA) equipped with an argon ion laseremitting light at 488 nm.Cell size of ciliates and flagellates was measured withLugol’s fixed material using an inverted microscope and a 2013 The Author(s) Journal of Eukaryotic Microbiology 2013 International Society of ProtistologistsJournal of Eukaryotic Microbiology 2013, 60, 578–587
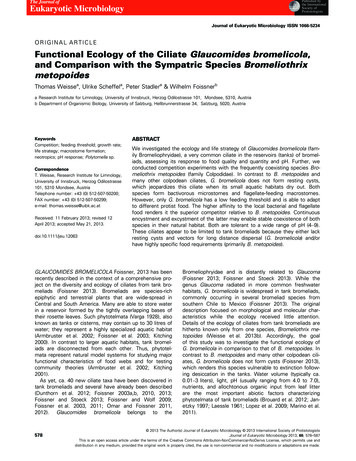
Weisse et al.Life Strategies of Two Ciliates from Bromeliadssemi-automatic image analysis system (LUCIA version4.51, Laboratory Imaging, Prague, Czech Republic). Flagellates were also measured in unfixed material. The automatic particle counter yielded an independent estimate offlagellate cell size, which was used mainly to determinethe cell volume of living cells. Both methods yielded similar results.The cell volume of the prey flagellates used in thisstudy (Polytomella sp. and Cryptomonas sp.) was converted to carbon units assuming the allometric equationprovided by Menden-Deuer and Lessard (2000), i.e. pgC/cell 0.216 9 cell volume0.939. To calculate carbonbiomass of bacteria, we assumed a conservative estimateof 26 fg C/cell for our cultivated bacteria (Troussellier et al.1997).Cell volume (V) of the ciliates was determined fromlength (l) and width (w) measurements, assuming a prolate spheroid shape:Vðlm3 Þ ¼ p 6 1 w bð1Þwhere b is cell breadth (in lm, as l and w). Measurementswere made on 50 ciliates each at the end of severalexperiments. As we could not measure the third dimension, we assumed that b is equal to 0.6 9 w (Foissner2013).Competition experimentsThe experiments described above assumed that G. bromelicola is the only ciliate feeding on bacterial and flagellatefood. However, in the tank bromeliads, this ciliate is oftenencountered together with B. metopoides, a small colpodean ciliate (Dunthorn et al. 2012; Foissner 2010). Accordingly, we compared the growth response of both ciliateswhen kept alone to that of pairwise experiments, i.e. withthe potential competitor present. In each of four differentcompetition experiments, we offered a combination ofbacteria and Polytomella sp. as food; initial food levelswere saturating for both ciliate species ( 2 mg C/L,Weisse et al. 2013b; this study) but declined in the courseof the experiments (Fig. 3, 5).To investigate the effect of competition on growth andsurvival of B. metopoides, we added G. bromelicola ascompetitor to the experimental containers (50-ml cultureflasks) with B. metopoides and vice versa. To ensure thatciliate growth rates with and without competitor weredirectly comparable, we inoculated, in the first competitionexperiment, from a vigorously growing B. metopoides culture, one treatment without competitor (Fig. 3A) andanother one with its competitor, G. bromelicola (Fig. 3C);similarly, we inoculated simultaneously from a G. bromelicola culture two different treatments without (Fig. 3B) andwith its competitor, B. metopoides (Fig. 3C). Each treatment was then split into three replicates. The flagellatePolytomella sp. (initial abundance ca. 50,000 cells/ml,equivalent to ca. 2.7 mg C/L) served as food for themacrostomes; bacteria (initial abundance ca. 108 cells/ml,equivalent to ca. 2.6 mg C/L) were present and served asFigure 4 Cyst formation of the ciliate Bromeliothrix metopoides inthe experiments shown in Fig. 3A and C.food for the microstomes, but were unimportant as foodfor the macrostomes. This first competition experiment,therefore, consisted of three different predator–prey treatments: (A) B. metopoides plus Polytomella sp. and bacteria; (B) G. bromelicola plus Polytomella sp. and bacteria;(C) B. metopoides and G. bromelicola plus Polytomella sp.and bacteria. The duration of this experiment (1 wk)turned out to be too short to reveal whether the ciliatesmay outcompete each other. Further, we did not monitorbacterial levels. To this end, we repeated this competitionexperiment with several modifications and extended theduration up to 4 wk; we also measured bacterial concentration together with flagellate and ciliate abundance. Inthe second competition experiment (Fig. 5A, B), we provided Polytomella sp. and bacteria at similar initial satiatingamounts as in the previous experiment (ca. 50,000 Polytomella/ml, ca. 108 bacteria/ml) but did not add additionalfood in the course of the experiment. Due to ciliate grazing, food limitation was likely after several days. To reducefood limitation, we added flagellate food 5 d after thebeginning of the third competition experiment (Fig. 5C, D).Finally, in a fourth competition experiment (Fig. 5E, F), weadded food upon each sampling occasion, beginning onexperimental day 5. Initial ciliate abundance ranged from30 to 40 cells/ml in all competition experiments. The general experimental conditions, the analyses of protist andbacterial cell numbers, and the calculation of protistgrowth rates were identical to the growth experimentsreported above.Response to pHWe investigated the growth and survival of G. bromelicolaover pH ranging from 4.0 to 9.0; pH was measured using amicroprocessor pH-mV meter (model pH 526; WTW, Weilheim, Germany) to the nearest 0.01 unit. The pH sensorwas 2-point calibrated with standard buffer solutions ofpH 6.87 and pH 9.18 before each series of measurement. Ciliates and their prey (provided at satiating amounts)were acclimated to the experimental conditions in steps of 2013 The Author(s) Journal of Eukaryotic Microbiology 2013 International Society of ProtistologistsJournal of Eukaryotic Microbiology 2013, 60, 578–587581
Life Strategies of Two Ciliates from BromeliadsWeisse et al.Figure 5 Competition experiment with the ciliates Bromeliothrix metopoides and Glaucomides bromelicola (bottom panels) fed bacteria and theflagellate Polytomella sp. (top panels). (A, B) No additional food was added in the course of the experiment. (C, D) Additional food was added onday 5 of the experiment (indicated by dashed lines and arrows in Fig. 5C). (E, F) Additional food was added on each sampling occasion, beginningon day 5 of the experiment. Bacterial abundance is related to the left y-axis in Fig. 5A, C, E; flagellate abundance is related to the right y-axis inFig. 5A, C, E. Symbols represent means of duplicates, error bars denote 1 SD.0.5 pH unit change per day for 2–5 d. We measured andadjusted the pH in each experimental container twice perday; when pH differed by more than 0.2 from the targetpH, it was adjusted by addition of small amounts (15–35 ll)of 0.1 mol/l NaOH or HCl (Weisse and Stadler 2006;Weisse et al. 2007, 2013c). The general experimentaldesign followed that of the growth experiments.We used an incubator with a constant temperature of22.5 C without illumination for all experiments. Except forthe competition experiments 2–4 (results reported in Fig.5), which were performed in duplicate, all experimentswere run in triplicate. Results reported are mean values 1 standard deviation (SD).Data analysis and statisticsCiliate growth rate (l) was calculated from changes in cellnumbers, assuming exponential growth over the experimental period according tol ¼ lnðNt N0 Þ tð2Þwhere N0 and Nt are ciliate numbers at the beginning andat the end of the experimental period, respectively. Pleasenote that ‘experimental period’ does not denote the totalduration of an experiment, but specific periods of 1–4 deach during which the ciliate population increased exponentially. Details are reported in the Results section.Ciliate growth rates were related to the geometric meanprey concentration (P) during the experimental period(Frost 1972; Heinbokel 1978) according to Eq. 3:P¼Pt P0lnðPt P0 Þð3Þwhere P0 and Pt are the initial and final prey concentrations (cells/ml) during incubations.Ciliate growth rates were fit to Eq. 4, which includes apositive x-axis intercept, using the Marquardt-Levenbergalgorithm (SigmaPlot; SPSS Inc., Chicago, IL).l ¼ lmax ðP X0 Þ ðk þ P X0 ÞFigure 6 pH response of the ciliate Glaucomides bromelicola fed bacteria only, respectively bacteria plus the flagellate Polytomella sp. Barsrepresent means of triplicates, error bars denote 1 SD.582ð4Þwhere l is the growth rate (/d), lmax is the maximumgrowth rate (/d), P is the geometric mean prey concentration (Eq. 3), k is a constant (cells/ml), and x′ is the x-axisintercept (i.e. threshold concentration, cells/ml, wherel 0). This equation is similar to the Michaelis–Mentenmodel and Holling’s type II functional response (Holling1959), but assumes a positive x-axis intercept where 2013 The Author(s) Journal of Eukaryotic Microbiology 2013 International Society of ProtistologistsJournal of Eukaryotic Microbiology 2013, 60, 578–587
Weisse et al.population growth equals mortality (Weisse et al. 2002).Accordingly, the constant k of Eq. 4 is similar, but notidentical to the half saturation constant known fromMichaelis–Menten kinetics. The curve resulting from Eq. 4that describes the change in predator density as a functionof change in prey density is known as numerical response(Solomon 1949).One-way ANOVA and Student’s t-test were used to testfor significant differences between several pairwise treatments. Results were considered statistically significant ifp 0.05.RESULTSResponse to food supplyWith Polytomella sp. and bacteria as food, G. bromelicolashowed a typical numerical response curve (Fig. 1A). Thenonlinear curve fit (Eq. 4) yielded a maximum growth rate(lmax) of 3.55/d, a constant k 7,035 Polytomella cells/ml,and an x-axis intercept (x′ in Eq. 4, where l 0) of 868Polytomella cells/ml. All parameter estimates and thecurve fit were statistically significant (p 0.001,R2 0.882). When converted to carbon units, food levelsat near-to-maximum growth rates (l 3.0) were 1.92 mgC/L, k was reached at 0.38 mg C/L, and x′ amounted to0.05 mg C/L. The percentage of flagellate-feedingmacrostomes ranged from 1.0% to 8.5% of the total G.bromelicola cell number. The calculations above ignore thepresence of bacteria that were, most likely, primarily usedas food by the microstomes. Bacterial levels ranged from1.1 to 10.5 9 106 cells/ml in the numerical responseexperiment, equivalent to 0.03–0.28 mg C/L. As bacterialabundance was positively correlated with Polytomellaabundance, the threshold food concentration of G. bromelicola was likely close to 0.1 mg C/L, and lmax wasrecorded when total food concentration (i.e. Polytomellasp. plus bacteria) reached ca. 2.2 mg C/L.We did not assess the numerical response of G. bromelicola to bacteria as sole food, because we had observedin our routine cultures that ciliate growth rates are lowerin the absence of the flagellate (Weisse, unpubl. data, butsee below, Response to pH).When we replaced Polytomella sp. by Cryptomonas sp.,G. bromelicola needed approximately 3 d to adapt to thenew food (Fig. 2). Irrespective of the food level, ciliategrowth rates were low to moderate during the first 2–3 dof the experiment and then increased. Differencesbetween Cryptomonas abundance in the experimentalcontainers with ciliates and controls without ciliates weresmall and mostly statistically not significant during thisperiod, suggesting that G. bromelicola did not at all or onlysparsely feed upon the flagellates. However, at day 7,Cryptomonas levels were significantly lower (pairwiset-tests, p 0.001 in each case) in each experimentalcontainer than in the respective controls, and ciliate numbers had increased, relative to the first 4 d of the experiment (Fig. 2A–D). Only at the lowest flagellate abundance(ca. 15,000 cells/ml), the ciliates did not grow during theLife Strategies of Two Ciliates from Bromeliadsperiod of observation, although bacteria were present inmoderate abundance at the beginning of the experimentand continuously increased up to 9 9 106 cells/ml to theend of the observation period (Fig. 2A). The decline in bacterial levels recorded in Fig. 2C, D demonstrates that G.bromelicola microstomes fed on bacteria, because bacterial levels did not decline in the controls without ciliates.Similarly, the initial bacterial growth in treatments A and Bwas lower than in the respective controls (data notshown). The difference between Cryptomonas sp. abundance in the experimental containers and controls indicates that the flagellate was ingested by G. bromelicola atthe lowest flagellate abundance tested. However, thecryptophyte biomass of ca. 0. 4 mg C/L did not supportpositive ciliate growth. Including bacteria, the total concentration of potential food was ca. 0. 6 mg C/L at the end ofthis experiment.When we plotted the ciliate growth rate measuredbetween experimental days 4–7 vs. the mean Cryptomonas abundance during this period, we obtained a numericalresponse curve with a statistically significant (R2 0.896)curve fit (Fig. 1B). However, comparing Fig. 1B to Ademonstrates that lmax of G. bromelicola was significantlylower (0.60/d) with Cryptomonas sp. as food and the cellular threshold prey concentration was approximately tenfoldhigher for Cryptomonas sp. than for Polytomella sp. Interms of biomass, the difference was lower, ca. 0. 30 mgC/L (Cryptomonas sp.), respectively, 0.05 mg C/L (Polytomella sp.). Including bacteria, we estimated a totalthreshold concentration of ca. 0.5 mg C/L for G. bromelicola fed Cryptomonas sp. and bacteria. Tables 1, 2 summarize the results obtained in both numerical responseexperiments.Competition for foodWhen kept alone with their prey, both ciliates startedgrowing exponentially after an initial lag phase (Fig. 3A, B).In contrast to B. metopoides (Fig. 3A), exponential growthof G. bromelicola continued to the final day of observation(Fig. 3B); l calculated from linear regression of ln cellnumbers vs. time was 1.19 0.12/d (days 1–6, n 6,R2 0.960) for B. metopoides, respectively, 1.37 0.07/d(days 2–7, n 6, R2 0.989) for G. bromelicola. Highestgrowth rates from day to day were reached for both ciliates during days 3–4, with lmax 2.45 0.16/d (B. metopoides) and lmax 2.01 0.20/d (G. bromelicola). In thelatter case, average ciliate cell number increased from84.3 to 632.0 cells/ml during days 3–4; due to the largescale of the y-axis, this is difficult to deduce from Fig. 3B.In the pairwise experiment (Fig. 3C), B. metopoidesreached the same continued growth rate, 1.20 0.09/d,as in the single growth experiment, but for a shorter period (days 1–4, n 4, R2 0.989); during days 4–6, l of B.metopoides was 1.0/d. Similarly, highest day to daygrowth rate was reached during days 3–4; however,lmax 1.51 0.02/d in the competition experiment wassignificantly reduced (p 0.001) compared to the singlegrowth experiment. Maximum cell number in the former 2013 The Author(s) Journal of Eukaryotic Microbiology 2013 International Society of ProtistologistsJournal of Eukaryotic Microbiology 2013, 60, 578–587583
Life Strategies of Two Ciliates from BromeliadsWeisse et al.Table 1. Parameter estimates of the numerical response curves (seetext, Eq. 4) of Glaucomides bromelicola fed the flagellates Polytomellasp., respectively, Cryptomonas sp.VariableCoefficientSECoefficientWith Polytomella sp. asfoodlmaxx′kR23.558687,0350.88SEWith Cryptomonas sp. 0.900.14**670***6,782*0.07****p 0.102.**p 0.01.***p 0.0001.lmax, maximum growth rate (per d), x′, threshold food concentration(cells/ml), k, a constant (cells/ml), R, coefficient of determination, SE,standard error.was 4,700 cells/ml, compared to 8,060 cells/ml in the single growth experiment. Final abundance of B. metopoideswas 6,041 374 cells/ml (single growth), respectively,777 166 cells/ml (pairwise growth). These differencesin the duration of exponential growth and final cell numbers were affected by a switch to mass encystmentobserved in the competition experiment during days 6–7(Fig. 4). On day 7, cyst abundance in the competitionexperiment was significantly higher (p 0.001) than in thesingle growth experiment. The opposite was true for days2 and 4; we recorded no difference in cyst abundancebetween the two treatments during days 0, 1, 5, and 6.Continued exponential growth rate of G. bromelicola inthe pairwise experiment (Fig. 3C) was identical to thatmeasured in the single growth experiment (1.36 0.08/d;days 3–7, n 5, R2 0.988); similarly, lmax 1.88 0.10/d reached during days 3–4 and was not different(p 0.369) from the single growth experiment. Consider-ing that G. bromelicola grew exponentially, differences inits final abundance reported in Fig. 3B, C were minor.Both ciliate species formed macrostomes in the competition experiments, with typical percentages ranging from2% to 7% of the total cell number.In summary, the first competition experiment demonstrated some effect of G. bromelicola on B. metopoides,but virtually no effect of the latter on the former. Theexperimental duration was too short to reveal if B. metopoides may be outcompeted by G. bromelicola. In thefollowing three competition experiments, we extendedthe duration up to 4 wk; we also measured bacterial concentration together with flagellate and ciliate abundance.Results shown in Fig. 5 demonstrate that both ciliatesmay coexist over several weeks. In the second competition experiment, without feeding (Fig. 5A, B), both ciliatescoexisted with small, but relatively stable populations(B. metopoides: 242 150 cells/ml, G. bromelicola 313 285 cells/ml) after 2 wk, when the abundance of thefood flagellate Polytomella sp. remained 1,000 cells/ml,and bacterial levels were close to 0.2 9 108 cells/ml(Fig. 5A). Starting 1 wk after the beginning of the experiment, the abundance of encysted B. metopoidesexceeded that of motile cells and continuously increaseduntil the end of the experiment (Fig. 5B)
(final concentration 2% v/v). Ciliate cell numbers were determined microscopically either in counting chambers of 3 ml volume or in Sedgewick Rafter chambers of 1 ml vol-ume. Flagellate cell numbers were also counted micro-scopically, either together with the ciliates or separately in a 1-ml Sedgewick chamber. At higher abundance