Transcription
Renewable Energy 101Andy Walker, PhD PEPrincipal Engineer, NRELRenewable Energy Round TableMarch 27, 2012NREL/PR-7A40-54593NREL is a national laboratory of the U.S. Department of Energy, Office of Energy Efficiency and Renewable Energy, operated by the Alliance for Sustainable Energy, LLC.
Outline RE PolicyoLawsExecutive Orders RE TechnologiesoooooOperating PrincipleCost and PerformanceIncentivesCase StudiesHelpful ResourcesPhoto by John De La Rosa, NREL/PIX 19978oPhoto by Dennis Schroeder, NREL/PIX 19200 Integration IssuesooNet Zero and BeyondRE Project PlanningPhoto by Corey Patrick, NREL/PIX 165802
Renewable Energy Policy
What is the Federal Definition of Renewable Energy?Electric energy generated from: Solar Wind Biomass Landfill gas Ocean (including tidal, wave, current, and thermal) Geothermal Municipal solid waste New hydroelectric generation capacity achieved fromincreased efficiency or additions of new capacity at anexisting hydroelectric projectoEPAct 20054
Renewable Energy TechnologiesPhotovoltaicsWind PowerSolar Water HeatingPhoto by David Hicks, NREL/PIX 18455Photo by Joe Ryan, NREL/PIX 19691Photo from City of San Jose, NREL/PIX 19487Solar Vent Air PreheatConcentrating SolarHeat/PowerBiomass Heat/PowerPhoto by Warren Gretz, NREL/PIX 00595DaylightingPhoto by Geri Kodey NREL/PIX 14380Photo by Kim Yost, NREL/PIX 11915Ground Source Heat PumpLandfill GasPhoto by Devin Egan, NREL/PIX 17440Photo by Warren Gretz, NREL/PIX 03793Photo by Joe Ryan, NREL/PIX 194245
LegislationEPAct 2005 Not less than 5% of electricityconsumed by the Federalgovernment must come fromrenewable energy in fiscal years2010-2012 Not less than 7.5% in fiscal year2013 and thereafter Renewable energy projectsprovide bonuses if energy is:produced on Federal lands andused at a Federal facility; oro produced on Native American landand used at a Federal facility.o6
LegislationEISA 2007 30% solar hot water innew buildings 0% fossil fuels by 2030in new buildings 40 year analysis periodfor RE Facilitates ESPC for RE7
Executive Orders Executive Order.13423½ of RE goal must be“new”o Thermal counts in ½new requiremento Executive Order 13514 GHG accounting andsustainability plans8
Guidance Available from FEMP For on-site projects, agencymustretain or replace RECs toshow use Simply hosting a renewableproject without RECs doesnot help meet Federal goals Excludes system mix energyand energy used to meetstate RPS requirements Rules are stricter for GHGaccounting than for EPACT05 accountingwww1.eere.energy.gov/femp/pdfs/epact05 fedrenewenergyguid.pdf9
Energy EfficiencyRenewable EnergyAny questions?10
EE RE 0Conventional energy useQuantityofEnergyRenewable energy useConventional EfficientIntegratedefficiency &renewableNet ZeroStrive for 40-70% energy reduction 1 spent on EE lighting 6 of PV (an NPS project) 1 spent on EE refrigeration 2 of PV (an NPS project) 1 spent on EE 2 spent on RE (EIA Press ReleaseAug 2011)1111
EE RE Example: Camp Smith, HIARRA/FEMP AssessmentPNNL evaluated EE measuresNREL evaluated RE measures9000080000Annual Energy (million BTU)7000060000Solar Hot ic300002000010000Photo by DOE Federal Energy ManagementProgram (FEMP), NREL/PIX 172540BaseCaseEE CaseRE CaseEE RE Case12
Photovoltaics
Photovoltaics (PV) Photovoltaic cellsdirectly transformsolar energy to anelectrical energy DC converted to AC byinverter Solid‐state electronics,no‐moving partsPhoto from MREA, NREL/PIX 1870714
Grid Connect PV SystemImage by Al Hicks, NREL15
Flat Plate PV SystemsArizona Public Service, Prescott, AZDangling Rope Marina, Glen CanyonNational Recreation Area, UTPhoto from Arizona Public Service, NREL/PIX 13739Alamosa PV System, Alamosa, COPhoto by Warren Gretz, NREL/PIX 07990 5 – 10 acres per MW for PV systems Land can be left as is or gradedPhoto by Tom Stoffel, NREL/PIX 1555816
17
Concentrating PV SystemsReflectivePhoto from David Parsons, NREL/PIX 0663918
19
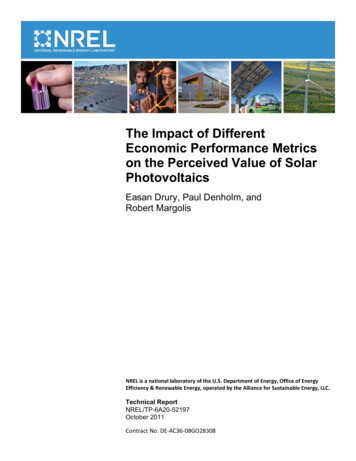
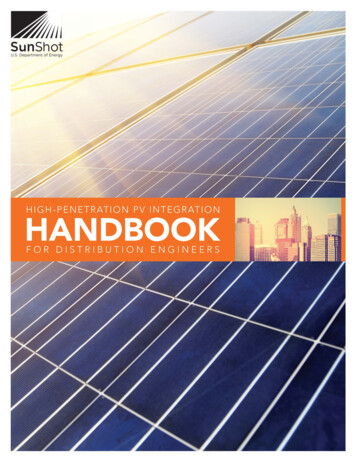
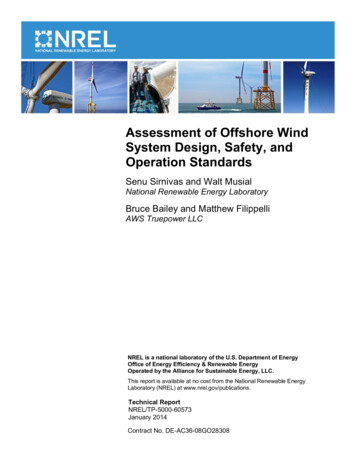
Module Price ( /Watt)Price of PV Modules3530252015105 5.0001970 4.0019801990200020102020 3.00 2.00Year 1.00 0.00200520062007Global Module Price Index2008200920102011Aug. '11 Reported Chinese c-Si Price20
PV Cost, O&M, and EfficiencyPV System TypeGround Mounted FixedGround Mounted TrackingEfficiency Power Out/Power InModuleEfficienciesSingle Crystal14-19%Multi Crystal13-17%Thin Film6-11%Balance of System EfficiencyAnnual O&MCost as aPercentage ofInstalled Cost0.17%0.35%Efficiency vs. Size– 1 kW of 15% eff. crystalline– 1 kW of 9.5 % eff. amorphous– 1 kW of 19.3% eff. hybrid71ft299ft255ft277%21
PV Operation and MaintenanceTuscon Electric Power Data PROGRESS IN PHOTOVOLTAICS: RESEARCH AND APPLICATIONSProg. Photovolt: Res. Appl. 2008; 16:249–259Published online 3 December 2007 in Wiley InterScience (www.interscience.wiley.com) DOI: 10.1002/pip.80022
Veterans Administration Jerry L. Pettis Memorial MedicalCenter in Loma Linda, CA 309 kWdc 1,584 PV modules SunLink racks minimum roofpenetration Advanced Energy Solaron333kW inverter Feasibility Study by NRELestimates:475 MWh/year delivery; 60k/year savings; 2.9millioncost without any incentives Procured off GSA Scheduleforcomplete PV systems23
Results Veterans Administration Loma Linda, CA24
25
26
Where to Install Solar On the “Built Environment” where unshadedoOn existing building roofs that have an expected life of at least 15more years and can accept added load. Reduces solar load on building.NEPA categorical exclusion.oOn ALL new buildings – all new building should be “solar ready”– See http://www.nrel.gov/docs/fy10osti/46078.pdfoOver parking areas, pedestrian paths, etc. – energy generation andnice amenity. On compromised lands such as landfills & brownfields.oSaves green fields for nature.oIF installed on green fields minimize site disturbance, plant native lowheight vegetation as needed.27
Customs and Border Protection Solar-Powered SBInet TowersSecure the U.S. SouthwestBorderoooSolar panelsBattery systemPropane-fueled backup generator Federal funding andappropriations covered theinstallation costs and continuesto cover testing andmaintenance costs.28
Photovoltaics Resources Solar Energy ResourcesoNRELoFirstlookoTMY or Weather Data– http://firstlook.3tiergroup.com/– http://rredc.nrel.gov/solar/old data/nsrdb/1991-2005/tmy3/State and Utility Incentives and Utility Policieso – olar PV Analytical ToolsoSolar Advisor Model (SAM)oHOMERoPVWattsoRETScreenoIMBY– https://www.nrel.gov/analysis/sam/– https://analysis.nrel.gov/homer/– http://www.nrel.gov/rredc/pvwatts/– http://www.retscreen.net/– http://www.nrel.gov/eis/imby/29
Solar Water Heating
Solar Water Heating Applications Low TemperatureoSwimming poolheating Medium TemperatureoPhoto from Gen-Con, Inc., NREL/PIX 09320ooDomestic water andspace heatingCommercial cafeterias,laundries, hotelsIndustrial processheating High TemperaturePhoto by Amy Glickson, NREL/PIX 14167ooIndustrial processheatingElectricity generationPhoto from Alan Ford, NREL/PIX 0950131
Solar Thermal Collector Types32
Solar Water Heating System33
Solar Water Heating System CostAverage:Around 150/sf34
USCG Housing, Honolulu HI 62 units installed 1998 Savings of 9,700 kWh/yrand 822/yr per system 4000/system cost Simple payback of 4 years(with rebate)35
36
Solar Water Heating Resources Design Toolso – http://www.retscreen.net/ang/g solarw.phpFchart – Active and Passive Systems Analysiso RETScreen - Solar Hot Waterhttp://www.fchart.com/fchart/ResourcesoDOE Energy Efficiency and Renewable Energy Solar Energy Technologies ProgramoFEMP Federal Technology AlertsoFEMP Case StudiesoResource mapsoSolar Radiation Data Manual– http://www1.eere.energy.gov/solar/solar heating.html– www.eere.energy.gov/femp/pdfs/FTA solwat heat.pdf– www.eere.energy.gov/femp/pdfs/FTA para trough.pdf– www.eere.energy.gov/femp/technologies/renewable casestudies.html– http://www.nrel.gov/gis/solar.html– http://rredc.nrel.gov/solar/pubs/redbook37
Concentrating Solar Power
Concentrating Solar Power TechnologyTowerPhoto by Hugh Reilly, NREL/PIX 02186Mirrors are used to reflectand concentrate sunlightonto receivers that collectthis solar energy andconvert it to heat.TroughDishPhoto from Sandia, NREL/PIX 08469Photo by Warren Gretz, NREL/PIX 0032739
CSP Applications Typically utility-scaleapplications Heat from CSPoGenerate hot water orsteam SteamoGenerate electricityPhoto by Geri Kodey, NREL/PIX 1438340
RE in ESPC ExampleConcentrating Solar Thermal (Industrial Process Heat)Federal Correctional Institution - Phoenix, AZMonth Energy and Cost SavingsTotal Delivered Heat(million prMayJunJulAugSepOctNovDecMonth 17,040 square feet of parabolic trough collectors 23,000 gallon storage tank Installed cost of 650,000 Delivered 1,161,803 kWh in 1999 (87.1% of the water heating load). Saved 77,805 in 1999 Utility Costs41
Solar Ventilation Air Pre-heat
Project Considerations Panels are aluminum or steel Roll-punch slots with three porosity options Corrugated to increase structural rigidityPhoto by Warren Gretz, NREL/PIX 14383 High outdoor air ventilation requirement in heating dominated climate South-facing wall surface is besto45 of south gives 80%oEspecially during low winter sun anglesoBlack is best, other colors have efficiency loss up to 10% Unshaded surface Dark collector color43
Solar Vent Preheat PrincipleBoundarylayer4 - 6 in. Sun warms the collectorsurface Heat conducts fromcollector surface to thermalboundary layer of air (1mm thick) Boundary layer is drawninto perforation by fanpressure before heat canescape by convectionSolar wall South wall44
System Components Transpired solarcollectoroPerforated sheet ofcorrugated metal Air distributionoDuctwork, fan andbypass damper ControlsoTemperature andtimeclock, or EMCS45
Solar Vent Preheat Resource46
47
Solar Ventilation Air Preheating: EPA Lab (Golden, CO) Hazardous materialstorage building Installed in 2001 296 sf, 2000 cfm 58% measuredefficiency Saves 60 Mil Btu/yr and 450/yr of natural gas Payback 13 years48
Advantages Relatively low cost for on-site renewable energy utilization Reliability of equipment and system– Only moving part is the fan– Operates at ambient temperature Very low maintenance High efficiency No storagePhoto by Patrick Corkery, NREL/PIX 17424Photo by Dennis Schroeder, NREL/PIX 1782549
Solar Vent Preheat Resources FEMP Federal Technology Alertoowww.eere.energy.gov/femp/pdfs/FTA trans coll.pdfSolar Ventilation Preheating Resources and Technologies NREL– wable svp.htmloSolar Process HeatoSolar Space Heating Maps– http://www.nrel.gov/learning/re solar process.html– http://www.nrel.gov/gis/femp.html#space Conserval Systems, Inc.: SOLARWALL www.americansolar.comowww.retscreen.net ATAS International, Inc.: InSpire American Solar Inc.: Solar Thermal Tile System RETScreen International Clean Energy Project Analysis Software50
Passive Solar in NewConstruction
Passive Solar Types:oo oDirect GainSunspaceThermal Storage Wall (Trombe Wall)For new construction, in areas with low internal heat gainSouth-facing Solar AperturesAdded thermal mass to absorb heat and release at nightControls such as operable shades and windowsTrombe Wall, NREL. Photo by Warren Gretz,NREL/PIX 01693,52
Daylighting Lighting accounts for 25% oftotal electricity used inFederal sector Daylighting uses windows &skylights in conjunction withautomatic light controls tominimize the need for electriclighting during daylight hours Daylighting combined withlighting controls can reducelighting energy consumptionby 40 ‐60%53
Wind
Wind Sizes and ApplicationsSmall ( 10 kW) Homes Farms Remote Applications(e.g. water pumping,telecom sites,icemaking)Intermediate(10-250 kW) Village Power Schools,businesses Hybrid Systems Distributed PowerLarge (660 kW - 2 MW) Central Station Wind Farms Distributed Power Community Wind55
Wind Generationin the U.S.56
Warren Air Force Base, Cheyenne 600 kW wind turbines 2.5 million installed Generates energy topower 522 households onbase Avoids 5,000 tons/year inGHG emissions Saves 3 million in energycostsover 20 years Additional capacityplanned57
RE in ESPC Example - BOP Federal Correctional Institution - Victorville, CA Awarded 09/03 Initial capital investment 5.4M, 19 year term withNORESCO Scope includes HVACcontrols upgrade, 750 kWwind turbine, and 74.5KWPV Carport First ESPC financed windturbine SCE provided RE generationfinancial incentive 4/W Escrow account for windturbine maintenance58
59
Installed Costs and O&M CostsInstalled Costs 500kW 2500 to 3500/kW 500kW 2000/kWOperation and Maintenance Costs 500kW 0.035/kWh 500kW 0.025/kWhThese numbers can be used for feasibility calculations.There is huge variability depending on the current marketand the site selected.60
Wind for the Coast Guard Generate 2.4 kW at 24mph wind 1 kW for augmentingpower at telecom sites61
Wind Resources AWEA Web org NWTC Web site National Wind Coordinating Collaborative Utility Wind Interest Group site WPA Web site Homepower Web Site Windustry Project Best Links62
Other Wind Resources American Wind Energy Associationhttp://www.awea.org/oAWEA Small Wind Toolbox–www.awea.org/smallwind/ AWS Scientific Inc. “Wind Resource AssessmentHandbook” produced for the National Renewable EnergyLaboratory, Subcontract number TAT-5-15283-01, 1997ohttp://www.nrel.gov/publications Wind Energy Explained;J. F. Manwell, J. G. McGowan, A. L.Rogers; John Wiley & Sons Ltd. 2002. Wind Power; Gipe, Paul; Chelsea Green Publishing, 200463
Biomass
What is Biomass in Terms of Renewable Technologies? Wood and wood wasteAgricultural wasteBagasseFood processing residuesAnimal wastesMunicipal solid wasteEnergy cropsLandfill gasMethane from waste andwastewater treatmentPhoto by Warren Gretz NREL/PIX 1159765
Range of BioenergyBiomassFeedstockConversionProcessesPhoto by Warren Gretz, NREL/PIX 11597 Trees Combustion Grasses Gasification Agricultural Crops Pyrolysis Residues Co-firing Animal Wastes Enzymatic Fermentation Municipal Solid Waste Gas/liquid Fermentation Algae Acid Hydrolysis/Fermentation Food Oils, Waste Oils Trans-esterificationProductsFuels Ethanol Biodiesel “Green” Gasoline &DieselPower Electricity HeatChemicals Plastics Solvents Chemical Intermediates Phenolics Adhesives Furfural Fatty Acids Acetic Acid Carbon Black Paints Dyes, Pigments, and Ink Detergents Etc.Food and Feed66
67
Commercial Technologies Almost all commercial powersystems arecombustion/steam turbine Efficiencies in 15% – 30%range power only, (60%-70%CHP) Stokers and fluidized bed 500 facilities in U.S Installed costs 1,700 3,500/kW Smaller systems ( 5 MW) stillhave poor economics LCOE 0.06 - 0.20/kWh68
NREL Renewable Fuels Heating Plant (Golden, CO) 3.3 million cost under anESPC Pine beetle waste wood 75% of the 50,000 millionBtus to heat campus. Cost savings projected 400,000/year The wood chips cost 29 perton or 2.42 per million BTUs During cold weather, plantburns a truckload of woodchips per day; produces 600gallons of hot water perminute Stores four days of wood chipfuel69
RE in ESPC Example - DOE Savannah River Site New 20 MW wood wastecogeneration plant and twobiomass heating plants withlocal fuel source 19 year contract Includes performanceguarantee and O&M Annual Savings of 34 Mproject cost of 183 M Task order signed 5/15/09 Construction completedDecember 2011 Important project to meetfederal renewable goal/DOEOrder 230.2b70
RE in ESPC Example - USCG Baltimore, Maryland Landfill Gas Boiler Conversion to LFGooCogeneration Plant4 MW Electricity 8,000 lb/hr Steam 15 year contract length Project Investment : 15.0million Annual Savings: 2.5million Offsets 18,000,000 kWh/yrand 71,000 decatherms/yrof Natural Gas Operational: April 200971
Biomass in Kodiak, AK Wood pellets in Coast Guard boilers in place of expensive fuel oiloPellets from wood waste and second-growth trees from local TongassNational Forest BenefitsooooSave taxpayer dollarsImprove operations and resiliencySupport energy independenceFoster environmental stewardship72
Biomass Resources DOE Energy Efficiency and Renewable Energyohttp://www1.eere.energy.gov/biomass/ NRELohttp://www.nrel.gov/biomass/73
Geothermal
Geothermal Energy Technology OverviewApplication opportunities include: Direct Use - Using hot waterfrom springs or reservoirsnear the surface. Electricity generation – Usingsteam, heat or hot waterfrom deep inside the earth todrive turbines. Geothermal heat pumps –Using the earth,groundwater, or surfacewater as a heat source andheat sink75
Geothermal ApplicationHeat ProductionDistrict Heatingo Process Heato Agricultureo AquacultureoElectricity Generationo Distributed Powero Central StationPower76
Ground Source Heat Pumps Marine Corps Air Station, Beaufort, SC Geothermal heat pumptechnology is the energy-savingcenterpiece of this Marinehousing facility. Energy-efficient geothermalheat pumps replaced 2,500 tonsof existing HVAC systems andhot water heaters. These heat pups provide spaceheating, cooling, and domestichot water for 1,235 familyhousing units at the BeaufortMarine Corps installation.Photo by Belton Tisdale, NREL/PIX 1237277
78
Geothermal Resources Western Area Power aqs.html DOE Geothermal Technologies Program Resource Mapsohttp://www.nrel.gov/gis/geothermal.html79
Hydro and Ocean Energy
What are the Hydropower and Ocean Energy Options? Small projects useturbines in place ofpressure reducing valves Large Hydropower istypically notcost-effective unless thesitehas access to existinghydroelectric dam Hydropower is a commonform of Renewable EnergyCredits81
Ocean Energy Wave powerMarine current powerTidal EnergyOcean ThermalEnergy ConversionoRelatively immature82
Wave Energy Technology83
Wave Power for U.S. Coast Guard 1st District Lighthouses84
Marine Current Technology85
Tidal Energy ResourceWave Power Levels in KW/m Crest Length86
Ocean Thermal TechnologyThe OTEC energy resource constitutes an estimated 1013 W (876,000TWh/yr)for potential base load power generation.OTEC functions best when there isa 36 F (20 C) difference87
Integration Issues
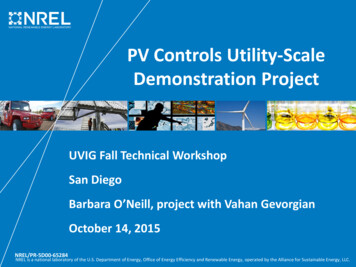
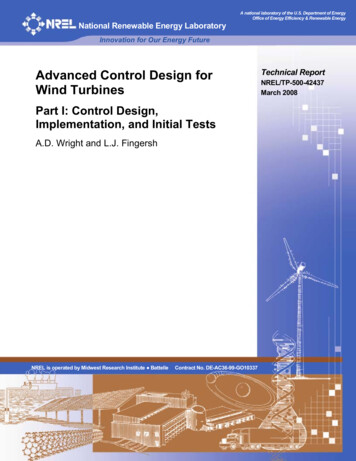
Net MeteringNet M eteringwww.dsireusa.org / March 2010ME: 660WA: 100co-ops & munis: 100MT: 50*ND: 100*OR: 25/2,000*VT: 250MN: 40WI: 20*WY: 25*NE: 25NV: 1,000*CA: 1,000*UT: 25/2,000*CO: no limitIL: 40*MO: 100NM: 80,000*RI: 1,650/2,250/3,500*KY: 30*VA: 20/500*NC: 1,000*OK: 100*NY: 10/ 25/500/2,000*WV: 25PA: 50/3,000/5,000*DCNJ: 2,000*DE: 25/500/2,000*MD: 2,000AR: 25/300GA: 10/100DC: 1,000LA: 25/300AK: 25*FL: 2,000*HI: 100KIUC: 50State policy*CT: 2,000*OH: no limit*IN: 10*KS: 25/200*MA: 60/1,000/2,000*MI: 150*IA: 500*co-ops & munis: 10/25AZ: no limit*NH: 100Voluntary utility program(s) onlyPR: 25/1,000State policy applies to certain utility types only (e.g., investor-owned utilities)43 states DC & PR haveadopted a netmetering policyNote: Numbers indicate individual system capacity limit in kW. Some limits vary by customer type, technology and/or application. Other limits might also apply.89
Problems with “Net” Metering Pros:ooIncentive for RESaves Some Fuel (up to a limit) Cons:Limits to Fuel SavingsDoesn’t save any other utilityoperating costso RE may be curtailed; limits oninstallations (eg 15% in HI)o Socio-economic problem: foistsutility costs on those least able toafford it.oo Utility Cost RecoveryoooSpinning ReserveRetail/buy-back spread (c/kWh)Stand-by Charges ( /kW/month)90
Zero EE RE Microgrid Strategies for “Zero” rather than “Net Zero”oooooooooTracking SolarSolar on different orientations (East-South-West)Spatial DiversityDiversity of RE Measures (Solar, Wind, Etc)Dispatchable RE (biomass, hydro, geothermal, landfill gas)Flexible Grid Layout (circuits) to route power aroundIsolate Critical Circuits: exercise Demand ControlEnergy Storage (short and long term, electric and thermal)Micro-grid controls–––––Control requirement: maintain required frequency and voltage levelsGrid disconnect and seamless resynchronizationMicro-grid start-up (“black start”)Load control (interfaces with SCADA and EMCS)Supply control (optimized operation of DERs)91
Tracking the Sun92
Zero EE RE MicrogridFigure by Ben Kroposki, NREL93
RE Project Planning
Best Mix of Renewable Energy Technologies Depends on: Renewable Energy Resources Technology Characterization– Cost ( /kW installed, O&M Cost)– Performance (efficiency) Economic Parameters– Discount rates– Fuel Escalation Rates State, Utility and Federal Incentives Mandates (Executive Order, Legislation)95
Summary ComparisonCapital Cost Level of SiteLCOE withTechnology Level ofRImpacttax incentives ( ) 2011Commerci Ralization. W3 0.128/kWh tok 0.154/kWh 6,870/kW Low, mostbuildings.Photovoltaics;MatureS olarventilation airpreheating ;Underuti 3 0.064/kWhth 27.40/sfkermallizedS olar waterheating;MatureS olar thermaland solarthermalelectric;Biomassthermal andelectricGeothermalPower;GroundS ource HeatPumpLandfill gas;MatureMedium,limited to lowheat-gainbuildings 0.08 to 75-225/sf3k 0.20/kWhthermal 5,132/kW2 0.090 tok 0.145/kWhMedium, hotwater loadsonly.HIghMature 0.050 toH 0.094/kWhHighEarlyL 0.042 to 0.069/kWh 0.027/kWhthNermal 4,000/kW HighMature 0.0493/kWhC 2,100/kW Medium,virtual powerfrom landfillFuel Cells;Early 0.115 toN 0.125/kWh 3,800/kW LowWind;Mature1 0.044 to 0.091/kWhMature 3,995/kW 835/ton Medium 1,966/kWHigh96
REO: Renewable Energy OptimizationOptimizationLife Cycle CostDispatch ical Information System (GIS) DataSite DataIncentive Data from DSIREUSA.ORGTechnology Characteristics.9797
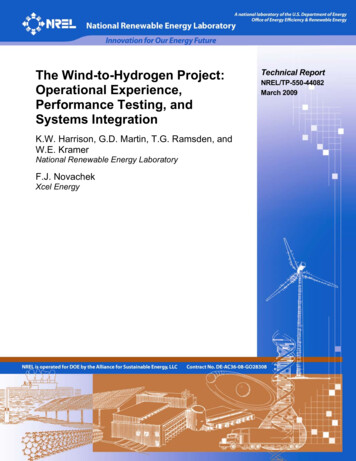
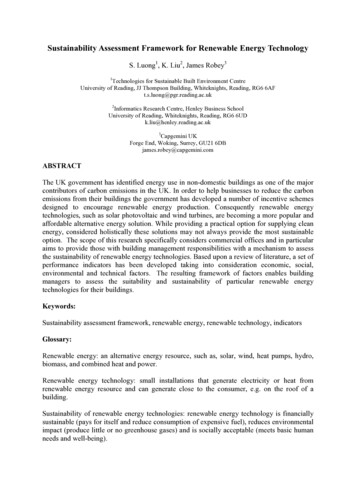
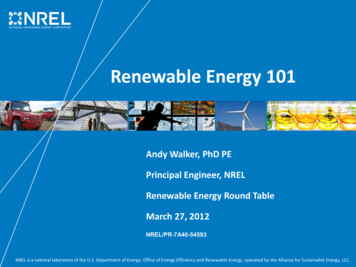
REO for Land and Ferry Points of EntrySolar Ventilation Air Preheat(sf)Solar Water Heating (sf)Solar Thermal ParabolicTrough (sf)Solar Thermal Electric (kW)Biomass Gasification Boiler(MBH)Biomass Gasification Cogen(kW)Biomass Anaerobic Digester(ft3)Biomass Anaerobic DigesterCogen (kW)Skylight Area (sf)With 300001.31.8134193000190,9510209,66611000Annual Energy (Mbtu)PV (kW)Wind Energy 0500040003000200010000Photovoltaics (Mbtu)Solar Water HeatingAnaerobic Digester (Mbtu)Wind (Mbtu)Solar Thermal (Mbtu)Daylighting (Mbtu)Solar Vent Preheat (Mbtu)Biomass Gasifier (Mbtu)98
Questions?Thank you!Andy WalkerNational Renewable Energy LaboratoryAndy.walker@nrel.gov
9 . Guidance Available from FEMP For on-site projects, agency must retain or replace RECs to show use Simply hosting a renewable project without RECs does