Transcription
DOI: 10.32602/jafas.2021.022A Comparative Analysis Between Two Energy Drink Brands: Red Bull and GoldenEagleQendrim BytyqiaLuan VardaribUniversity of Prishtina “Hasan Prishtina”, Faculty of Economics, ORCID: 0000-0001-7630-3882,qendrimbytyqi077@gmail.comb Prof.Assist.Dr., Universum College, Department of Business and Management, ORCID: 00000003-3212-5783, luan.vardari@gmail.comaKeywordsBrands, CompareAnalyse, Golden Eagle,Red Bull.Jel ClassificationN10, L15, C20Paper TypeResearch 17.05.2021AbstractPurpose: This comparison case comprises theoretical and numericaldata. Theoretical data were analysed through the SWOT matrix,while numerical data were extracted using IFE and EFE matrixes forboth Golden Eagle and Red Bull.Methodology: The methodology utilize in this research is based onthe literature study and comparative analysis associate to drinksbranding. Two brands “Red Bull and Golden Eagle” was chosenbecause they are in the same product/service category that arecompeting for the same target consumers. These two brands (RedBull and Golden Eagle) have been compared with each other usingSWOT, IFE and EFE matrix. The SWOT analysis data of both brandshas shown that in addition to the advantages that these two brandspossess, they also have weaknesses, opportunities and threats whichcan be avoided by using different types of strategies (SO, WO, ST,WT).Findings: The results of IFE and EFE matrix also have revealed thepositions of these two brands in internal and external aspects. Thedata derived from the results of the IFE matrix showed theevaluation aspects of internal factors from both brands. From thedata of the IFE matrix, it appears that both Golden Eagle and Red Bullhave the same total weighting of points 2.5. The result 2.5 is anaverage score, so the IFE internal factor rating matrix is positive forboth brands. The results obtained from the EFE matrix showed thatthe evaluation aspect of external factors Golden Eagle and Red Bulldiffer from each other. The overall weighting of points from the EFEmatrix for the Golden Eagle brand turns out to be 2.91 while for theRed Bull brand it is 3.3. The results 2.91 and 3.3 are above averagethat means that two brands are using to the maximum the externalpossibilities and minimizing the various risks with which can befaced.Originality/Value: In this study, has been made the comparison ofbeverage brands Red Bull and Golden Eagle. The addition of GoldenEagle, who is operated in Kosovo, has brought originality to thestudy and this study is aimed to be an example for other studies tobe carried out in the region.121
Journal of Accounting, Finance and Auditing Studies 7/3 (2021): 121-1351. IntroductionThe growing trend of success of different companies makes them even morecompetitive in the market, so taking into account such situation companies(organizations) which operate in the same business scope are often compared toeach other, where the only purpose is to know the main areas in which thesecompanies are focused and which has brought them to favourable competitivepositions in the market while ensuring the generation of high profits. Golden Eagleand Red Bull currently are internationally known brands, all thanks to the quality oftheir products, and this has ensured them to maintain market leadership positions(Red Bull), while the Golden Eagle brand is expanding its influence gradually aroundthe world and within a short period of time has managed to penetrate many markets.Since both of these brands have the same field of action, the energy drinks sector, inthis case study or rather called comparison case will be clearly analysed all pointsone by one. Firstly, starting from the mission and vision of the brands, then theinternal analysis and external all accompanied by interpretations in these cases whenit is considered reasonable that a point has shortcomings and something needs to beadded, as well as the inclusion of all comparative points between these two wellknown brands. The main purpose of this comparison made between these brands isto scrutinize well and clearly how they have implemented all the factors for asuccessful functional management. Meantime applying empirical analysis to considerhow these two brands stand opposite to each other. Through this comparison it isalso intended to reach general conclusions that brands in the general field of strategyimplementation may have omitted possible errors in the design of strategies.Furthermore, through the detailed analysis of this case, the comparison aims toidentify these omissions to the greatest extent possible and through theinterpretations which will be given for each point where it is thought might bereasonable to reach satisfactory conclusions from the final data that will be drawnbetween these two brands.122
Journal of Accounting, Finance and Auditing Studies 7/3 (2021): 121-1352. Literature ReviewIn their study Brick, et al, (2018) found that brand compatibility is linked to othertypes of compatibility in couples, such as education, race, and values. They alsodiscovered that when all types of compatibility are used as predictors at the sametime, brand compatibility remains a major predictor of life satisfaction. Singaram etal. (2019) suggested that. Coca-Cola should concentrate on its pricing policy, movingaway from aggressive pricing and toward offering more discounts to consumers,incentivizing them to purchase the commodity they want. This also gives theconsumer the impression that they are getting more value for their money. Althoughseveral studies have shown that energy drinks can enhance attention and memoryfor a short period of time, there is no evidence to support the fact that they canimprove one's sense of well-being. To gain a better understanding of their impact,more study and public awareness are needed. More rigorous labeling of energydrinks is needed so that consumers are aware of the exact amount of each ingredient.This is particularly important given that one of the current review's results is that thepsychological effects of energy drinks can be dose based. More research into theconsumption habits of energy drink consumers is also needed, as the amount andfrequency of consumption affect the psychological effects. Since the number ofpeople who drink energy drinks has been rapidly increasing since their launch in1997, it is important for research to keep up with the psychological impact of publictrends (FAPA, et al, 2012). It is critical for foreign companies' competitiveness andcompetitive advantage on the local market to incorporate a combination of thestudied factors into their marketing strategies in order to meet target groups in themost effective manner. More precisely, the techniques should be adapted to thetarget groups' age groups, since customer tastes differ based on their age. Finally,while advertisement campaigns are still effective at educating and persuadingcustomers of brands and products, businesses must distinguish themselves in termsof messages and strategies, among other things, As the amount of advertising cluttergrows ( Saeidinia, et al, 2012). To conquer new markets and gain a share of theinternational fast food industry, the McDonald's Corporation has used effective123
Journal of Accounting, Finance and Auditing Studies 7/3 (2021): 121-135management and global growth strategies. McDonald's has achieved immensesuccess in this situation, as well as its best practices in the global food industry,international development patterns and challenges, and numerous lessons learnedfrom their international expansion (Mujtaba and Patel, 2007). Customer satisfactionin a retail store is determined by the store's needs identity and brand value, andhappy customers are likely to become loyal customers (Roy, et al, 2011).Differentiation is the process of separating an enterprise product from its rivalsthrough a sequence of substantive differences activities. According to MichaelPotter's theory, defined the two ways in which an organization can achievecompetitive advantage over its rivals: low cost or differentiation advantage (Xin andCunli, 2011). The rapid effects of economic globalization, together with thederegulation of the textile industry, have altered the competitive climate in whichbusinesses operate (Moreno and Carrasco, 2016). Nobbs et al, (2015) suggests thatwindow displays can be used for both advertisement and sales promotion,emphasizing their uniqueness as a marketing communication tool. OPAIT (2019)found that as compared to Lamborghini, Ferrari's value in terms of the number ofcars sold worldwide increased by 60.89 percent in 2018. In addition, compared toFerrari, Lamborghini will see a 5,97% increase in value in terms of the number ofcars sold globally in 2024. Not only has the luxury goods market seen a broadening ofproduct variety and product lines under a brand name, but it has also seen a trendinto new product categories (Seringhaus and Laurier, 2008). According to the study"Customer Satisfaction toward Pepsi and Coca-Cola," 52.9 percent of customers drinksoft drinks on occasion, Pepsi is the most popular brand with 51 percent marketshare, and 85.4 percent of customers are pleased with their favorite brand. It is alsofound that 66.9% consumers are influenced by Brand name, 51.6% are influenced bycolour, 75.8% by taste, 60.5% packaging and 54.1% by technology and thus thesefactors have more impact on the purchasing decisions of the customers and minorvariations have been found in case of the price increases (33.8%) and decreases(39.5%). Customers in Jind city are 85.4 percent happy with their favorite brand. Wemay infer that Pepsi and Coca-brand Cola's names, colors, tastes, and packaging have124
Journal of Accounting, Finance and Auditing Studies 7/3 (2021): 121-135a significant impact on consumer purchasing behavior and satisfaction (LalandPankaj, 2017). Successful brands concentrate on communicating a concept thatcaters to existing ideologies and is culturally important to each consumer in order tocreate a strong foothold. The marketer focuses on creating a unique product picturebased on the product's generic assumptions (Gandhi, 2014). Coca-Cola Company andPepsiCo Inc. are very similar. Both companies have a strong global presence andrepresent a diverse range of products in the food and beverage industry, includingbottled and frozen soft drinks, carbonated beverages, and filtered water. The twocompanies are present in more than 200 countries worldwide and compete inconsumer markets using at least 20 brands each. Coca-Cola accounts for 3.3 percentof the industry share whereas PepsiCo represents 2.6 percent of the share, and eachcompany sells more than 1.5 billion servings of products each day. In the meantime,the firms are in good financial shape, with gross profit margins above 50% in 2015(Torkornoo and Dzigbede, 2017). Coca-communication Cola's policy, which wasfocused on American cultural norms rather than local norms, failed to meet the needsof its foreign audiences (Taylor, 2000).3. MethodologySecondary data and information sources were analyzed in the current study usingthe literature review, SWOT Analysis Technique, and IFE / EFE matrix, all of whichare qualitative research approaches, and a matrix was created as a result. Accordingto the matrix, internal (strengths and weaknesses) and external (opportunities andthreats) factors tried to be determined as a result of branding practices in beveragecompanies. External Factor Evaluation (EFE) Matrix provides strategies of economic,cultural, demographic, socio-political, environmental, governmental, technologicaland competitive information. Internal Factor Evaluation (IFE) Matrix summarizesand evaluates the strengths and weaknesses of the firm in its functional areas andprepares the basis for the determination and evaluation of the relationship betweenthese regions.125
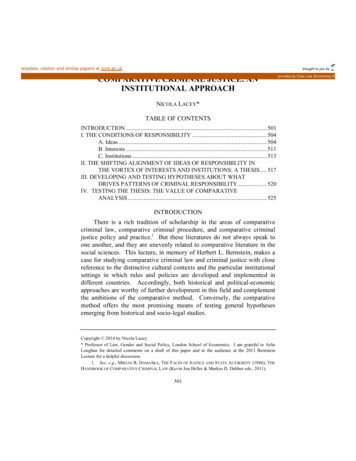
Journal of Accounting, Finance and Auditing Studies 7/3 (2021): 121-135This paper focused to compare two drinks brand (Golden Eagle and Red Bull) witheach other through the comparative analysis, where the SWOT, IFE and EFE matrixare used for this purpose.3.1.Swot Analysis(SWOT) Analysis is the acronym for Strengths, Weaknesses, Opportunities, andThreats. The first step in the planning process is to decide the organizations'priorities and missions, after which the SWOT analysis, one of the tools for strategycreation, can be adapted to the organization's strategy.Table 1. SWOT Matrix of Golden EagleInternal factorsStrengthsWeaknesses1. Company image1. Small range of products2. Quality of products2. Technology3. Product safety3. Location4. Work ethicExternal factors5. MarketingOpportunityStrategy (SO)Strategy (WO)1. Penetration into newmarketsSince the Golden Eagle brandhas created a good image in themarket, the good image can alsobe used to try out another Relaxbrand for penetration in themarkets where the Golden Eaglebrand is currently sold.As the energy drinks sector is ahighly competitive industry theopportunity that the GoldenEagle brand can take advantageof is product diversification andsegmentation of a significantmarket share.ThreatsStrategy (ST)Strategy (WT)1. CompetitionOpening branches in foreigncountries would be a goodopportunity for the brand tohave even greater reach.In order to avoid the process ofemployee turnover the brandshould consider increasing theoverall bonuses for employeesdepending on the job andposition they perform. Also agenuinemotivationbothfinancial and moral would be anadvantage in the long run.2. Increase quality3. Increasing the range ofproducts4. Opening of branches2. Government policies3. New market entrants4. InflationAlso offering a new offer interms of general specificationswould be an important step toincrease the strength of thebrandespeciallyintheinternational arena.126
Journal of Accounting, Finance and Auditing Studies 7/3 (2021): 121-135The SWOT matrix of the Golden Eagle brand presented in Table 1 reflects thestrengths, weaknesses, opportunities and threats of this brand. The advantages of theGolden Eagle brand are: Company image, Product quality, Product safety, Work ethic,Marketing. Some weaknesses of the Golden Eagle brand are: Small product range,Technology, Location. Opportunities that can be used by the Golden Eagle brand are:Penetration into new markets, Increased quality, Increased product range, Openingof subsidiaries. Some of the threats to the Golden Eagle brand are: Competition,Policies, Government, New Market Entrants, Inflation.Table 2. SWOT Matrix of Red BullInternal factorsExternal factorsStrengthsWeaknesses1. Market dominance1. Small range of products2. Rapid sales growth2. Unhealthy products3. Intensive Marketing3. Very expensive4. Global Presence4. Difficulties in patentprotection5. The power of the brand6. The symbol of youth5. Anti-brand campaigns7. Supply chain8. DiversificationOpportunityStrategy (SO)Strategy (WO)1. Development of new marketsSince red Bull has a globalpresenceandismarketdominant, it can use this as anopportunity to promote otherproducts as it has alreadyreached the market.In a situation where the energydrinkindustryisquitecompetitive then red bullshould make efforts to furtherstrengthen its market share andmake it more difficult for newentrants to access the market.ThreatsStrategy (ST)Strategy (WT)1. CompetitionSince in some countries stronganti-brand campaigns are madeas a strategy that the brand canuse the brand is the biggestpromotion of the brand andconvince those countries whereanti-brand campaigns take placethat the truth is egative health effects causedby red bull then the brandshould pay more attention tothis part by re-checking theproduct to reduce the level oftaurine and caffeine.2. New product lines3. Further productdiversification4. Social media marketing5. Increase focus on CSR2. Government policies3. Health regulations4. New market entrants5. Negative health implications127
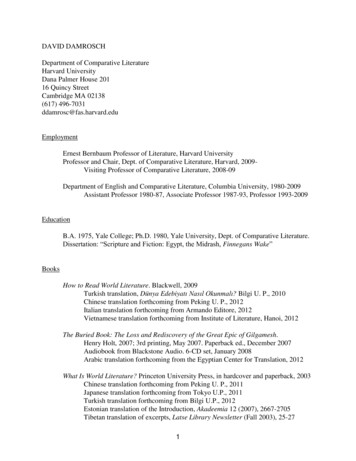
Journal of Accounting, Finance and Auditing Studies 7/3 (2021): 121-135The Red Bull brand SWOT matrix presented in Table 2 reflects the strengths,weaknesses, opportunities and threats of this brand. The advantages of the Red Bullbrand are: Market Dominance, Rapid Sales Growth, Intensive Marketing, GlobalPresence, Brand Power, Youth Symbol, Supply Chain, Diversification. Someweaknesses of the Red Bull brand are: Small range of products, Unhealthy products,very expensive, Difficulty in patent protection, Anti-brand campaigns. Opportunitiesthat the Red Bull brand can take advantage of are: Development of new Markets, NewProduct Lines, Further Product Diversification, Social Media Marketing, IncreasingFocus on CSR. The threats to the Red Bull brand are: Competition, GovernmentPolicies, Health Regulations, New Market Entrants, Negative Health Implications.3.2.Ife MatrixAfter the internal and external factors have been identified, it is time to evaluatethem. In order to perform this the internal and external factors evaluation matrixhave been utilized. In addition to the list of key internal and external factors, thetables have been presented in Importance Coefficient and Rating tables. The finalsum of scores in each table is a score between 1 and 4 with an average of 2.5.It's notable that the key internal and external factors were obtained by observing thecircumstances surrounding the company and also interviewing the employees of theCompany and board of directors and the Importance Coefficient and the Rating ofeach of these factors were obtained through interviews with the company'semployees.The internal factors evaluation matrix consists of four columns. In the first column,the internal factors (strengths and weaknesses) of the company are listed. In thesecond column, depending on the importance and sensitivity of each factor, theimportance coefficient is assigned between zero and one. The sum of thesecoefficients should be equal to 1. In the third column, depending on the regularity ofthe strengths, they rank 4 or 3, respectively, and 2 or 1 for the weaknesses. Score 1indicates a basic weakness, a score of 2 indicates of the weaknesses, a score of 3indicates a strong point, and a score of 4 indicates of the high strength.128
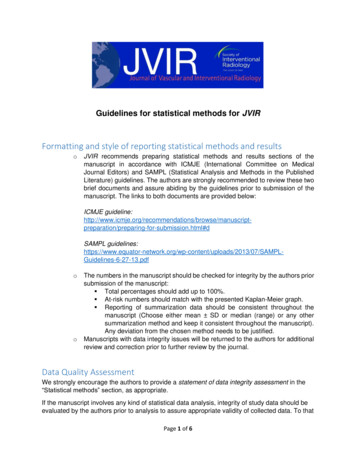
Journal of Accounting, Finance and Auditing Studies 7/3 (2021): 121-135Table 3. IFE Internal Factor Evaluation Matrix of Golden EagleWEAKNESSESSTRENGTHSGolden EagleCRITICAL SUCCES FACTORWEIGHTRatingWeighted ScoreCompany Image0.230.6Quality of products0.140.4Products safety0.140.4Work ethic0.120.2Marketing0.230.6Small range of AL1.002.5The data of the IFE internal factor evaluation matrix data as shown in table 3 formthe overall weighting of 2.5 points, it is worth mentioning that the Golden Eaglebrand makes good use of its strengths and possesses sufficient control over itsweaknesses. The score 2.5 is an average score thus the IFE internal factor ratingmatrix is positive for the Golden Eagle129
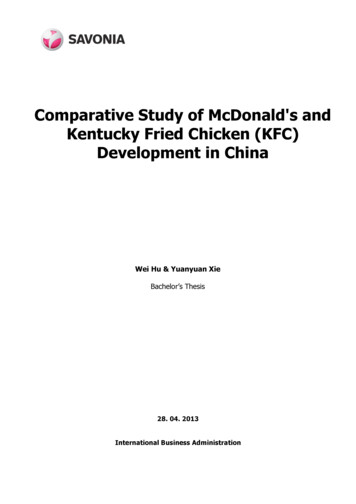
Journal of Accounting, Finance and Auditing Studies 7/3 (2021): 121-135Table 4. IFE Internal Factor Evaluation Matrix of Red BullWEAKNESSESSTRENGTHSRed BullCRITICAL SUCES FACTORWEIGHTRatingWeighted ScoreMarket dominance0.0840.32Rapid sales growth0.0830.24Intensive Marketing0.0730.21Global Presence0.0940.36The power of the brand0.0930.27The symbol of youth0.0630.18Supply chain0.0630.18Diversification0.0720.14Small range of products0.0720.14Unhealthy products0.0910.09Very expensive0.0930.27Difficult in patent protection0.0720.14Anti-brand campaigns0.0830.24TOTAL1.002.5The data of the IFE internal factor evaluation matrix as described in table 4 form theoverall weighting of 2.5 points, it is worth mentioning that the Red Bull brand makesgood use of its strengths and possesses sufficient control over its weaknesses. Theresult 2.5 is an average score, so the IFE internal factor rating matrix is positive forRed Bull.3.3.Efe MatrixThe external factors matrix also includes four columns. In the first column, externalfactors are listed in terms of opportunities and threats. Then, in the second column,considering the importance of each factor, by comparing these factors with eachother, the importance coefficient is assigned between zero and one to those factors.130
Journal of Accounting, Finance and Auditing Studies 7/3 (2021): 121-135The sum of these coefficients should be 1. In the third column, according to the key orthe regularity of the opportunities and threats, respectively, rank 4 or 3 foropportunities and rank 2 or 1 for threats respectively. Score 1 expresses basic threat,score 2 indicates a threat, Score 3 indicates the opportunity, and Score 4 indicates thehigh opportunity. In the fourth column, the coefficients of the second column and thethird column points for each factor are multiplied to determine the weighted score ofthat factor (opportunity or threat). If the total sum of the weighted score in thismatrix is more than 2.5, it means that the opportunities will overcome the threats,and if this score is less than 2.5, then the threats will overcome on the opportunities.Table 5. EFE External Factor Evaluation Matrix of Golden EagleGolden EagleCRITICAL SUCES ePenetration into new markets0.130.3Increasing the range of products0.0820.16Quality increase0.0930.27Image enhancement0.0940.36Opening of Branches0.0530.15Market segmentation0.130.3Competition0.130.3Government policies0.0930.27New market entrants0.130.3Anti-brand campaigns0.120.2Inflation0.130.3TOTAL1.002.91As it can be seen from the EFE matrix description in table 5 of the Golden Eagle brandthe overall weighting of points is 2.91 is above average, so in conclusion it turns out131
Journal of Accounting, Finance and Auditing Studies 7/3 (2021): 121-135that the brand is performing very well taking advantage of internal opportunities andavoiding external risks which can face the brand.Table 6. EFE External Factor Evaluation Matrix of Red BullRed bullCRITICAL SUCES eDevelopment of new markets0.130.3New product lines0.0930.27Improving the image0.0740.21Further product diversification0.130.3Social media marketing0.130.4Increase focus on CSR0.130.4Competition0.0930.27Government policies0.0830.24Health regulations0.140.4New market entrants0.0930.27Negative health implications0.0830.24TOTAL1.003.3As it can be seen from the data of the external evaluation matrix EFE described intable 6 the red bull brand with an overall weighting score of 3.3 is above averageusing to the maximum the external possibilities and minimizing the various riskswith which the brand may be faced.Conclusions and RecomandationsThis comparison case comprises theoretical and numerical data. Theoretical datawere analysed through the SWOT matrix, while numerical data were extracted usingIFE and EFE matrixes for both Golden Eagle and Red Bull. The SWOT analysis data forboth brands revealed that in addition to the advantages these two brands possess,132
Journal of Accounting, Finance and Auditing Studies 7/3 (2021): 121-135they also have weaknesses, opportunities and threats which can be avoided differenttypes of strategies (SO, WO, ST, WT) are used. In turn these strategies would helpthem to increase efficiency and maintain the position achieved in the energy drinksindustry, perceiving the aspirations of each brand.The data derived from the results of the IFE matrix showed the evaluation aspects ofinternal factors for both brands. In distinction to the data of the IFE matrix it appearsthat both Golden Eagle and Red Bull have the same total weighting of points 2.5. Theresult 2.5 is an average score, so the IFE internal factor rating matrix is positive forboth brands.The results obtained from the EFE matrix showed that the evaluation aspect ofexternal factors Golden Eagle and Red Bull differ from each other. The overallweighting of points from the EFE matrix for the Golden Eagle brand appears to be2.91 while for the Red Bull brand it is 3.3. The results 2.91 and 3.3 are above averagewhich means that two brands are utilizing to the maximum the external possibilitiesand minimizing the various risks that may be faced.Considering the results obtained, both companies reached a positive result ininternal factor analysis, while in external factor analysis, Red Bull company has ahigher average than Golden Eagle company. In fact, both companies are resistant toexternal risks or shocks, and we only look at the average of Red Bull company and ithas been observed that this company is more successful than Goldin Eagle. One of themain reasons for this result is that the Red Bull company is a much larger company interms of both the market share and the size of the company, according to GoldenEagle.Considering the importance of the findings obtained, the biggest disadvantage is thatboth brands are in the beverage sector, the market share of the Golden Eagel brandand the brand size is narrower than the Red Bull brand.Nobbs (2014) made a comparison between two brands and drew attention to theimportance of brand positioning, emphasizing that the competition and comparisonsbetween brands should be made according to the positions of the brands. A similarresearch was done by Roy et al., in (2011), in their research, a customer satisfaction133
Journal of Accounting, Finance and Auditing Studies 7/3 (2021): 121-135comparison was made between two Indian brands in India. In their efforts to makecomparisons between the two brands based on the results obtained, the researchersof the future emphasized that factors such as brand value or the quality of theirproducts in terms of brand unity should be taken into account with existing ones forcustomer satisfaction.In order to serve as an example for other researches, adding the customersatisfaction scale as an additional effect to the brand comparisons will provide moreaccurate results. When making comparisons between brands, it is necessary toconsider the market shares of the brands and the brand size.ReferencesBRICK, D. J., FITZISMONS, G.M., CHARTRAND T.L., & FITZSIMONS, G.J. (2018). Coke vs.Pepsi: Brand Compatibility, Relationship Power, and Life Satisfaction. Journalof Consumer, 991-1014. https://doi.org/10.1093/jcr/ucx079DE JORGEO MORENO, J., & CARRASCO, O. R. (2016). Efficiency, internationalizationand market positioning in textiles fast fashion The Inditex case. InternationalJournal of Retail & Distribution Management, 44(4), GANDHI, K. (2014). A Study on Brand Personality of Coca-Cola and Pepsi: AComparative Analysis in the Indian Market. International Journal ofConceptions on Management and Social Sciences, 2(2), 10-13. HAK, W.W., UGOCHUKWU, C., BAGOT, K. S., & KHALILI, D. (2012). Energy Drinks:Psychological Effects and Impact on Well-being and Quality of Life- ALiterature Review. Innovations in Clinical Neuroscience, 9(1). Available at:https://pubmed.ncbi.nlm.nih.gov/22347688LAL, B., & PANKAj. (2017). Customer Satisfaction towards Pepsi and Coca-Cola: AnExploratory Study of Jind City (Haryana). International Journal of Researchin Management, Economics and Commerce, 07(08), 33-39. Available at:http://indusedu.org/pdfs/IJRMEC/IJRMEC 1294 17040.pdfMUJTABA, B.G., & PATEL B. (2007). McDonald‟s Success Strategy and GlobalExpansion Through Customer and Brand Loyalty. Journal of Business CaseStudies, 3(3), 55-66. https://doi.org/10.19030/jbcs.v3i3.4857NOBBS, K., FOONG, K.M., & BAKER, J. (2015). An exploration of fashion visualmerchandising and its role as a brand positioning device. Journal of 0.1080/20932685.2014.971491134
Journal of Accounting, Finance and Auditing Studies 7/3 (2021): 121-135OPAIT, G. (2019). Statistical „Pole Position” Leadership between Lamborghini versusFerrari. Annals of “Dunarea de Jos” University of Galati Fascicle I. .org/10.35219/eai1584040917ROY, R., BHATTACHARYA, A.K., & SENGUPTA, P.P. (2011). A Comparative Study ofCustomer Satisfaction between Two Indian Retail Brands. Global BusinessReview, 331–342. A, M., SALEHI, M., HASHEMI, S.M., DARABKHANI, Y.D., & AHANIJAN, B.(2012). Operation Strategies for Coca-Cola Vs Pepsi Companies to AttractTheir Customers. Contemporary Marketing Review, 1(11), 1-15. TION STRATEGIES FOR COCACOLA VS PEPSI COMPANIES TO ATTRACT THEIR CUSTOMERS?auto downloadSERINGHAUS, F. H. R., & LAURIER, W. (2008). Comparison of Website Usage ofFrench and Italian Luxury Brands. Journal of Euromarketing.https://doi.org/10.1300/J037v14n04 02SINGARAM, R., RAMASUBRAMANI, A., MEHTA, A.M., & ARORA, P. (2019). Coca Cola: Astudy on the marketing strategies for millenniums focusing on India.International Journal of Advanced Research and Development, 4(1), wTAYLOR, M. (2000). Cultural Variance as a Challenge to Global Public Relations: ACase Study of the Coca-Cola Scare in Europe. Public Relations Review, 26(3),277–293. RNOO, H., & DZIGBEDE, K.D. (2017). Sustainability Practices of MultinationalEnterprises in Developing Countries: A Comparative Analysis of Coca-ColaCompany and PepsiCo Inc. Journal of Global Initiatives: Policy, f3ce
"Customer Satisfaction toward Pepsi and Coca-Cola," 52.9 percent of customers drink soft drinks on occasion, Pepsi is the most popular brand with 51 percent market share, and 85.4 percent of customers are pleased with their favorite brand. . SWOT Analysis Technique, and IFE / EFE matrix, all of which are qualitative research approaches, and a .