Transcription
5 March 2020Industry Indices - Marketand Financial PerformanceAEROSPACEDEFENSEGOVERNMENT SERVICESAIRLINESSPACE & SATCOM
Table of Contents4Full Index (162 public companies):Total Returns To Investors, 1-YearPerformance vs 3-Year Performance (CAGR)5Winners: Companies With High Returns Both 1-Year and 3-Year Periods6Challenged: Companies With NegativeReturns - Both 1-Year and 3-Year Periods7Valuation Trends: TEV:LTM EBITDA MultipleBy Sector Since January 20108Aerospace Index: Total Returns ToInvestors, 1-Year Performance vs 3-YearPerformance (CAGR)9Aerospace Sector Financial Performance:10 LTM Revenue, LTM EBITDA, EBITDA Margin2 of 3311 Aerospace Sector Valuation:12 TEV and TEV: LTM EBITDA Multiple13 Aerospace Sector Growth:14 LTM Revenue Growth and LTM EBITDAGrowth (%)15 Defense Index: Total Returns To Investors,1-Year Performance vs 3-Year Performance(CAGR)16 Defense Sector Financial Performance:17 LTM Revenue, LTM EBITDA, EBITDA Margin18 Defense Sector Valuation:19 TEV and TEV:LTM EBITDA Multiple20 Defense Sector Growth: LTM Revenue21 Growth and LTM EBITDA Growth (%)
Table of Contents222324Government Services Index: Total ReturnsTo Investors, 1-Year Performance vs 3-YearPerformance (CAGR)Government Services Sector FinancialPerformance: LTM Revenue, LTM EBITDA,EBITDA MarginGovernment Services Sector Valuation:TEV and TEV:LTM EBITDA Multiple28Airline Sector Valuation: TEV andTEV:LTM EBITDA Multiple29Airline Sector Growth: LTM RevenueGrowth and LTM EBITDA Growth (%)30Space / Satcom Index: Total ReturnsTo Investors, 1-Year Performance vs 3-YearPerformance (CAGR)31Space / Satcom Sector FinancialPerformance: LTM Revenue,LTM EBITDA, EBITDA Margin25Government Services Sector Growth:LTM Revenue Growth and LTM EBITDA Growth (%)26Airline Index: Total Returns To Investors, 1-YearPerformance vs 3-Year Performance (CAGR)32Space / Satcom Sector Valuation:TEV and TEV:LTM EBITDA Multiple27Airline Sector Financial Performance:LTM Revenue, LTM EBITDA, EBITDA Margin33Space / Satcom Sector Growth:LTM Revenue Growth and LTM EBITDAGrowth (%)3 of 33
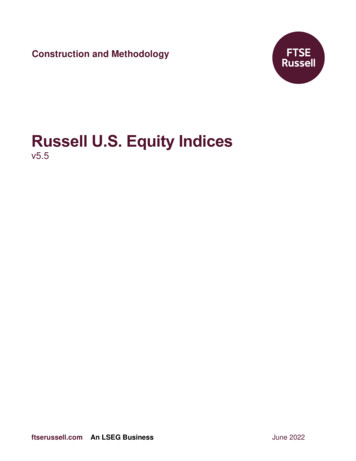
FAIRMONT Aerospace, Defense, Government Services Index1-Year vs 3-Year Total Return To Investors (% CAGR)Three-Year Total ReturnThree-Year Total ReturnFAIRMONT Aerospace, Defense, Government Services IndexFAIRMONTDefense,Services1-YearAerospace,vs 3-Year TotalReturnGovernmentTo Investors (%CAGR) Index1-Year vs 3-Year Total Return To Investors (% CAGR)140%150%120%AvioMarch 6, 202025 JANUARY 2020Avio100%100%80%EOS60%AxonTransDigmComtechAir CanadaHeico AxonAvonTeledyneTransDigmAerojet RocketdyneComtech Heico40%AeroVironmentButler NationalMTUTeledyneEOSAir CanadaIridiumOHBAvonVectrusBet ShemeshEngines Butler onment KratosLeidosCAE ManTechBallTetra Tech lHarrisSystemesAccentureMTUGarminLockheed Air France rummanRBC AirwaysAIRBUS COMDeltaAmphenolSercoBAEAirChinaFireEyeThalesBBA SercoChemringANASouthwestMeggittCurtiss-WrightST GeneralParkerH&K ffon nSAICIngallsTriumphMagellanUnisysATI bAmericanAviancaLatecoereGoGoAir raerAm OutdoorLIG Nex1GEFigeac AeroBabcockAm Outdoor CircorFluor-20%GlobalstarSIFCOAviancaBombardier AmericanGELIG Nex1Air IndustriesOrbcommFigeac AeroCPI AeroGlobalstarGoGo50%-100%-100%FluorGlobal EagleGlobal EagleIridiumOne-Year Total ReturnOne-Year Total 0%-80%-100%4 of 33Page 3 of 325 March 2020
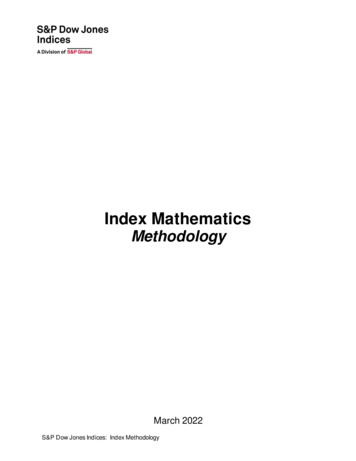
FAIRMONT - Big Winners - 50% 1-Year, 20% 3-Year1-Year vs 3-Year Total Return To Investors (% CAGR)FAIRMONT - Big Winners - 50% 1-Year, 20% 3-YearMarch 6, 20201-Year vs 3-Year Total Return To Investors (% CAGR)Three-Year Total Return55%50%Axon45%AvonTransDigmTeledyne40%Butler NationalEOSManTech35%VectrusLeidosTetra Tech30%25%INVISIOOne-Year Total Return20%5 of 3350%70%90%110%130%150%170%5 March 2020
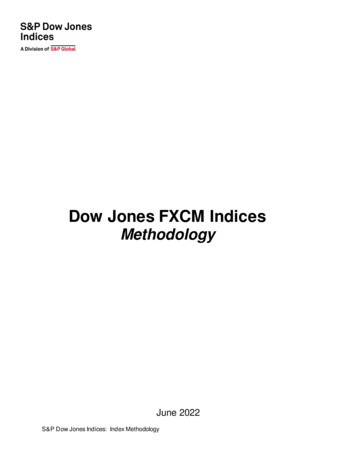
FAIRMONT - Challenged - Negative 1-Year, Negative 3-Year1-Year vs 3-Year Total Return To Investors (% CAGR)FAIRMONT - Challenged - Negative 1-Year, Negative 3-YearMarch 6, 20201-Year vs 3-Year Total Return To Investors (% CAGR)-100%-90%-80%-70%-60%-50%-40%ATIOne-Year Total Return-30%-20%Senior0%-10%0%TextronChina SouthernLoral-10%FedExLATAMAstronicsEmbraerAm Outdoor-20%BombardierAmericanCPI AeroFluorFigeac AeroLIG Nex1-30%Three-Year Total ReturnOrbcommGlobalstar-40%-50%Global Eagle-60%-70%6 of 335 March 2020
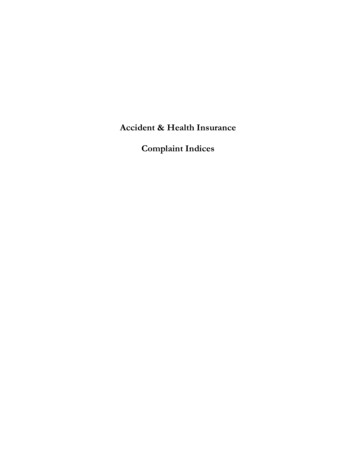
0.07 of 33AEROSPACEDEFENSEGOVERNMENT NT - Valuation Trends Since 2010TEV:LTM EBITDA By SectorFAIRMONT - Valuation Trends Since 2010TEV:LTM EBITDA By 5 March 2020
FAIRMONT - Aerospace Index1-Year vs 3-Year Total Return To Investors (% CAGR)FAIRMONT - Aerospace IndexMarch 6, 20201-Year vs 3-Year Total Return To Investors (% CAGR)Three-Year Total Return60%40%Safran20% AIRBUSBoeingTransDigmHeicoDassaultMTU SystemesRBC CAEBet Shemesh EnginesCTT l EatonAmphenolMeggitt Heroux-DevtekCurtiss-WrightST EngineeringUTCHexcelParkerFACCMoogPark AerospaceBarnes Smiths-100%-80%-60%-40% ATISpiritButler NationalDassault Aviation-20%Crane BBA20%40%60%One-Year Total mphCircor-20%SIFCOBombardierAir IndustriesFigeac AeroGECPI Aero-40%Global Eagle8 of 33-60%5 March 2020
9 of 33aneTriumphSmiths5%9%11% 3,053 60919% 3,076 296 3,283 582 4,123 434 4,509 1,39518% 4,770 232 5,194 974 5,695 2,49112% 5,850 6,629 8,27813% 760 578 993 7,863 8,22515% 1,055 1,952 14,20117% 2,53220%Cr3% 14,19223%ATI0% 15,757 21,968LTM EBITDA 2,075 28,351 21,39013% 3,735 5,666 36,70918% 4216% 14,056 40,000 8,592 4,432LTM RevenueMUTCHoneywellSaf ranEatoRonlls-RoyceBom - ioConnstelliuSTmEngineeringTransDigmUS 0 169 77,046 79,091 76,559 80,000TUDaEmssbrauaeltrSystemes- 20,000eing 20,000 11,932 95,214 100,000AIRBBoGEFAIRMONT - Aerospace Index Financials (1 of 2)LTM Revenue, LTM EBITDA, EBITDA Margin50%44%40%Margin31% 60,00030%24%18%20%10%-2%20%13%10%0%-10%5 March 2020
- 50010 of 33 872%20%21%-1% 38 623% 38 14LTM EBITDA 61 13LTM Revenue, LTM EBITDA, EBITDA Margin 66 1511% 101 11 11014% 151 198 1,471LTM Revenue 21 13 1512% 46615% 667% 491 655 721 724 773 773 811 87314% 64 12 205 185 93215% 116 836% 5410%11% 56 1,000 10712% 96417% 1,49118% 34222% 1,973 2,828 3,015 2,968 2,980FAIRMONT - Aerospace Index Financials (2 of 2) 54 3 0 294 2,488 2,356 2,261 2,09624% 560 567 528 406 2,000 566 675 1,500 495 2,500 130 154 500 372 3,000LISBa IrnesSeniorCircorAIDCFALa CCtecoAs e retronM icsagellanDu Rc o BCGl mmob unalFig EagH e e ac leroAux e ro-DevtekBeSAtSBChe So Am geesch la irEnginesSIFCBu CP O- 1Itle AerP a Na r oti orkAe nalrAi o sprIand ceCT ustrTiSy esstePT msBGroupMW oooo gdwaM rdeggittCAECurtiBBss-W ArighHe txcelHeicoFAIRMONT - Aerospace Index Financials (2 of 2)LTM Revenue, LTM EBITDA, EBITDA MarginMarch 6, 2020 15%11%7%10%6%5%5%0%-5%5 March 2020
FAIRMONT - Aerospace Index TEV (1 of 2)Total Enterprise Value, TEV:LTM EBITDA MultipleFAIRMONT - Aerospace Index TEV (1 of 2)March 6, 2020Total Enterprise Value, TEV:LTM EBITDA Multiple1200 160,5931054.8 176,788 180,000 178,259 200,000TEV1000TEV:LTM EBITDA 160,000800 128,500 140,000 120,000 91,655600 100,00040015.515.89.615.95.812.111.50 6,05714.7 6,85025.4 6,08027.3 7,848-35.6 20,00013.18.4 6,48613.3 8,95116.3 9,43932.1 11,17213.1 10,67718.3 15,28611.2 12,71820.7 17,33715.0 16,20311.4 33,79514.8 31,879 40,000200 44,824 45,484 60,000 48,868 63,420 80,000 011 of emesAmphenolParkerRolls-RoyceArconicGEUH o TCneywellAIRBUSSafranTransDigmBoeing-2005 March 2020
12 of 334.85.8 659.5 6322.9 68Total Enterprise Value, TEV:LTM EBITDA Multiple 83 4,242 4,073FAIRMONT - Aerospace Index TEV (2 of 2) 679.4 146 120 3,243 3,661 3,652 4,941TEV 1468.0 2699.2 4689.7 587 5619.9 846 1,777 1,9969.5 660 7996.89.9 7597.5 2,368 3,000 3044.0 7928.49.0 1,0729.8 1,28910.7 2,08012.2LISIAIDCCircorSenAs io rtronicsFGlAoCH e ba l Cro Eaux g le-DD u evtco e kmmM unagFig e lle a anBecAtSeLhe at rom e coesh e reECT nginTPa Sy esstrkAe e mro sspaSo cegeclaiSA rBCBu CPI Atle Aer N roAi ati orInd nalusPT tr iesBGroupSIFCObraTr eriumphEm7.0ATIoogC 1,000 4,002 4,000M 2,000 4,883 5,000RBCranDaessault BBAAviatioBa nCo rnns e stelliumFAIRMONT - Aerospace Index TEV (2 of 2)Total Enterprise Value, TEV:LTM EBITDA MultipleMarch6, 202025JANUARY2020 6,00030TEV:LTM 45 005 March 2020
FAIRMONT - Aerospace Index - Revenue & EBITDA Growth (1 of 2)LTM Revenue Growth and LTM EBITDA Growth (%)FAIRMONT - Aerospace Index - Revenue & EBITDA Growth (1 of 2)March 6, 2020LTM Revenue Growth and LTM EBITDA Growth (%)100%LTM Rev GrLTM EBITDA %28%24%16%36%32% 15%13%17%4%-20%13 of nAerospaceTransDigm0%0%UTC6%CAE1%-16%-18%5 March 2020
FAIRMONT - Aerospace Index - Revenue & EBITDA Growth (2 of 2)LTM Revenue Growth and LTM EBITDA Growth (%)FAIRMONT - Aerospace Index - Revenue & EBITDA Growth (2 of 2)March6, 202025JANUARY2020LTM Revenue Growth and LTM EBITDA Growth (%)20%38%17%LTM Rev Gr15%30%LTM EBITDA %4%2%-5%4%1%0%0%1%-2%LISW IrightFRo ACClls-RoyceAIDAr CconicRBCCraneBGl arnobeal sEagleEatonSIFAs COtroAm nicsphenoPa lrBokm erbardiTr eriumphBoH o einne gywelSA Fig RBUeSST acEn Aegin roeerinM geggittHexcelSeniorSpM iritagellanSmithsCo Moonsgtellium-1%3%1%3%0%3%3%7% 4 of 335 March 2020
FAIRMONT - Defense Index1-Year vs 3-Year Total Return To Investors (% CAGR)FAIRMONT - Defense IndexMarch 6, 20201-Year vs 3-Year Total Return To Investors (% CAGR)Three-Year Total Return50%Avon40%TeledyneComtechAerojet OAustal20%Lockheed MartinCohortNorthrop shkoshRugerCubicNational Presto0%-30%-10%QinetiQRaytheonKongsbergElbit SystemsLtd.ECABWXAARBAEHuntington IngallsOne-Year Total ring30%50%70%90%110%130%Griffon (Telephonics)SaabVSE-10%LeonardoAm Outdoor-20%-30%15 of 335 March 2020
16 of 33 1,669 46 1,887 41719%Nex1 0LTM EBITDALIG 50,000 1,895 377LTM Revenue, LTM EBITDA, EBITDA MarginFLIRFAIRMONT - Defense Index Financials (1 of 2) 762 104LTM Revenue 1,982 287 2,195 1698%Aerojet KamanBWXAAR 2,739 217 59,81227% 2,247 208 39,35019% 3,164 615 3,79310% 381 4,265 6,49611% 441 384 6,845 7,88710% 755 2,122 8,27411% 856 8,899 18,52612% 982 3,558 11,47416% 1,854 13,63012% 1,576 20,000 14,32112% 1,685 20,65013% 2,467 24,243 29,17612% 3,063 30,000 4,66914% 33,84115% 3,987 5,493 40,000BallHuntHainrrigtsonIngallOs shkoshMotoroRhein lameFin tallElbcaitSy ntieristemsLtd.SaabTeledyneGriffKo on ngsberg 10,000 8,776 ynamiNo csrthrop RaytheonLoFAIRMONT - Defense Index Financials (1 of 2)LTM Revenue, LTM EBITDA, EBITDA MarginMarch 6, 2020 %5%3%0%5 March 2020
FAIRMONT - Defense Index Financials (2 of 2)LTM Revenue, LTM EBITDA, EBITDA MarginFAIRMONT - Defense Index Financials (2 of 2)25MarchJANUARY6, 20202020LTM Revenue, LTM EBITDA, EBITDA Margin 1,80030%25% 1,433 1,600 1,52027%21% 1,20019%20%18% 1,202 1,209 1,40017%15%9%7%LTM Reven ueLTM EBITDA10%Margin 6165% 531 600 411 4331% 55 15 18 117-5%-10%INVISIOEOS 129 12ECAhort 47CoAvon 23H&K 28 183 221 265 299 51 45 23 69RugerFrequAeenroti ryCoercuM- 113Kratos-13%FireEyeUltraQinetiQOSIAustalCubic 0VSE 7 78 84 82 134 65 86 156 208 156 100 132 200 3200% 335 40017 of 339%9% 679 718 7387% 80012%12% 7239%15%14%14% 889 1,00016%15% 1,02113%- 20017%17%-15%5 March 2020
18 of 33ckhe14.2 3,169TEV 3,106FAIRMONT - Defense Index TEV (1 of 2) 3,128Total Enterprise Value, TEV:LTM EBITDA Multiple 3,843 120,000 4,468 4,461 3,720 3,97310.5H&KAxonAeMroerjetcRo urycketdyFin necantieriFireEyeKongsberg6.9 4,7546.4 5,895 5,946 5,9207.8SaabBWXOshkosRhein hmetall 7,443 10,78210.5 10,358 12,255 31,92114.9 53,10117.2FLIR 20,000 14,1899.1 25,97112.3 lsElb LeonitarSyste domsLtd.11.2 57,480 60,000 35,87917.9 61,513 71,368 80,000Ball 40,000 125,636 140,000BAEedrthr o MarptiGe Gru nmnemraanlDynamiRa c sytheonHarrisMotorolaNoLoFAIRMONT - Defense Index TEV (1 of 2)Total Enterprise Value, TEV:LTM EBITDA MultipleMarch6, 202025JANUARY202040TEV:LTM EBITDA33.335 100,0003023.1252016.915.813.414.68.1 01510.4106.3505 March 2020
FAIRMONT - Defense Index TEV (2 of 2)Total Enterprise Value, TEV:LTM EBITDA MultipleFAIRMONT - Defense Index TEV (2 of 2)March6, 202025JANUARY2020Total Enterprise Value, TEV:LTM EBITDA Multiple30 2,231TEV26.22523.5 1,808 2,000TEV:LTM EBITDA25.2 2,021 2,011 2,059 2,349 2,50021.9 1,56321.517.810.6 73310.99.6 5937.0 256 345 500 462 4817.3109.1 2809.2 7239.710.5 605 86510.712.5 80812.7 1,00811.6 1,00015 1,01413.2 99413.2 1,125 1,373 inetiQCuUltra0bic 0519 of 335 March 2020
FAIRMONT - Defense Index - Revenue & EBITDA Growth (1 of 2)LTM Revenue Growth and LTM EBITDA Growth (%)FAIRMONT - Defense Index - Revenue & EBITDA Growth (1 of 2)March 6, 2020LTM Revenue Growth and LTM EBITDA Growth (%)100%LTM Rev Gr91%LTM EBITDA Gr80%67%60%40%34%67%28%26%26%51%47%21%-20%20 of bic0%0%HarKo ffo20%5 March 2020
FAIRMONT - Defense Index - Revenue & EBITDA Growth (2 of 2)LTM Revenue Growth and LTM EBITDA Growth (%)FAIRMONT - Defense Index - Revenue & EBITDA Growth (2 of 2)March6, 202025JANUARY2020LTM Revenue Growth and LTM EBITDA Growth (%)140%LTM Rev GrLTM EBITDA 2%Avon9%-25%-15%-31%-17%-59%-40%-60%21 of 335 March 2020
FAIRMONT - Government Services Index1-Year vs 3-Year Total Return To Investors (% CAGR)FAIRMONT - Government Services IndexMarch 6, 20201-Year vs 3-Year Total Return To Investors (% CAGR)Three-Year Total mus-80%-60%-40%-20%0%0%Parsons Unisys20%AECOMSAICPerspecta40%One-Year Total Return60%80%100%IBM-10%Babcock-20%-30%22 of 335 March 2020
FAIRMONT - Government Services Index FinancialsLTM Revenue, LTM EBITDA, EBITDA MarginFAIRMONT - Government Services Index FinancialsMarch 6, 2020LTM Revenue, LTM EBITDA, EBITDA Margin 45,00020% 43,968 50,00017%LTM RevenueLTM EBITDA18%Margin16% 40,00016% 35,00014%13%12%12% 30,00012%10%10% 25,00010%9%8%8%7%23 of 334% 1,383 59 1,479 131 2,223 195 2,450 242 3,040 408 2,949 4,302 297 3,846 185 562 505 4,499 5,398 5,430 669 378 510 5,639 6,031 7,2744% 728 7,7314% 304 1,1336%2%0%sVectruICFsaximusTetr KBRSAIChtBoozAllenCGI- 119JacobsLeidosInsig- 5,0008%7%-1%FluorAccentureAECOM 0 977 949 5,0009%5% 9,408 7,0695% 1,645 15,000 11,094 13,0147% 209 18,520 20,053 20,000 10,00010%9%-2%5 March 2020
FAIRMONT - Government Services Index TEVTotal Enterprise Value, TEV:LTM EBITDA MultipleFAIRMONT - Government Services Index TEVMarch6, 202025JANUARY2020Total Enterprise Value, TEV:LTM EBITDA Multiple 140,00025 117,92823.4 120,000TEVTEV:LTM EBITDA21.82018.1 100,00017.216.716.816.515.31514.313.9 80,00013.112.412.212.010.6 60,00011.010.610.3108.0 40,000 649 1,124 1,868 3,141 1,654 3,121 3,528 4,324 4,339 4,549 5,288 5,364 7,104 6,832 8,457 11,777 12,5435 14,955 20,000 18,739 nsManTechIns ightBabcockTetraTechSAICCAPe CIrspectasJacobsBoozAllenAECOMLeidoAccent24 of 33CGI0ure 05 March 2020
FAIRMONT - Government Services Index - Revenue & EBITDA GrowthLTM Revenue Growth and LTM EBITDA Growth (%)FAIRMONT - Government Services Index - Revenue & EBITDA GrowthMarch 6, 2020LTM Revenue Growth and LTM EBITDA Growth (%)50%LTM Rev GrLTM EBITDA %-21%-20%25 of 335 March 2020
FAIRMONT - Airline Index1-Year vs 3-Year Total Return To Investors (% CAGR)FAIRMONT - Airline IndexMarch 6, 20201-Year vs 3-Year Total Return To Investors (% CAGR)Three-Year Total Return50%40%Air Canada30%20%10%Air ChinaDelta-60%-50%LufthansaAir France KLM-40%-30%AirAsiaANA-20%British AirwaysUPSFedEx0%Singapore 0%One-Year Total Return10%20%0%CopaJetBlue-10%China Eastern-20%26 of 335 March 2020
27 of 33rancLMainaEasternhinapa 2,707 7189% 2,934 236LTM EBITDACoAirAsiaFAIRMONT - Airline Index Financials 4,621LTM Revenue, LTM EBITDA, EBITDA Margin 402 8,09417% 1,287 9,62121% 2,071 69,189 74,094LTM RevenueAviancaRyanairJetBlue 10,43121% 2,212 12,54318% 2,268 14,750 16,851 19,162 19,06615% 2,125 3,282 4,038 2,805 45,768 60,000AirCSinangaadpoareAirlinesLATAMChAirC6%ANA 21,181 22,428 40,04319% 47,007 43,25916% 3,497 3,99010% 28,623 30,51211% 4,616 3,046 4,485 6%BritishAirFLu 6,207 40,000Unican 20,000 8,913 50,000Amer 30,000 4,456 70,000Delta 10,000 7,896 80,000FedExUPSFAIRMONT - Airline Index FinancialsLTM Revenue, LTM EBITDA, EBITDA MarginMarch 6, 202030%Margin27%25%22%19%18%20%16%14%14%15%8%10%5% 00%5 March 2020
FAIRMONT - Airline Index TEVTotal Enterprise Value, TEV:LTM EBITDA MultipleFAIRMONT - Airline Index TEVMarch6, 202025JANUARY2020Total Enterprise Value, TEV:LTM EBITDA Multiple 120,00020 104,714TEVTEV:LTM EBITDA18 100,0001615.01413.312.4 66,805 80,0001210.910.710.2 60,000105.75.74.464.8 2,920 4,121 4,3654 9,337 11,037 12,822 12,1983.62.9 13,037 16,358 14,609 20,0005.54.2 19,1944.55.8 6,2096.1 24,2075.2 33,426 34,1096.0 30,252 40,00087.1 37,397 37,513 46,0208.428 of nSouthernDeltaFedEx0UPS 025 March 2020
FAIRMONT - Airline Index - Revenue & EBITDA GrowthLTM Revenue Growth and LTM EBITDA Growth (%)FAIRMONT - Airline Index - Revenue & EBITDA GrowthMarch 6, 2020LTM Revenue Growth and LTM EBITDA Growth (%)60%LTM Rev GrLTM EBITDA %29 of 335 March 2020
FAIRMONT - Space Index1-Year vs 3-Year Total Return To Investors (% CAGR)FAIRMONT - Space IndexMarch 6, 20201-Year vs 3-Year Total Return To Investors (% CAGR)Three-Year Total ntelsat-50%0%ViaSatLoralGarminGilatOne-Year Total lobalstarGoGo-40%-60%30 of 335 March 2020
FAIRMONT - Space Index FinancialsLTM Revenue, LTM EBITDA, EBITDA MarginFAIRMONT - Space Index FinancialsMarch 6, 2020LTM Revenue, LTM EBITDA, EBITDA Margin80% 3,758 4,00070%70% 3,500LTM RevenueLTM EBITDAMargin60% 3,00055%50% 2,00040% 1,666 1,886 2,061 2,275 2,50029% 1,43528%23%22% 1,112 1,052 1,50030%14%19%17%20%14% 832 1,0009%10%31 of 33GarminViaSatEchostarIntel satMAXAR 488OHBGoGoIridiumAvioGilatKVH 132 30 158 263Orbcomm-6% 37 52 44 272 3080%Globalstar 0 0 142 68 315 500 369 540 5606%Loral0%-10%5 March 2020
FAIRMONT - Space Index TEVTotal Enterprise Value, TEV:LTM EBITDA MultipleFAIRMONT - Space Index TEVMarch6, 202025JANUARY2020Total Enterprise Value, TEV:LTM EBITDA Multiple45 16,472 18,000TEVTEV:LTM EBITDA40.240 14,457 16,000 14,00035 12,00030 10,00025 6,00013.7 4,22015.717.2 5,2802017.3 5,444 8,0001512.7 4,000 3,63411.410.19.08.9108.632 of io 137 717Globalstar 923GoGo 379Intel sat 463Garmin5 465 0 1,193 2,000 1,2786.7KVH05 March 2020
FAIRMONT - Space Index - Revenue & EBITDA GrowthLTM Revenue Growth and LTM EBITDA Growth (%)FAIRMONT - Space Index - Revenue & EBITDA GrowthMarch 6, 2020LTM Revenue Growth and LTM EBITDA Growth (%)100%LTM Rev GrLTM EBITDA Gr80%60%102%40%20%44%17%38%32%12%7% %21%8%OHBGlobalstar6%0% 0%LoralIntel sat-5% 0%33 of 335 March 2020
CONTACT US AT:info@FairmontCG.com 1-857-265-3400www.fairmontcg.com
Iridium MAXAR Echostar GoGo Globalstar OHB Loral Orbcomm Gilat Avio KVH-100%-50% 0% 50% 100% 150%-100% -50% 0% 50% 100% 150% 200% 250% 300% FAIRMONT Aerospace, Defense, Government Services Index 1-Year vs 3-Year Total Return To Investors (% CAGR) One-Year Total Return Three-Year Total Return 25 JANUARY 2020 Boeing GE UTC Honeywell AIRBUS