Transcription
ASCENDAS REITInvestor PresentationMay 2021
Disclaimers This presentation may contain forward-looking statements. Actual future performance, outcomes and results may differ materially fromthose expressed in forward-looking statements as a result of a number of risks, uncertainties and assumptions. Representative examplesof these factors include (without limitation) general industry and economic conditions, interest rate trends, cost of capital and capitalavailability, availability of real estate properties, competition from other developments or companies, shifts in customer demands, shifts inexpected levels of occupancy rate, property rental income, charge out collections, changes in operating expenses (includingemployee wages, benefits and training, property operating expenses), governmental and public policy changes and the continuedavailability of financing in the amounts and the terms necessary to support future business. You are cautioned not to place undue reliance on these forward-looking statements, which are based on the current view ofmanagement regarding future events. No representation or warranty express or implied is made as to, and no reliance should beplaced on, the fairness, accuracy, completeness or correctness of the information or opinions contained in this presentation. NeitherAscendas Funds Management (S) Ltd (“Manager”) nor any of its affiliates, advisers or representatives shall have any liability whatsoever(in negligence or otherwise) for any loss howsoever arising, whether directly or indirectly, from any use of, reliance on or distribution of thispresentation or its contents or otherwise arising in connection with this presentation. The past performance of Ascendas Reit is not indicative of future performance. The listing of the units in the Ascendas Reit (“Units”) onthe Singapore Exchange Securities Trading Limited (the “SGX-ST”) does not guarantee a liquid market for the Units. The value of the Unitsand the income derived from them may fall as well as rise. Units are not obligations of, deposits in, or guaranteed by, the Manager. Aninvestment in the Units is subject to investment risks, including the possible loss of the principal amount invested. Investors have no right torequest that the Manager redeem or purchase their Units while the Units are listed on the SGX-ST. It is intended that holders of Units mayonly deal in their Units through trading on the SGX-ST. This presentation is for information only and does not constitute an invitation or offer to acquire, purchase or subscribe for the Units.2
AgendaOverview of Ascendas Reit41Q FY2021 Key Highlights15Investment Management17Proposed Acquisition of remaining 75% interest in Galaxis22Capital Management28Asset Management32Market Outlook41Sustainability443
Overview ofAscendas ReitONE@Changi City, Singapore
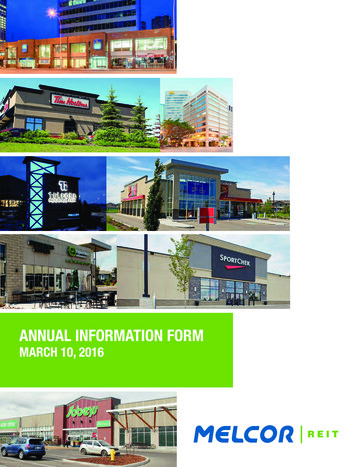
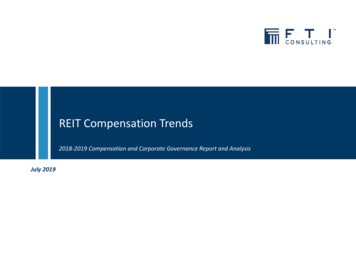
IndustrialAve: S 4.5bSource: Bloomberg2,6513,1873,3503,635Ascendas India TrustESR REITKeppel DC REITCromwell European ReitCommercialRetailAve: S 6.3bAve: S 3.7b4,310CapitaLand China TrustHospitalityAve: S 3.0b2,5812,854Far East Hospitality TrustCDL Hospitality TrustParkway LifeFirst REIT2,0671,0056,1822,361Frasers Hospitality TrustAscott Residence Trust973ARA US Hospitality Trust8,8814,281SPH REITMapletree Commercial Trust3,121Starhill Global REIT8,2552,509Dasin Retail TrustMapletree North Asia CommercialTrust1,858Sassuer REIT6,6501,637LippoMalls Indo REITFrasers Centrepoint Trust1,578995BHG Retail REIT22,41611,227Lendlease Global Commercial REIT833United Hampshire US ReitCapitaLand IntegratedCommercial TrustSuntec REIT7,7642,759Manulife US REITKeppel REIT1,912Prime US REIT6,7661,806Keppel KBS US ReitOUE Commercial REIT1,24258915,12310,548IREIT GlobalElite Commercial ReitAscendas REITMapletree Logistics Trust6,7351,824AIMS AMP Capital REITFrasers Logistics & Commercial Trust1,816EC World REIT6,1681,412ARA Logos Logistics TrustMapletree Industrial1,345931Soilbuild Business Space REITSabana REIT25,00020,00015,00010,0005,0000S mLargest Singapore Industrial REIT First and largest business space and industrial REIT listed on the Singapore Exchange Largest Singapore Industrial Reit by AUM and Market Capitalisation A constituent of many indices such as MSCI, FTSE, EPRA/NAREIT, Straits Times IndexTotal Assets Under Management (As at 31 December 2020)Healthcare & OthersAve: S 1.5b5
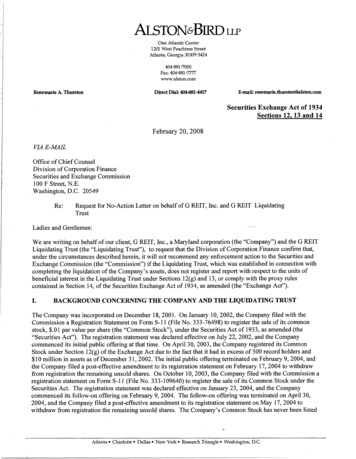
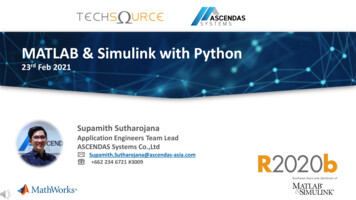
Largest Singapore Industrial REIT Ascendas Reit’s business space and industrial properties are located across 4developed markets – Singapore, Australia, the United States (US) and theUnited Kingdom (UK)/EuropeUnited Kingdom /EuropeInvestment Properties S 15 bMarket CapitalisationUnited States S 12 bSingaporeAustraliaAs at 31 March 20216
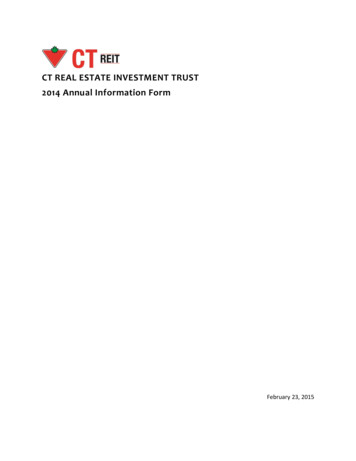
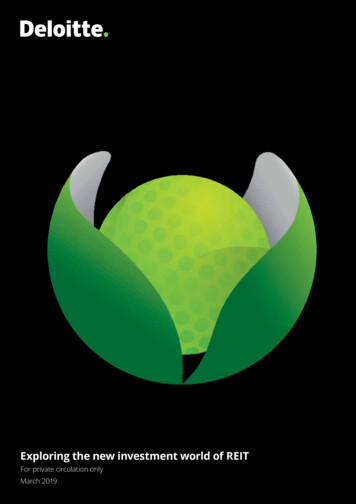
Achieved Steady Growth since IPOInvestment Properties and Distributions per Unit (DPU) has grown via Third party acquisitions: 51% Acquisitions from Sponsor: 38% Developments: 11%Investment Properties (S b)Distribution per Unit (cents)15.114.68812.98.0500.631 DEC 200331 DEC 20203 1 M AR 2 0 2 12003(J AN - D E C)FY 20207
Diversified PortfolioBy Value of Investment Properties As at 31 Mar 2021, total investment properties stood atS 15.1 b (209 properties(1)) Diversified geographically: Singapore portfolio: S 9.0 b Australia portfolio: S 2.2 b United States portfolio: S 2.1 b United Kingdom/Europe portfolio: S 1.8 bAustralia,15%Singapore,60%Total InvestmentProperties(5) S 15.1 bUnitedStates, 14%UnitedKingdom/Europe,11% Diversified by asset class:(1)(2)(3)(4) Business Space(2): 46% Logistics & Distribution Centre(3): 23% Industrial(4): 21% Data Centre: 10%Excludes 3 properties in Singapore which are under redevelopmentBusiness Space includes business & science park properties/offices (Singapore 27%, US 14%), suburban offices (Australia 5%)Comprises logistics properties in Singapore (8%), Australia (10%) and UK (5%).Comprises high specifications industrial properties (10%), light industrial properties & flatted factories (6%) and integrated development,amenities & retail (5%) in Singapore(5) Multi-tenant buildings account for 67.9% of Ascendas Reit’s total investment properties (by asset value) as at 31 Mar 2021.Business(2)Space, 46%Logistics, 23%(3)Total InvestmentProperties(5) S 15.1 bIndustrial , 21%(4)Data Centre,10%8
Singapore: 96 propertiesWidest variety of industrialpropertiesProperties are well-located along majorexpressways, airport, seaport and proximity toMRT stationsIntegratedDevelopment,Light industrial Amenities &Logistics &and apore13%HighSpecificationsIndustrial andData Centres23%InvestmentPropertiesS 9.0bBusiness & ScienceParks46%as at 31 Mar 2021Business & Science Parks (859,173 sqm)Integrated Development, Amenities & Retail (157,300 sqm)High-Specifications Industrial and Data Centres (676,916 sqm)Light Industrial and Flatted Factories (495,988 sqm)Logistics & Distribution Centres Singapore (811,916 sqm)9
Australia: 37 properties(32 logistics, 5 suburban offices)Breakdown by CityMelbourne26%Brisbane24%InvestmentPropertiesS 2.2bLocated in 4 key cities: Sydney, Melbourne,Brisbane and PerthBrisbanePerth2%PerthLogistics20,895 sqm1 propertyLogisticsSuburban Office206,825 sqm9 properties2 PropertiesSydney48%QueenslandBreakdown by Asset ClassWestern AustraliaSuburbanOffice35%InvestmentPropertiesS 2.2bLogistics65%As at 31 Mar 2021New SouthWalesMelbourneLogistics338,849 sqmVictoria12 propertiesSuburban Office 1 propertySydneyLogisticsSuburban Office300,816 sqm10 properties2 properties10
United Kingdom/Europe: 49 properties(38 logistics, 11 data centres)Breakdown by Geography38 Logistics3 Data Centres509,908 sqm29,189 sqmFranceThe11% NetherlandsSwitzerland14%2%3 Data CentresInvestmentPropertiesS 1.8b22,006 sqmUnited Kingdom73%Breakdown by Asset ClassLogistics54%1 Data CentreInvestmentPropertiesS 1.8b3 Data Centres6,114 sqm18,380 sqmData Centre46%As at 31 Mar 202111
United States: 30 Business Park PropertiesPortland, OregonBreakdown by CityBusiness Park106,506 sqm15 propertiesSan Francisco37%San Diego29%InvestmentPropertiesS 2.1bSan Francisco, CaliforniaOffice44,006 sqm2 propertiesRaleigh20%Portland14%Raleigh, North Carolina 110,093 sqmBusiness ParkSan Diego, CaliforniaAs at 31 Mar 2021Business Park5 properties96,460 sqm8 properties12
Customers’ Industry Diversification(By Monthly Rental Income) Diversified customer base across more than 20 industriesMore than20 industries13
Quality and Diversified Customer Base Total customer base of more than 1,460 tenants Top 10 customers (as at 31 Mar 2021) account for about 19.3% of monthly portfolio gross revenue* On a portfolio basis, weighted average security deposit is about 4.8 months of rental income.geographical location(s) of property14
1Q FY2021Key HighlightsThe Capricorn, Singapore
1Q FY2021 Key HighlightsInvestment Management Acquired 11 data centres across 5 key European cities for S 904.6 m Completed the acquisition of a suburban office at 1-5 Thomas Holt Drive,Sydney, Australia, for S 284.0 mCapital ManagementHealthy AggregateLeverage38.0%31 Dec 2020: 32.8%Asset ManagementHigh Level ofNatural Hedge 70%31 Dec 2020: 60%PortfolioOccupancyPortfolioRental Reversion#90.6%3.0%31 Dec 2020: 91.7%4Q FY2020: 2.5%# Percentage change of the average gross rent over the lease period of the renewed leases against the preceding average gross rent from lease start date. Takes into account renewed16leases in multi-tenant buildings that were signed in 3Q FY2020 and average gross rents are weighted by area renewed.
InvestmentManagementCroydon, London, United Kingdom
Investment Highlights: Acquisitions Completed S 1,188.6 m worth of acquisitions in 1Q FY2021An additional S 251.2 m worth of investments under development were secured and expected to completewithin the next two years1Q FY2021City/CountrySub-segmentCompleted Acquisitions1-5 Thomas Holt Drive,Macquarie Park11 Data Centres in EuropePurchase Consideration /Land & Development Cost (S m)CompletionDate1,188.6Sydney, AustraliaAcross 5 cities(2),UK & EuropeSuburban Office284.0(1)13 Jan 2021Data Centre904.6(3)17 Mar 2021Acquisitions (under development)251.2Lot 7, Kiora Crescent, YennoraSydney, AustraliaLogistics500 Green Road, CrestmeadBrisbane, AustraliaLogistics69.1(1)4Q 2021 (est.)MQX4, Macquarie ParkSydney, AustraliaSuburban Office161.0(5)Mid 2022 (est.)TOTAL :21.1(4)3Q 2021 (est.)1,439.8(1) Based on exchange rate of A 1.000: S 0.9830 as at 30 Sep 2020(2) Cities include: London & Manchester (UK), Amsterdam (Netherlands), Paris (France), Geneva (Switzerland)(3) Comprising approximately 250.25 m for the data centres located in the UK and approximately 276.85 m for the data centres located in the Netherlands, France and Switzerland. Illustrative exchange rates of 1.0000: S 1.8395 and 1.0000: S 1.6047(4) Based on exchange rate of A 1.00: S 0.89957 as at 31 May 2020(5) Based on exchange rate of A 1.000: S 0.9628 as at 31 Jul 202018
Acquisition (Completed):1 – 5 Thomas Holt Drive, Macquarie Park, Sydney, AustraliaPurchase Consideration(1)(2)Fee(3),S 284.0 m (A 288.9 m)AcquisitionStamp Duty andOther Transaction CostsS 19.3 m (A 19.6 m)Total Acquisition CostS 303.3 m (A 308.5 m)VendorAMP CapitalValuation (as at 1 December 2020) (4)S 284.0 m (A 288.9 m)Land TenureFreeholdNet Lettable Area39,188 sqmOccupancy Rate (as at acquisition)100%(5) (physical occupancy: 93%)Weighted Average Lease to Expiry(as at acquisition)4.5 yearsKey tenantsMetcash, FoxtelInitial Net Property Income (NPI) Yield5.9% (5.6% post-transaction cost)Completion Date13 Jan 2021(1)(2)(3)(4)(5)3 THD1 THD5 THDAerial view of 1 – 5 Thomas Holt DriveThe Property: The good quality office blocks sit on freehold land and areequipped with tenant-friendly amenities such as a café,two tennis courts, a swimming pool, BBQ area and a totalof 1,107 carpark spaces. 1 & 3 THD each have 5-Star NABERS energy rating.Location: Well connected via multiple transport nodes and home toglobal players across resilient industries such as thepharmaceutical, technology, electronics andtelecommunications sectors. Well located within Macquarie park and approx. 250mfrom MQX4, a suburban office building owned byAscendas Reit which is currently under development.All S amounts are based on exchange rate of A 1.000: S 0.983 as at 30 Sep 2020.Includes a two-year rental guarantee provided by the Vendor for vacant space.In accordance to Ascendas Reit’s Trust Deed, the Manager is entitled to an acquisition fee of 1.0% of the Purchase Consideration, which will be paid in cash.The valuation dated 1 Dec 2020 was commissioned by the Manager and Perpetual Corporate Trust Limited (in its capacity as trustee of Ascendas REIT Australia) and was carried out by Jones Lang LaSalle Advisory ServicesPty Limited using the capitalisation and discounted cash flow methods.Includes two-year rental guarantee provided by the Vendor for vacant space.19
Acquisition (Completed):11 Data Centres in EuropeTotal Consideration(1)S 904.6 m4 data centres in UK: 250.25 m7 data centres in Netherlands/France/Switzerland: 276.85 mAcquisition Fee (2), Stamp Dutyand Other Transaction CostsS 55.4 mTotal Acquisition CostS 960.0 mVendorSubsidiaries of Digital Realty Trust, Inc.Valuation (3)S 905.0 m4 data centres in UK: 250.25 m7 data centres in Netherlands/France/Switzerland: 277.10 mLand Tenure (as at 31 Dec2020)6 data centres: freehold5 data centres(4): leasehold with weighted average landlease expiry of 42.9 yearsThe Data Centres: Comprises 8 triple net powered shell data centres and 3colocation data centresNet lettable area61,637 sqmOccupancy Rate (as atacquisition97.9%Weighted Average Lease toExpiry (as at 31 Dec 2020)4.6 years (4.2 years to break)Location: 93% of Target Portfolio (by asset value) are strategicallylocated in London (UK), Amsterdam (Netherlands) andParis (France), which are top data centre markets inEurope. The remaining 7% are located in Manchester (UK)and Geneva (Switzerland)Key TenantsHSBC Bank, Entserv UK, Bouygues TelecomInitial NPI Yield6.0% (5.7% post-transaction cost)Completion Date17 Mar 2021London AmsterdamParisGeneva(1) Illustrative exchange rates of 1.0000: S 1.8395 and 1.0000: S 1.6047 have been used for conversions from Pounds Sterling and Euro amounts into Singapore Dollar respectively.(2) In accordance with Ascendas Reit’s Trust Deed, the Manager is entitled to receive an acquisition fee of 1.0% of the Total Consideration, which will be paid by cash.(3) The valuations dated October 2020/February 2021, were commissioned by HSBC Institutional Trust Services (Singapore) Limited (in its capacity as trustee of Ascendas Reit), and were carried out by Newmark KnightFrank Valuation & Advisory, LLC, using the using the sales comparison and income capitalisation approaches. Please refer to the announcement titled “Proposed Acquisition of a Portfolio of 11 Data Centres in20Europe” dated 17 March 2021 for the exact dates of the valuations.(4) Includes two data centres on perpetual leasehold basis.
Divestment (Newly Completed in 2Q 2021):11 Changi North Way, SingaporeSales Price(1)S 16.0 mBuyerHafary Pte LtdBook Value/Valuation(2) (as at 31 Dec 2020) S 15.0 mAcquisition Year / Purchase Price2005/ S 11.0 mRemaining Land Tenure(at point of sale)42 yearsNet Lettable Area9,494 sqmOccupancy Rate (as at 31 Mar 2021)0%Completion Date16 Apr 202111 Changi North Way, SingaporeThe Property: 2-storey warehouse with 4-storey ancillary officebuilding within Changi International LogisParkLocation: It is located at Changi North Way, in close proximityto Changi International Airport(1) In accordance to Ascendas Reit’s Trust Deed, the Manager is entitled to a divestment fee of 0.5% of the sale price of theproperties.(2) The valuation was commissioned by the Manager and the Trustee, and was carried out by Colliers InternationalConsultancy & Valuation (Singapore) Pte Ltd using the capitalisation approach and discounted cash flow approach.(3) Assuming the proposed divestment of 11 Changi North Way was completed on 31 December 2020.21
Proposed Acquisition ofremaining 75% interestin GalaxisGalaxis, Singapore
Proposed Acquisition:75% interest in Galaxis, Singapore, a top-notch high-end business park in one-northPurchase Consideration (1)S 534.4 mAcquisition Fee(2), Stamp Duty andOther Transaction CostsS 9.4 mTotal Acquisition CostS 543.8 mVendorAgreed Property Value (based on 100% basis)Ascendas Fusion 5 Holding Pte Ltd (3)S 720.0 m ( 2% discount to avg. valuation)Valuations as at 30 Apr 2021(4)(based on 100% basis)Land AreaLand TenureJLL: S 734.1 m and Savills: S 736.0 mAvg: S 735.1 m19,283 sq mApprox. 51 years remainingGross Floor Area68,835 sq mNet lettable area (NLA)60,935 sq mOccupancy rate (as at 31 Mar 2021)Weighted Average Lease Expiry(WALE) (as at 31 Mar 2021)Key Tenants98.6%Initial Net Property Income (NPI) Yield5.4% (5.3% post-transaction cost)17-storey business park and office buildingat Galaxis, Singapore2.4 yearsSea, Canon, Oracle(1) The Purchase Consideration comprises a) the estimated consideration for the 75% equity stake in Ascendas Fusion 5 Pte. Ltd (“AF5PL”) of S 372.8million (subject to post-completion adjustments), which is based on 75% of the adjusted net asset value (“NAV”) of AF5PL, the holding entity forGalaxis, taking into account the agreed value of the Property (on a 100.0% basis) of S 720.0 million, and b) the 75% share of the existing bank loans ofAF5PL of S 161.6 million which the Vendor would otherwise would have to contribute to AF5PL for the repayment of such existing bank loans. For moredetails, please refer to the announcement “Proposed Acquisition of 75% of the Total Issued Share Capital of Ascendas Fusion 5 Pte. Ltd.” dated 4 May2021.(2) In accordance to Ascendas Reit’s Trust Deed, the Manager is entitled to receive an acquisition fee, payable in Units, of 1% of 75% of the AgreedProperty Value, which amounts to approximately S 5.4 m.(3) An indirectly wholly-owned subsidiary of CapitaLand Limited (the Sponsor).(4) The independent valuers Jones Lang LaSalle Property Consultants Pte Ltd (JLL) and Savills Valuation and Professional Services (S) Pte Ltd werecommissioned by HSBC Institutional Trust Services (Singapore) Limited (as trustee of Ascendas Reit) and the Manager respectively. Both valuers’valuations were carried out using the Discounted Cash Flow approach and the income capitalisation method.Five-storey work lofts building at Galaxis, SingaporeBCA Green Mark Platinum
Key Merits of the Investmentone-northBuona Vista Enlarges Ascendas Reit’s business park portfolio in one-north,Singapore Asset value of the Business & Science Park segment in Singapore willgrow by 17.6% from S 4.1 b to S 4.9 b (1) Total NLA of the business and science park segment in Singapore willincrease by 8.8% from 689,980 sq m to 750,915 sq m (1) Including the Property, Ascendas Reit is expected to own fiveproperties(2) with a total NLA of 188,225 sq m within one-north by theend of 2021 Strategic location Property is strategically located right in the heart of the one-north, avibrant business park in Singapore one-north houses key growth sectors such as biomedical sciences,information and communications technologies and media, scienceand research institutes, as well as start-ups. The area has a plethoraof food & beverage options and amenities such as hotels,supermarkets, clinics, gyms and childcare facilities Direct access to the one-north MRT station and is a 5-minute drive toAyer Rajah Expressway and a 15-minute drive to the Central BusinessDistrict(1) Pro Forma as at 31 Mar 2021.(2) Includes Grab’s Headquarters which is under development and expected to complete in 2021.Neuros & ImmunosNucleosone-northGalaxisNexus @one-northGrab’s Headquarters(under development) 15 mins driveLocation map Galaxis, one-north, Singaporeto CBDAscendas Reit’s existing property/property under development.24
Key Merits of the Investment Rare opportunity to acquire and achieve full control of a Singapore propertywith long remaining land lease tenure Long remaining land lease tenure of about 51 years, which is rare given JTCCorporation’s current practice of releasing shorter tenure land plots of between 20 to30 years under the Industrial Government Land Sales ProgrammeLift Lobby at Galaxis, Singapore 100% ownership of the Property i.e. better operational and tax efficiency A high quality and green certified business park property with high WhiteComponent Completed in 2015, the Property is zoned for Business Park usage with a 30% WhiteComponent(1) which is higher than the typical 15% White Component, allowing forhigher flexibility in the use of space such as having more office and retail space withinthe development Comprises 44,556 sqm ( 73%) of business park space, 10,305 sqm ( 17%) of officespace, 4,106 sqm ( 7%) of retail and F&B space, 1,968 sqm ( 3%) of work lofts, and atwo-storey basement carparkReception area at Galaxis,Singapore(1) Allowable Highest BCA Green Mark Platinum rating: green features include high efficiency multitiered chiller plant and air-conditioning system, intelligent lighting control and ecofriendly interior fittings and materials which are expected to attract high qualitytenantsuses within the White component under the Urban Redevelopment Authority of Singapore’s development control guidelines include office, restaurant, shop etc. Source: Urban RedevelopmentAuthority of Singapore.25
Key Merits of the Investment High occupancy rate underpinned by renowned tenants Key tenants include renowned companies such as Sea, Canon and Oracle Higher rental contributions from Information & Communications Technology and Electronics customers Enjoys high occupancy rate of 98.6% as at 31 Mar 2021 Distribution per Unit (DPU) and Net Asset Value (NAV) per Unit accretive to Unitholders26
Pro Forma Financial Impact(Based on 75% interest of Galaxis)In Singapore centsDPU (1)NAV per Unit (2)Before AcquisitionAfter AcquisitionPro FormaFinancial Impact14.68814.747 0.059(0.40% accretion)221223 2(0.90% accretion)NPI Yield in Year 1 (3)Pre-transaction cost5.4%Post-transaction cost5.3%(1)(2)(3)The annualised pro forma DPU impact is calculated based on the following assumptions a) Ascendas Reit had completed the Proposed Acquisition on 1 Jan 2020, held and operated the Property from 1 Jan2020 to 31 Dec 2020, b) the Proposed Acquisition is funded based on a funding structure of 40% debt and 60% equity, and c)the Manager elects to receive its base fee 80% in cash and 20% in units.The pro forma NAV per Unit impact is calculated as at 31 Dec 2020 and assumes the Proposed Acquisition is funded based on a funding structure of 40% debt and 60% equity, and the Manager elects toreceive its base fee 80% in cash and 20% in units.The NPI Yield is derived using the estimated NPI in the first year of acquisition.27
Capital Management1,3 & 5 Changi Business Park Crescent, Singapore
Healthy Balance Sheet Aggregate leverage is healthy at 38.0% (1)(2) Robust financial metrics that exceed bank loan covenants by a healthy margin A3 credit rating facilitates good access to wider funding options at competitive rates Available debt headroom of S 3.8 b (1)(2) to reach MAS’s aggregate leverage limit of 50.0%As at31 Mar 2021As at31 Dec 2020Aggregate Leverage (1)(2)38.0%32.8%Unencumbered Properties as % of Total Investment Properties (3)92.1%91.7%Interest Cover Ratio (4)4.6 x4.3 xNet Debt / Annualised EBITDA (5)8.1 x7.3 x3.33.7Fixed rate debt as % of total debt69.4%78.1%Weighted Average all-in Debt Cost2.2%2.7%A3A3Weighted Average Tenure of Debt (years)Issuer Rating by Moody’s(1) Excludes the effects of FRS 116 for properties held before 31 March 2019.(2) In accordance with Property Funds Appendix, Ascendas Reit’s proportionate share of its joint ventures’ borrowings and deposited property values are included when computing the aggregate leverage. The ratio oftotal gross borrowings to total net assets is 68.0%.(3) Total investment properties exclude properties reported as finance lease receivable.(4) Based on the trailing 12 months EBITDA (excluding effects of any fair value changes of derivatives and investment properties, and foreign exchange translation), divided by the trailing 12 months interest expense andborrowing-related fees.29(5) Net debt includes lease liabilities arising from FRS 116, 50% of perpetual securities, offset by cash and fixed deposits, while annualised EBITDA does not pro-rate for full year EBITDA from new acquisitions.
Well-spread Debt Maturity Profile Well-spread debt maturity with the longest debt maturing in FY2030 Average debt maturity stable at 3.3 years Secured new green loans of US 448.6m (S 593.6m) in 1Q 2021 To date, green financing of S 994m (1) accounts for about 16% of total borrowing of S 6.3 b (1)1400S 26FY2027Committed Revolving Credit FacilitiesMedium Term NotesTerm Loan FacilitiesRevolving Credit Facilities(1) Includes Green perpetual Securities of S 300m.5%DiversifiedFinancialResourcesS 237m ofRevolving CreditFacilities wererefinanced in AprilFY2028365100100FY2029FY2030Green Debt30
High Natural Hedge Maintained high level of natural hedge for Australia (72.3%), the United Kingdom (70.7%), the UnitedStates (89.0%) and Europe(75.4%) to minimise the effects of adverse exchange rate fluctuationsA Natural Hedge72.3%2.5A 2.2 bS billion Natural Hedge70.7% Natural Hedge75.4%US 1.5 b(S 2.2 b)A 1.6 b2.0US Natural Hedge89.0%(S 2.0 b)US 1.4 b(S 1.8 b)(S 1.6 b) 0.7 b1.5(S 1.3 b) 0.5 b(S 0.9 b)1.0 0.3 b(S 0.5 b)0.5 0.2 b(S 0.4 b)0.0Total AustraliaAssetsTotal AustraliaBorrowingsTotal UnitedStates AssetsTotal UnitedStatesBorrowingsTotal UnitedKingdom AssetsTotal UnitedKingdomBorrowingsTotal EuropeAssetsTotal EuropeBorrowings31
AssetManagement254 Wellington, Melbourne, Australia
Overview of Portfolio Occupancy94.9% 97.4% 97.3%92.5% 92.9% 92.9%86.9% 88.4% 88.6%SingaporeAustraliaUnited StatesMar-21Gross FloorArea (sqm) (2)(1)(2)(3)(4)3,001,293867,383 (3)Dec-2098.6% 97.5%(1) 97.5%(1)90.6% 91.7% 91.7%United Kingdom / EuropeTotalMar-20357,065Refers to logistics portfolio in the UK only and does not include the data centres which were acquired in March 2021.Gross Floor Area as at 31 Mar 2021.Gross Floor Area for Australia portfolio refers to the Gross Lettable Area/Net Lettable Area.Gross Floor Area for United Kingdom/Europe portfolio refers to the Gross Internal Area.590,377(4)4,816,11833
Singapore: Sources of New Demand in 1Q FY2021 Continues to attract demand from a wide spectrum of 1.4%9.7%0.6%By Gross RentalIncomeBy NLA31.8%8.1%1.1%5.8%32.1%ElectronicsDistributors & Trading CompanyFinancial & Professional ServicesLifestyle, Retail and Consumer ProductsEnergy, Chemicals and Materials29.3%34.0%Biomedical and Agri/AquacultureEngineeringLogistics & Supply Chain ManagementEducation and MediaIT & Data CentersNote: Customers’ Industry classifications have been updated to better reflect the organisation’s primary industry sector. Previous industry classifications were based on theSingapore Standard Industrial Classification (SSIC) which may be outdated due to changes in business activities.34
Portfolio Rental Reversions Average portfolio rent reversion of 3.0% was recorded for leases renewed in 1Q FY2021. Rental reversion for FY2021 is expected to be in the positive low single-digit range in view of current market uncertainties% Change in Renewal Rates for Multi-tenant Buildings (1)1Q FY20214Q FY20201Q FY20202.9%0.9%7.7%Business & Science Parks2.8%-1.1%7.0%High-Specifications Industrial and Data Centres-0.9%-0.1%12.2%Light Industrial and Flatted Factories0.8%-5.0%4.2%Logistics & Distribution Centres5.6%-7.1%0.3%Integrated Development, Amenities & Retail-2.7%11.5%15.6%-(2)-(2)13.7%Suburban Offices-(2)-(2)15.7%Logistics & Distribution Centres-(2)-(2)13.2%6.2%18.8%7.4%Business Parks & Office6.2%18.8%7.4%United Kingdom/Europe-(2)-(2)-(2)Data Centres-(2)N.A.N.A.Logistics & Distribution nited StatesTotal Portfolio :(1) Percentage change of the average gross rent over the lease period of the renewed leases against the preceding average gross rent from lease start date. Takes into account renewed leasesthat were signed in their respective periods and average gross rents are weighted by area renewed.35(2) There were no renewals signed in the period for the respective segments.
Weighted Average Lease Expiry(By gross revenue) Portfolio Weighted Average Lease Expiry (WALE) stood at 4.1 yearsWALE (as at 31 Mar 2021)YearsSingapore3.6Australia4.0United States4.9United Kingdom/Europe6.2Portfolio4.136
Portfolio Lease Expiry Profile(as at 31 Mar 2021)Breakdown of expiring leases forFY2021 and FY2022 Portfolio WALE of 4.1 years. Lease expiry is well-spread, extending beyond FY2035 About 9.9% of gross rental income is due for renewal in the remaining ofFY2021 Weighted average lease term of new leases (1) signed in 1Q FY2021 was 3.5years and contributed 3.0% of 1Q FY2021 total gross 0%7%16%20.6% 20.6%20%Business and Science Parks15%High-Specifications Industrial and DataCentresLight Industrial and Flatted Factories17.0%16.4%Multi-tenant BuildingsSingle-tenant Buildings10.7%(1) New leases refer to new, expansion and renewal leases. Excludes leases from new acquisitions.0.0%0.0%0.0%2.0%0.2%1.1% FY350.2%0.9%2.0% 1.3%FY350.0%1.0%4.5%FY341.5%1.0%1.0% 23FY220.5%5.3%2.1% 2.5% 3.4%6.7%FY337.0%5%Logistics & Distribution Centres8.8% 8.7%10%FY269.9%FY21% of Gross Rental Income (Total Portfolio)25%Integrated Development
Largest Singapore Industrial REIT First and largest business space and industrial REIT listed on the Singapore Exchange Largest Singapore Industrial Reit by AUM and Market Capitalisation A constituent of many indices such as MSCI, FTSE, EPRA/NAREIT, Straits Times Index Ave: S 4.5b Ave: S 6.3b Ave: S 3.7b Ave: S 3.0b Ave: S 1.5b