Transcription
tOCONENT RESUMEED 191 523AUTHORTI LEINSTITUTIONDATEJC 800 485Sachs, Steven MarkEast Los AngelesCollege Former Students Survey.Research Report 80-4.East Los Angeles Cell., Calif.Calif.Aug 80NOTE56p.EDRS PRICEDESCRIPTORSMP01/PC03 Plus Postage.Ancillary Sdhocl Services: *CommUni y Colleges:Courses: Dropout Research: *Dropouts: EnrollmentInfluences: Fcllowup Studies: InstitutionalEvaluation: Mexican Americans: *ParticipantSatisfaction: Questionnaires: *Student Attitudes;Student Evaluation of Teacher Performance: Tables(Data): Two Year Colleges: *Two Year CollegeStudents: Vocational FollowupABSTRACTA telephone survey of 1,080 students enrolled in EastLos Angeles Coll,ge (ELAC) during the Fall 1977 semester, but notsubsequently enrtled in the Spring 1978 semester, was conducted todetermine the stu4nts0.current activities and to ascertain theircharacteristics.and opinionS concerning ELAC. The former students,representing 10% of the :Fall 1977 enrollees who did not return forthe following semester, were asked to evaluate the courses andservices offered at MAC. In addition, the interview schedulecontained questions related to reasons for attending ELAC and for notreturning, the use students made of tutorial and counseling services,the students' current employment status, and what they liked most andleast about ELAC. Major findings, based on 242 completed interviews,reveal that most respondent, chose ELAC because of its'location, andthat they typically attended for only one semester. The primaryiaciomost liked about ELAC. was the helPfUlffe-Ss of the fatUity-i-and---the least liked factor was "a lack cf relevance of the student'smajor to his/her career goal." Fewer than 33% of the students hadconsulted an academic counselor, and only. 167E used tutoring services.Over 80% of the former Students were employed- -most OWO in fieldsrelated to their education. The-survey report analyzes findingS foreach item on the interview schedule and provides summaryrecommendations and data tables. (JP)*************** *********** *******-*********** ****i*-Reproductions supplied by EDRS are the best that can be madefrom the original document.*************************** *********** *********
AST -L -O Sc ) ERESEARCH REPORTLE.1RESEARCH REPORT 80-4EAST LOS ANGELES COLLEGEFORMER STUDENTS SURVEYS DEPARTMENT OF NEALTN.EDUCATION &WELFAREOFNATIONAL INSTITUYEEDUCATION"PERMISSION TO REPRODUCE THISMATERIAL HAS BEEN GRANTED BYSteVeR Mark SachstiA5 BEEN REPRO.IBIS DOCUMENTRECEIVED FROMOUCED EXACTLYA5ORGANIZATION ORIGINTHE PERSON ORTO THE EDUCATIONAL RESOURCESINFORMATION CENTER (ERIC).-ATING IT POINTS OF VIEW ON PINK:INSSTATED DO NOT NECE55ARILY REPRENATIONAL IN5TITUTE OFSENT OFFICIALOR POLICYEDUCATION 'POSIT IONSteven Mark Sachs,Coordinator of Research and Evaluation(Questionnaire design-by Ernesto BalleAugust, 1980eros)
EXECUTIVE SUWARYEAST LOS ANGELES COLLEGEFORMER STUDENTS SURVEY-Based on aeseries.of phone interviewswitha random sample of former FLACstudents, a number of major findings surfaced. Here are a few of them:Most ELAC students chose the school because it was close to home-.Students typically attend only one semester.3.Spanish is spoken in the homes of 71.2% of our students.4.One-fifth of our students want to get a degree; fewer than 10% expectto be prepared for a 4 -year college through their ELAC studies.5.Severweefourpercent of students feel that they are able to take coursesrelevant to their career. interests.6."Good teachers" is the primary factor most liked about ELAC coursework.7.Least-liked factor realted to coursework is "lack of relevance of thestudent's major field to his/her eareer goal."8.Over 3/4 of students are employed; 2/3 of these feel that their education is relevant. to their job."Average" number of weekly hoursworked:34.49.One' third of students feel that their courses require "an excessiveamount of work."10.Eighty-twO percent of students feel that class material is well taught.11.Fewer than 1/3 Of students ever see an academic counselor.12.Sixteen percent of students used tutoring services.13.Least liked aspects of the collegeare the facilities; this probablycenters on the parking situation.14.Over half ofthe nonworking students desire employment while attending.15.Highest-rated service was the library; lowest was parking.16. About 14% of our students actually truster; largest chunk of these goto CSULA.17.Over 80% of former-students are now working.18.Females attend longer and take more units than do males. They are alsomore, interested in formal recognition such as degrees.19.Fulltime. students list "Teachers Nice/Caring" as most liked aspect ofELAC in 13% of the- cases; only 3.8% ofpartimie list this is most liked,20.Proximity to home was more important to parttime and evening studentsthan it was to fulltime or day students in terms of reasons studentschose ELAC.1.2.The following presents a selection of the several recommendations made inthe report:1.2.3.4.5.6.7.8.View ELAC as a "'community college" rather than as a 2 -year, pre-university institution.Support basic English clad ESL.Course and degree -completion rates are inappropriate measures forstudent. ccounting.Extend registration periods or provide better forewarning about closing,dates.Increase counselor input into student selection of (or abolish theconcept of) a 'major."Maximize social opportunities for students; they place great emphasison them.Improve the parking situation.Increase visibility and publicity of he Placement Office
, 0 N LENExecutive SUM-ryPurposeMethod2-18ResultsTable 1:Sex BreakdownTable II:Ethnic BreakdownTable III:Age BreakdownTable IV:dow StudenLs Found Out About East LosAngeles CollegeTable V:Why Students Cho.,,e East Los AngelesCollegeTable VI:Number of Semesters CompletedLos Angeles CollegeTable VII:atStudent Load indicatorTable VIII:Attendance Logistics1Table IX:Table X:Veteran StatusLarFuage(s) Spoken in the HomeTable XI:6Pe4sonal Benefit Expected from EastLog Angeles CollegeTable XII.:Type of Program in which EnrolledTable XIII:Able to T4.ke Courses Relevant toCareer Interests?Table XIV:Table XV:Reason Not Able to Take RelevantCoursesFactor(s) Liked Most about Coursework7Table XVI:7Table XVII:7Table XVIII:Factors) Liked Least about CouRelevance of Coursework to JobWere Courses Useful to Student's Job?
iifPage8Table XIX:Table XX:Coursework-Related Statc m ntand DisagreementMeetings with Academic CounselorsCounselor Helpfulness RatingsTable XXI:Table XXII:Tutorial Services Usa.Table XXIII:Table XXV:-Reasons Tutors Not Use'Table XXIV:Tutor Effectiveness (Dir. - andInferredMost Liked Aspects of East LosAngeles College10Table XXVI:10Table XXVII:Working Student Logistics10Table XXVIII:Financial Aid Logistics11Table XXIX:11Table XXX:112AgreementLeast Liked Aspects of East LosAngeles CollegeAdequacy Ratings of Several ServicesReason for Not Returning to East LosAngeles College for the Spring SemesterT ble XXXITable XXXII:Table XXXIII:What-th-e-Coilege-Can-Do to InduceStudents to Return Schools Students are AttendingPlanning to AttendFormer Students Currently DoingThisTable XXXIV:13Table XXXV:13Table XXXVI:What Student Likes Most about His/Her Current SchoolWhat Student Dislikes Most about HisHer Current SchoolDo Students Feel; They were Preparedfor Their College Courses (Adequate.Basics)?13- Table XXXVII:Are Students Interested in ReceivingInformation on ELAC Basic SkillSPrograms?
ivPage14Table XXXVIII:14Table- :AXIX:14Table XL:14Table XLI:1E)Table XLII:.15Table XLIII:Sex and Average Semesters CompletedSex and Average Units CompletedSex and Degree ProgramTable XLIV:Sex and Reason for Not Returningto ELACSex and What Student 13 Currently DdingAttendance Status and What Student isCurrently DoingAttendance Stuatus and CounselorHelpfulness Ratings16Table XLV:16Table XLVI:17Table XLVII:18Table MUT; .Attendance Stuatus and How StudentAttendance Status and Most LikedAspects of East Los Angeles CollegeAttendance Status and Least LikedAspects.of East Los Angeles CollegeAttendance Status and Reason for NotReturning to East Los Angeles CollegeFound Out, about East Los Angeles College18Table XLIX:Attendance Status and Why Student ChoseEast Lcs Angeles College19Diicussion and Conclusions:Initial Notes21Discussion and COncluSionsForMal Exposition25RecommendationsAPI-1Appendix I:APII-1Appendix II:Former Students /Survey FormRepresentativeness of the Sample :ofRespondents
PURPOSEIn its continuing effort to maintain the highest educationalquality, East 'Los Angeles College periodically surveys itscurrent and former studentts for objective and subjectivefeedback on the.Colle -'s effectiveness. This ReSearch Reportwill provide information on a sample of former ELAC studentsin terms of their current status and tivities and the waysin which their collegiate experiences at ELAC affected them.METHODWith the assistance of the ELAC 0iof Admissions, infor-mation sheets on all students enrolled d in East Los AngelesCantWs Fall, 1977 semester but not, subsequently enrolledin the Spring, 197S semester were obtained,These sheets:provided theReseareh Office with names and telephone numbersofthese noncontinuing students.Assapproximately 10%, N- personmple was obtained by record-ing the n me and: phone number of every 10th student listedon the sheets.The Tomer Students Survey was developed and each identifiedtudent was telephoned. (See Appendix I tor a copy of the Survey.)
Comploted questionnawere hand-coded, then keypuw ed.Computer analysis was via the Statistical Package for theSocial Sciences, as "programmed" by this wrRESULTSApproximately 1,080 telephone calls were made; of242 were completed for an overall response rate-122.4%.The following tables present the results of the phone survey.The reader is referred to Appendix II for statistical measuresand discussion on the reprveness of the sample ofrespondents,The Discvssion and Conclusions section, beginning on Page 19,will further develop the information in these tables.THIS SPACE INTENTIONALLY LEFT BLANK
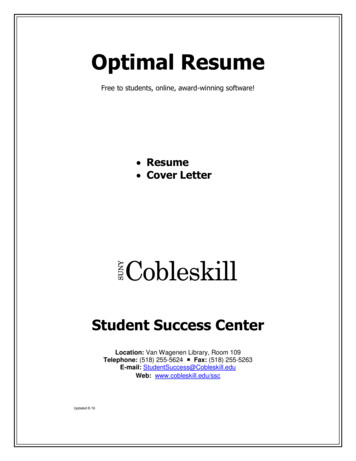
SEX BREAKDOWNTABLE ISURVEY GROUPNUMBERPERCENTCATEGORYSTUDENT 1550.78,21152.1FiliNIC BREAKDOWNTABLE IISURVEY GROUPRUMBERPERCENTCATEGORYNative AmericanSTUDENT 0.9Other219.3BlackMe x. Am./Chicano,831.0A E BRTABLE IIICATEGORYSURVEY GROUPNUMBERpERCENTSTUDENT POPULATIONNUMBERPERCENTUnder .850-59126.75973.721.11511.035-360 MEAN.MECUM28.324.827.0In 20-24 interval
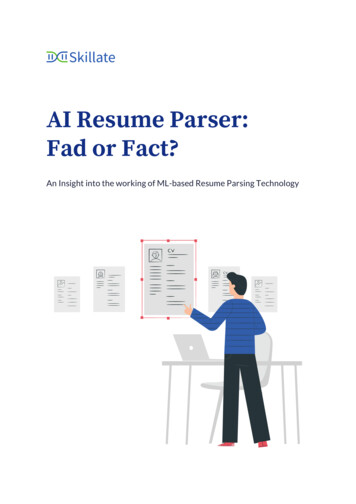
80-4:4HOW STUDENTS FOUND OUT ABOUT EAST LOS ANGELES se to Home7132.3High treach ClassCommunity Services ClassOther Method.WHY STUDENTS CHOSE EAST LOS ANGELES COLLEGE(Criterion used: Reason must account for at least 3%REASONTABLE Vrespondents)PERCENTNUMBERClose to HomeTABLE IV12660.9Reputation of ELAC167.7Obtain More Know-125.8Free /Low Cost73.4Close to Job62.9Other Reason4019.3ledgeNUMBER OF SEMESTERS COMPLETED AT EAST LOS ANGELES COLLEGENUMBER OFSEMESTERSNUMBER0451246836222558367 126TALE VIPERCENT20.330.6Mean 2.116.29.9Median 1.511.33.65.4Mode 12.81
STUDENT LOAD INDICATORCATEGORYTABLE VITSURVEY GROUPNUMBERPERCENTSTUDENT t me13962.911,43372.6ATTENDANCE LOGLOGISTICSCATEGORYTABLE VIII'SURVEY GROUPPERCENTNUMBERSTUDENT 0547.55,75536.5VETERAN STATUSTABLESURVEY GROUPCATEGORY u NUMBERPERCENTVeteranNonvet4320.117179.9LANGUAGE(S) SPOKEN IN THE HOMELANGUAGEEnglish,TABLE XPRIMARY STATUSNUMBERPERCENT16672.846JapaneseSECONDARY 0N/AN/A13357.6SpanishNone,11
80-4:6PERSONAL BENEFIT EXPECTED FROM EAST LOS A GELS COLLEGE(Criterion used:Benefit must account for at least 4% of respondenTABLE XISURVEY GROUPNUMBERPERCENTCATEGORYMore Knowledge5830.14121.22513.0199.8Get/Improve Job Skills94.7Personal Interest94.7Understand Myself84.1Get a Degree-Earn More MoneyPrepare for 4-Year CollegeTYPE OF PROGRAM IN Wh ICH one listed14060.6ABLETAI COURSES RELEVANT TO CANSWERNUMBERYesN60TABLE XIIR-STS?TABLE XIII'PERCENT16373. 5826.2REASON NOT ABLE TO 'PAIGE RELEVANT COURSES(Criterion used: At least 4% respondents gave this reason)NDid Not Register, in TineGraduated:sHave A.A. or A.S. Degreess ss ss sS s sWorking Full-Time/No TimeTABLE XIVPERCENT22.98.s5.7-- -'t Like Sch5.7
FACTOR(S) LIKED MOST ABOUTCOURSEWORKat least 4% or respondents)(Criterion:FACTORNUMBER39'GOod TeachersTABLE XVPERCENT,31.5"Education"1411.3"Interesting"13 -.10.5Fine School108.1'108.1Good Programsor ChicanosFACTOR(S) LIKED LEAST ABOUT COURSEWORK(Criterion: at least 4% of respondents)FACTORLack of Relevance of MajorField to Career CoalTABLE XVINUMBERPERCENT4042.6Lack of Social Opportunities1718.1Course Content in Student'sMajor Field1617.0Teaching in Student's MajorField66.4Residence/Living Accomodations55.3RELEVANCE OF COURSEWORK TO JOBANSWERNUMBER106RelevantNot RelevantNoPERCENTNUMBER-67.932.150WERE COURSES USEFULANSWERYesTABLE XVIISTUDENT'S JOB?TABLE XVI I IPERCENT103.88.81311.2I.3
ODURSEWORK-RELATED STATEMENTS:AGREEMENT AND DISAGREEMENT.AGREESTATEMENTTABLE XIXDISAGREE :-NUMBERPERCENTThe courses were accurately described inthe College Catalog16584.2314The courses required an excessive amountof work6533.712866.33719.215680.8The class material was well taught15582.43317.6The courses were challenging14677.243'22.8The courses were what you expected16083.33216.7NUMBERPERCENT.The course work was too advanced(difficult)MEETINGS WITH ACADEMIC COUNSELORSAverage numbers:69.7%19.2%6.7%4.4%TABLE XXMean 0.47 J Median 0.21Mode 0.0.neveroncetwicemore than twiceCOUNSELOR HELPFULNESS RATINGSTABLE XXIDISAGREEAGREEHELPFULNESS CATEGORYNUMBERPERCENTNUMBERPERCENTGetting the courses student needed4565.22434.8Understanding the courses better'3856.72943.3TUTORIAL SERVICES USAGEANSWERYesNoTABLE XXIINUMBERPERCENT15.7177(84,314
TABLE YarnREASONS TUTORS NOT USEDNUMBERREASONDidn't-need themPERCENT.63.497Didn't have any tutors for my class8Other reason given5.2,\46I30.1TUTOR EFFECTIVENESS (DIRECT AND INFERRED)ANSWERUESTIONWere tutoes,helpfulTABLE - yOu usethisserv.ceagain?YESNO:.MOST LIKED ASPECTS OF EAST LOS ANGELES TThe College in General4022.7The'College's Location34'19.3Social Opportunities1810.2169.1thing in the Student's Major FieldTeachers Nice/Caring13Course Content in Student's MajorField105.774.0Cost of. Attendance7.4
LEAST LIKED ASPECTS OF /EAST LOS ANGELES COLLEGE(Criterion:4CATEGORYTABLE XXVINUMBERrPERCENTFacilities3030.6Teaching in Stu/dent's Major Field1212.2Counseling/Guidance ServicesScheduling8.2ClassesQuality of Students77.1.66.1WORKING STUDENT/LOGISTICSCATEGORY IEmployed While attending ELAC?TABLE XXVIINUMBERYESNO/nourS worked/week:20 and under(based Only on those21 to 39who worked while students)40over 40-Work schedule interfere withYESclasses7lAsked of working 78.3430067.7Interested in working while,attending? (Asked of nonworkingstudents)YESNO30Did you use ELAC Job PlacementServices?(Asked of nonworkingstudents)YESNO133827AVERAGESMean 34.4Median 39.8Mode 4032.352.647.425.574.5FINANCIAL AID LOGISTICSTABLE XXVIII-CATEGORYNUMBER'PERCENTIf received financial aid, was itenough?YESNO14125346.2If did not receive financisl aid;did you know whether or not youwere eligible for it?YESNO4513425.174.9
80 -4 :11ADEWACYRATINGS OF SEVERAL. SERVICESTABLE ERCENTCounseling Services8578.72321.3Department Advisors5777.01723.013190.3149.7Library Services*Job Placement Services51'73.91826.1Financial 080.33419.7.6637.910862.112068.65531.4Locationthe CollegeAvailability of Teachers Outside of ClassSchedule of CoursesParking FacilitiesRegistration Process2.8*Keep in mind that this survey was done on students attending in Fall, 1977;this is before completion of the new library.THE SPRING SREASON FOR NOT RETURNING TO EAST LOS ANGELES COLLEGE FOR(Criterion:4%)NUMBERREASONIs working,GraduatedHome Responsibilities.PER4626.92011.7137.6Illness4.7TOO Busy / No Time4.7Not Interested74.1Don't Want to Work That Hard74.1No Transportation7.4.1
,WHAT THE COLLEGEINDUCE STUDENTS TO RETURNREPLYTABLENUMBERMore / Better ClassAs.iEach Major50.0Become a 4-year College315.0Make it Like High School15.0Expand Exteamlon Program5.0Improve Facilities,'5.0Improve Counseling15.0Improve Organization15.qINC OR PLANNING TO pc39.4CSULB26.3UCLA26.3High ng -for WorkNuMber listing none 199;this is 86.1% of the unadjustedtotal.Therefore, 13.9% aspireto'or have transferred.TABLE OtherTABLE XXXIIPERCENTFORMER STUDENTS CURRENTLY DOING TB S:ACTIVITYWorkingIPERCENT10SCHOOL' STUDENTS APE ATTE80-4'12
80-4:13WHAT STUDENT LIKES(Criterion:ST .TNT ST4%)CATEGORYNUMBERPERCENTThe School in General22.9Course Content in Major Field22.9Extracurricular Opportunities411.4Social Opportunities411.4Location38.6Relevance of Major Field to Career Goals-5.70AT STUDENT DISLIKES MOST ABOUT HIS/HER CU(Criterion:SCHOOLTN .1Scheduling of Classes211.1DO STUDENTS FEEL THEY WERE PREPARED FOR THEIR COLLEGE COUANSWERYesNoNUMBERTABLE 'XXXVI(ADEATE BASICS?PERCENT14670.56129.5TABLE XXXVIIARE STUDENTS INTERESTED IN RECEIVING.INFORMATION ON ELAC BASIC SKILLS P CRAMS?ANSWERYesNoNUMBERPERCENT11956.79043.3
80-4:14.SEX AND AVERAGE SEMESTERS COMPLETEDSEX-MEANMEDIANMale1.991.47Female2.21SEX AND AVEV'TABLEt ''ITS COMPLETEDSEXMEANMale15.02-Female17 18. IXTABLEMEDIAN.7.6311.00SEX AND DEGREE PROGRAMTABLE Male3274.41125.6Female3882.6817.4SEX AND REASON FOR. NOT RETURNING TO ELAC(Criterion: More than 2 respondents, either male or female.)TABLE 911.51112.2Home responsibilities67.777.8Illness11.366.7Don't want to work that: hard22.65No transportation22.645.1REASONIs workingToo busy / no time,PERCENT.21.155.644.4.145.1'Not interested3.3Want to attend another'school22.633.3Not ready for college at the moment33.811.120
80-4:15AT STUDENT IS CURRENTLY DOINCTABLE ERCENT8488.47477.100.01111.55.333.1Home or family dutiesgLooking for TENDANCE STATUS/ ANDAT STUDENT IS CURRENTLY DOINGFULLTIMEper.ACTIVITYNWorkin48Home/oorfamily dutiesLo king for work7.3TABLE .011.011.1Military0G. 010.800.011.1"Other"711.343.466.155.4ATTENDANCE STATUS AID. COUNSELOR HELPFULNESS RATINGSFULLTIMEHE gULNESS CATEGORY (AGREEMENT)NPCT.NGetting the courses student needed'Understanding the courses betterTABLE XLIV,DIMEPCT.DAYNPCT.NPCT.VE-2172.42262.930 . 69.81557.7-1.346.42367.62354.81560.0-
80-4:16ATTENDANCE STATUS AND MOST LIKED ASPECTS OF EAST LOS ANGELES COLLEGE(Crite4pn: 4% of any subgroup)FULLTIMEPARTTIMEVTABLr.DA YE V FCATEGORYN.PCT.N.PCT.N.PCT.The College in General1423.32321.72628.01417.3The College's Location1118.32220.81617.21721.0Teachers Nice / 6.51012.35.04. 3.844.33Social OppOrtuni4esTeaching,the Student's Major Field6PCT.1.7Cost of Attendance3Recreational Facilities23.343.844.3Course Content in Student's Major Field11.758.544.36Scheduling of Classes TO'iALS OF THESE PERCENTS11.743.811.14.2.55W5W5 11115IMMI M88.3FULLTIME'N.PCT.Facilities12PARTTIME4.9W MMWW80.2TABLE MINID A 47.57.037.3N.PCT.28.61732.1Teaching in Student's Major Field5 '11-.96Counseling / Guidance Services37.17.1Scheduling of Classes7.488.383.2ATTENDANCE STATUS 'AND LEAST LIKED ASPECTSOFE T LOS ANGELES' COLLEGE(Criterion:4% of any sUbgroup)CATEGORY3.7.--------------------Quality of Students37.135.72.4.811.9Location of the College55M55 W M MM .M M5 210M-MMIMINI MMIMM .MMIMI WM,rnmmi mrnma67.9TOTALS OF THESE PERCENTS66.635.337.30.0035.3W INEEM IIMERIMFM1511 2Mfm63.273.1
TABLE XLVIIATTENDANCE STATUS AND REASON FOR NOT RETURNING TO EAST LOS ANGELES COLLEGE(Criterion:More than 2 respondents in any category)FULLTIMEREASONPARTTIMED A YE V 2.865.715-17.056.2No Transportation58.821.966.811.2Home .9Too Busy / No Time23.565.44.544.9Don't Want to Work That Hard11.865.733.444.9Not Interested00.065722.3.A'4.9Want to Go to Other School11.84-3.82.2.3.33.7Course Content in Student's Major Field 11.9.32.911.13.,3.7Scheduling o1.832.922.3 ,33.7Is WorkingGraduated22./Classes1,Not Ready for College at the.Moment11.832.9ililM5MMWWWwmwftmemmormmmmm wwWWWW1WWWWWWWWWWWWTOTAL OF THESE WM80.575.1
-4:18ATTENDTABLE XLVIIICE STATUS AND HOW STUDENT FOUND OUT ABOUT EAST LOS ANGELES COLLEGEFULLTIMEPARTTIMED A .698.71.553.710.9.54.911.532.2.10.93.2.9Community Services Class00.010.700.011.0"Other .2536.84331.9Close to Home1927.945High School Counselor1622.1Newspaper1OutreachFriend / RelativeE V E TABLE XLIXATTENDANCE STATUS !ND WHY STUDENT CHOSE EAST LOS ANGELES COLLEGEI erion:, At least 2 in any subcategory)FULLTIME'PARTTIMEREASONN. :PCT.N.PCT.Close to Home-D AEV 66.3Personal Interest6.110.843.8-1.1.1Free / Low 1Prepare for a Four-Year College11.5--32.432.911.1Counselor's Advice11.521.611.022.1-11.55-4.021.944.2Obtain More KnowledgeReputation of SchoolChoose a Career10.5.111Close to Job.WWWWWWW MMMMMM W M WWWWWWWWWWWWWWWWWWWWWWWW WWWWWWWWWWWWWWWWWWWWWWWWWWWWWWWWwWWWWW.-TOTAL OF THESE PERCENTS80.22494.2.87.591.6
DISCUSSION AND CONCLUSIONSA few initial notes:1This discussion will only consider tht."high points" ofthe,study's.results.The reader interested in detailshould- consult the.tables themselvesAdditionally,substantially more detailed data than will appear inthis Report are available from the Office of Researchat East Los AngelesCollege.Unless otherwise stated, the percents listed in.,the.tablesare what are called "adjusted percent figures."This means that blank and uninterpretable responses wereexc luded from the percentage computations.Most of the-tables provide percent values which do notadd to 100.This is beCause certain low-yield responseswere not.tabulated.In these cases, the criteria usedfor inclusion of responses in the table are provided.he body of-this Report, only five different statisticsare used.mode.They are:number, percent, mean, median, andIt is assumed that the reader is familiar withnumber and percent.A "mean" is the often -used averagewhere the scores are totaled and then divided by the
number of scores.Mean age of people who areExample:20, 25, and 26 years of age 4A "median'(2'0 25 26)23.7 years.3is. that score which. has the same number of,scores below it as there are above it,age of people -who .are aged 20Example:25, and 26Median,25 .years0.since one personA ."mode"younger and one pers n is older than 25.the most frequently- occurring score.ExampleModal age Of people, who are 20, 20; 20, 23, 23, and 75yearsd is 20 years old. since there are more people 20years old .thane -any other age.5.Since the basic. d MOgr phits of sex, ethnicity,fulltime /.partimeatus;and day / evening status aretreated in Appendix II, they will not be distussed hereexcept to say that, on the whole, the respondents of thisstudy, were ,sufficiently representative to justify thegeneralization of their replies to:the entire noncontinuingstudent body.There were several sections of the survey which requestedthe respondent to choose one of several alternatives asthe "most liked"least liked," "most, important," "least.important," anclso on.It is critical that.the readerrealize that this forced- choide may artifically deflate26
the importance of a given reply.For example, the verylast Table (Table XLIX) in the Results section indicatesthat 0.0% of the evening respondents listed "Free / LowCost" as the reason for choosing East. Los Angeles College.This does not imply that the cost of ,instruction -was un-important; it merely says that at,least one of the otherpotential reasons listed was seen as more important.Thisorientation to understanding forced- choice questions mustbe maintained to ensure reaching meaningful conclusio1LAC's noncontinuing students usually found out about theschool either from a friend or relative or merely becauseit was close to home (and presumably was "sighted" in thecourse of traveling to or from home on several occasions).These two methods account for over 2/3 of our noncontinuingstudents, and each method is about equally-effective.Highschool counselors provide. initial- information to 16.4% ofour former charges.This is a significant proportion, socultivation of high school counselors would appear to be alucrative recruitment device.When asked- why students chose ELAC.(regardlOS-S of how they-found out about the school), the clearly preponderant reason2
was that it was close to home.The second-ranked reason wasthe reputation of ELAC; almost 8% of the respondents listedthis as their reason for choosing the college.Consistent with overall California Community College (CCC) trends,the modal enrollment pattern of our former students was toattend only one semester (30.semesters was 1.5.The median number ofClearly, like all CCCs, East Los AngelesCollege is not serving essentially as a "2-year" college.When asked about the primary and secondary ,languages spokenin the home, it was found that 20.2% of our former studentslisted Spanish as a primary language; additionally, Spanishwas a secondary language in 51.0% -of our former students'homes.Taken together, we find that the Spanish languageis heard in 71.2% of our former students' homes.Theappropriateness of basic English and ESL (Englishasseconci'language) classes is underscored by this finding.When we look at the personal benefit expected from attendanceat ELAC and compare it to the type of program in which thestudents enroll, certain interesting facts surface.While21.2% of the former students had wanted to get a degree,3-1-2% felt they ware enroliod in a.degree program,.1Keppingin mind that the most frequently listed expectation was toobtain more knowledge, we find that many students purposefully,
80-4:23enroll in a degree program without any particular aspirationfor formal recognition.Note that only 9.8% of .the formerstudents interviewed expected to be prepared for a 4-yearcollege through their experiences here at ELAC.When asked about the type of program in which they wereenrolled, a Full 00.6% of 'the noncontinuing students failedto list enrollment in al degree or certificate program.This acts as a reification of the fact that formal, "paper"recognition for education is not a major factor in attracting/students.This may also be applied to the argument againstcompletion rates in classes as appropriate criteria forcomputing institutional funding allocations.When respondents-re asked if they were able to take coursesrelevant to their career interests, 73.8% answered in theaffirmative.This pointsup the strong relationship betweencommunity college education and occupational/career aspiration.Students were further queried as to why they were unable totake relevant courses, when such was the case.While thereasons given were extremely diverse, the modal reply (22.9%)was that. they did not.tegistcrjn time.This has strongimplications for either the extension of registration periodsor at leaSt fibt better fore arning for potential students-to,help ensure timely registration.Interestingly, only 5.7% of
80-4:24the nonContinuing students listed their jobstime conflicts)as being responsible for t eir.not being able to take relevantcourses.What did students like most about their coursework?Abouta third listed good teachers; this was the modal response.Other factors which are less interpretable include "Education"(11.3 ) and "interesting" (10.5) ,n the other side of the coin, the lack of relevance of thestudent's major field to his/her career goal was listed by42,6% of respondents as the factors liked least about thecourseworkThis prob,ly reflects poor choice of major onthe part of the student since "Course Cdntent in StudentMajor Field" was another answer option (listed by 17A% ofrespondents).This 17% may 'also be including college ordepartmental breadth requirements as undesirable.Almost20% of the students listed a lack of social opportunitiesas a factor liked least about coursework.Surely th-importance of student services to student retention becomesclear at this point.About 77% of our former students were employed while attendingELAC (as we will see later). :Over 2/3 of these-people- lelt-that their education, was relevant to their jobs.a larger proportiop'-- 88.8%Enigmatically,felt that the c curses were
useful to their jobs.The existence of some respondentslisting coursework as useful but irrelevant to their jobsadds a note of humor to the results!The information in Table XIX presents a wideband evaluationof several ftAC.phenomena.We find that 84.2% of the formerstudents felt that the courses were accurately described inthe College Ca
least about ELAC. Major findings, based on 242 completed interviews, reveal that most respondent, chose ELAC because of its'location, and that they typically attended for only one semester. The primary iaciomost liked about ELAC. was the helPfUlffe-Ss of the fatUity-i-and----the least liked factor was "a lack cf relevance of the student's