Transcription
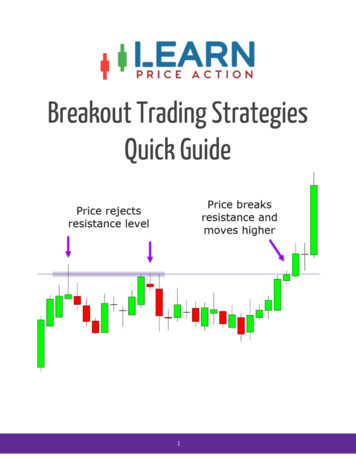
Breakout Trading Strategies for BeginnersWritten by Oleg TkachenkoSimple forex strategies for beginners to trade breakouts and price pull-backsForex strategies to trade breakouts for newbies: trading with channel indicators, spotting channel breakout or theprice rebound. Types of levels, rules for entering and exiting a trade.I welcome readers to our trading blog. Today, I’d like to write about the beginner trading strategies that usechannel indicators, which are always treated as a separate category. Such simple Forex trading strategies suggestentering a trade at the time of the channel breakout or the price rebound. Trading skills here are necessary todistinguish between the correction or the inertial price movement and the major trend direction. From thisarticle, you will learn about price levels and simple forex strategies that work, based on them; you will also learnforex strategies that apply combined indicators.Breakout trading strategies for beginnersAny forex trading strategy for beginners is made based on a particular regularity. It doesn’t matter if it is aboutfundamental or technical factors. An example would be entering a trade after certain events (news publications)or when any indicators meet with each other. A separate group includes strategies built on the breakout of anyimportant level or channel. Another way to interpret such kind of strategies is when the price returns in thechannel after the rebound from its border or the rebound from the important level. The difficulty in trading withsuch strategies is to find out whether the price will break out the level or it will reverse. I will describe theimportant trading levels and give examples of real strategies with channel indicators.
Soon, you will have to make your own strategy (based on the features of the trading platform you like best). Itdoesn’t matter whether it be a trading range (price range), a moving averages-based strategy based entirely ontechnical analysis or a price action strategy. Before you become a forex trader with your own trading style it’sbetter to try every other style there is to know the difference and find the one that suits you best.Trading levels and level-based forex strategyThe psychology of forex level and channel strategies is that traders behave in the same way in particularsituations, and trading together with the majority is often quite efficient. The psychology principle is as follows: Each trader expects a particular target profit and each trader has his/her own risk limit. It is expressed in the factthat traders put stop losses and take profits at particular levels and these levels are the same for the majority.This is how strong support and resistance levels appear. Support is the level, below which don’t let the price fall;resistance is the level, above which bear don’t let the price grow. The strategy is based on that you enter a tradein the opposite direction when the price reaches the level, that is, you open a position on the price pull-back inthe direction of the reversal.The level breakout means that there has been come fundamental factors that encouraged most traders to openpositions even when the price reaches the psychological level. It means that if there price hasn’t rebounded, astrong trend appears.Both trading ideas are well illustrated in the chart of market capitalization.The price has been trading between levels 200 and 250 during a month. Although the price hasn’t touched thechannel borders, it is clear how it is rather smoothly moving from the bottom border to the top one and back.Arrows mark the moments of entering trades (the price chart of top cryptocurrencies corresponds to the marketcap chart). Following the breakout of level 200, the price touches the next psychological value of 175 and followsby trading in a narrow range for a while. The second yellow circle highlights the new breakout and the start of astrong downtrend.The difficulty of trading is to find out whether it is the breakout or the price is moving on by inertia and is aboutto reverse. So, there are a few tips to spot it when a breakout occurs::
Do not be too early to enter a trade in the opposite direction if the price has touched the target level. Expecteither a reversal or the movement continuation, followed by a correction.Do not open a trade too early if the price has reversed without touching the level. It may not be a reversal, it maybe rather a temporary rollback, after which the price will resume the major trend.Pay attention to the trend features and its angle the angle of its movement. If the angle was narrow for a longtime, after which there was a sharp change, this is a signal to enter a trade. An example of such a situation is onthe figure above (the first yellow circle).Types of Forex levels: Fibonacci levels. It is an infinite series of numbers, based on mathematical approach. As experience proves,traders adhere to these levels intuitively. You can learn more about their nature and applications in this article.You can calculate Fibonacci levels, using calculator.Psychological levels. These are levels that are based on human psychology, often being chosen intuitively. Forexample, they are often at round numbers.Historical levels. They are strong levels that are regularly hit by the price, they are clear in the long time periods.Mirror levels. They are the levels, which the price breaks through, returns to them after the correction and againgoes in the main trend. The resistance level thus turns into a support level.Pivot levels. They are the levels, drawn based on the history opening and closing prices. I will describe them inmore detail in one of the strategies below.Channels (dynamic) levels are similar with the only difference that the channel borders here look like flexiblelines. There are many channel indicators and none of them can be said to be more or less accurate. Muchdepends on a particular market situation. I will give practical examples of such indicators further. Let's see the 3basic forex trading strategies for beginners:1. Basic forex strategy: Dynamic Channel Trading This trading system applies the Keltner channel (KC) indicator, a combined tool that constructs a dynamic pricechannel. It is based on two standard tools:ЕМА - Exponential МА.ATR – Average True Range.The principle of the strategy is that in a quiet market, the price moves inside the channel, taking its averagevalues. When it deviates from the average values (i.e., moves towards the borders), it tends to return. TheEUR/USD pair, traded in the M15 timeframe suits the indicator settings the best. It is not recommended toshorten the timeframe; it can be longer for other pairs if it provides more accurate signals.KC settings: ЕМА period 20, ATR period ATR 20, Factor 1.5 (the factor, by which the ATR value is multiplied).You can download its free template for MT4 following this link.Requirements to open a long position:One or more candlesticks go lower than the channel bottom border. But there shouldn’t be more than 7 of them,as, otherwise, it can be about the channel breakout and the start of a new strong trend. The candlesticks must belocated completely below the channel line.The distance between the dynamic line and the high of the candlestick below it must be longer than 5 pips.After all these requirements are met, a rising candlestick is emerging in the chart, which closes above thedynamic line. Differently put, the price has reversed and is going back to the channel centre. The longer is thebody, the better.
You enter a trade at the next candlestick. A protective order is put at a distance of 15-30 pips. I recommendexiting the trade after the price has reached the channel centre. You may close 50% of the position, and protectthe rest of it by trailing stop, having moved the stop loss at the breakeven. Requirements to enter a short trade:One or more candlesticks go higher than the channel top border. But there shouldn’t be more than 7 of them.The candlesticks must be located completely above the channel line.The distance between the top dynamic line and the low of the candlestick above it must be longer than 5 pips.After all these requirements are met, a falling candlestick is emerging in the chart, which closes below thedynamic line. Differently put, the price has reversed and is going down to the channel centre. The longer is thebody, the better.The entry and exit requirements are similar. An additional confirming signal can be a candlestick reversal pattern,formed beyond the channel.
The indicator performs the best during classical market movements, that is, in a calm market. Trading is avoidedat the time of news releases, as there are many false signals (false breakouts) during increased volatility. You hadbetter also avoid trading flat and the Asian session. If the channel looks narrow, compared to the previousperiods, you shouldn’t also enter a trade. You neither enter a trade if the signal candlestick looks too long, i.e. ithas reached or is near the channel center.2. Trading strategy: Pivot levels breakout This strategy utilizes a channel indicator that constructs Pivot levels, W1 Pivot. The indicator paints in the chartweekly support and resistance levels, at the breakout of which you can make profits.First, let me specify what Pivot points are. A candlestick has a body and shadows. Shadows are the price highsand lows during a time period; the extreme values of the body are the opening and the closing prices. Pivot levelsare the price reversal levels that are calculated according to the following formula:R1 (resistance line) (Price*2) - min.R2 Price max - min.R3 max 2*(Price - min).S1 (support line) (Price*2) - max.R2 Price - max min.R3 min - 2*( max - Price)Price is the reference levels that is calculated like this: (max min close)/3, where max is the highest price duringa particular period, min is the lowest price, close is the closing price of the candlestick. This calculation method isthe classic one. There are other, original variants, like Woodie, Camarilla, DeMark etc. I suggest you test on yourown which calculation method provides the most accurate results. Please, do share your results in the comments!You can download the W1 Pivot indicator here. The strategy is suitable for any currency pair, the best timeframeis H1. W1 Pivot settings: fortsize 10, labelShift 0. However, the formulas are the same and you can’t changethem. Requirements for entering a trade in both directions:You set a pending Sell Stop order at level R3 10-20 pips. For less volatile currencies, you set stop at a shorterdistance.You set a pending Buy Stop order at level S3 10-20 pips, according to the same principle.It is important to choose the right distance for stop loss and pending orders, they shouldn’t be triggered byvolatility. A reference distance for stop losses is about 30-50 pips, the target profit may put at the same distance.
Although there are few losing trades, the signals are sent rather rarely. That is why you’d better apply thestrategy to multiple currency pairs or use a complementary tool.3. Forex strategy: Trading Dynamic TrendIt is a simple strategy but a dynamic one. It keeps the trader on the ropes. The matter is not just that you need tomonitor the trades and the signals all the time; it is rather that it sends quite many false signals. But a fewprofitable trades are sufficient to cover the loss and gain. High-frequency trading gets use of probability law: youmay enter one trade per day and get 100% of loss; but you can enter two trades and only 50% of them are losing.The more signals, the higher is the success chance.The Dynamic Trend indicator, utilized in the strategy, paints dynamic levels, levels that are constantly changing,following the price. Trades are entered almost all the time wit ha turnover. The currency pair is EUR/USD, thetimeframe is H1, but you may try changing it to M30. The indicator settings are Percent 15 (the percentage ofthe indicator deviation), MaxPeriod 50 (calculation period). You can download it here. Requirements for opening a long position:The price line has been below Dynamic Trend for some time.There emerged a rising signal candlestick that closes higher than the indicator (breakout of the dynamic level).You put an entry at the candlestick, following the signal one; stop loss is at a distance of 50-100 pips. After thetrade has yielded 50 pips of profit, you close one third of the position; after there are 100 pips of profit you closeanother third and protect the rest with a trailing stop. If the candlestick goes below
Requirements for opening a short position:The price line has been above Dynamic Trend for some time.There emerged a falling signal candlestick that closes lower than the indicator (breakout of the dynamic level).You open a position in a similar way. The trader needs fast response to the trade reversal in case of an error.However, you also need to keep in mind that the price may change its direction due to a correction; long stoplosses in this case are a risk for the trader. You may adjust the rules for exiting the trade or change the currencypair. You may also draw the trailing stop manually, although it will distract you monitoring the trades entered. Ioffer curios traders to compare this level indicator with other channel indicators, attaching, for example, Bollingerbands. I don’t think it makes any sense to add oscillators.Let’s sum up the information about channel trading strategies Trading channels is useful because channel strategies have a clear way of application. The trader needs to selectthe right indicator, currency pair, timeframe and a good moment. Some tips on this:Strategies of such type require constant monitoring. So, be prepared to spend quite much time on this.Avoid trading at the time of economic data releases, during the first two hours of Monday mad the last two hoursof Friday. Exit all trades before the weekend.Do not try to open as many positions as possible, you’d better follow the rule that it is better to enter fewertraders but enter better ones.Train yourself to “feel” the market. It is very seldom when all the conditions, price lines, and indicators signal thesame; so, it is important to take a reasonable risk.There are no perfect trading strategies; rather, there is a good combination of the market conditions, news andindicators. And, of course, you won’t succeed without professional experience. The more you learn differentkinds of trading tools and the more you experiment with them, the more you improve your intuition. Therefore, Irecommend you to learn about as many new indicators as you can, test them and gain experience on demoaccounts and don’t be afraid of risk. I wish you successful trading and share the article with your friends! I amreally looking forward to your comments, notes, ideas, and tips in the comments! Buy and sell and make profits!Useful links:
I recommend trying to trade with a reliable broker here. The system allows you to trade by yourself or copysuccessful traders from all across the globe.Telegram channel with high-quality analytics, Forex reviews, training articles, and other useful things for tradershttps://t.me/liteforexThe content of this article reflects the author’s opinion and does not necessarily reflect the official position ofLiteForex. The material published on this page is provided for informational purposes only and should not beconsidered as the provision of investment advice for the purposes of Directive --------------Follow us on
2. Trading strategy: Pivot levels breakout . This strategy utilizes a channel indicator that constructs Pivot levels, W1 Pivot. The indicator paints in the chart weekly support and resistance levels, at the breakout of which you can make profits. First, let me specify what Pivot points are. A candlestick has a body and shadows.