Transcription
Research ArticlePrediction of failures in the project management knowledge areasusing a machine learning approach for software companiesGizatie Desalegn Taye1· Yibelital Alemu Feleke2Received: 15 December 2021 / Accepted: 25 April 2022 The Author(s) 2022 OPENAbstractIn this paper we propose a novel machine-learning model to predict project management knowledge areas failurefor software companies using ten knowledge areas in project management based solely on the criteria of unambiguity, measurability, consistency, and practicability. The majority of software projects fail in software companies due toa lack of software project managers who are unfamiliar with the Project Management Knowledge Areas (PMKAs) thatare used without considering the company’s conditions or project contexts. By distributing questionnaires, we use anexperimental methodology and the snowball sampling method to collect data from software businesses. We employmachine learning techniques including Support Vector Machines (92.13%), Decision Trees (90%), K-Nearest Neighbors(87.64%), Logistic Regression (76.4%), and Naive Bayes (66%) to adapt data from failed software projects. When we lookat the results, Support Vector Machine outperforms the other four machine learning methods. High dimensional datais more efficient and contains nonlinear changes since Support Vector Machines deal with categorical data. The study’spurpose is to improve project quality and decrease software project failure. Finally, we recommend collecting more failedproject datasets from software businesses and comparing them to our findings to predict knowledge domain failure.Article highlights Compare and contrast the machine learning model’s Design a machine learning model to predict knowl-edge area failure in project management.performance. Evaluate the suggested machine learning model.Keywords Project management · Project Management Knowledge Areas · Project failure · Machine learning1 IntroductionAn established software company’s goal is to sell softwareproducts and profit from them. A project is a short-termundertaking that results in a unique deliverable [1]. Theobjectives of project management including initiating,planning, executing, regulating, and closing projects, aswell as controlling the operations of the project teamwithin the defined time, scope, budget, and quality standards to achieve all agreed goals and software project management refers to the scheduling, planning, resource allocation, and execution [2]. There are ten software ProjectManagement Knowledge Areas (PMKAs). These are Project Integration Management (PIM), Project Scope Management (PSM), Project Time Management (PTM), ProjectCost Management (PCM), Project Quality Management* Gizatie Desalegn Taye, gizatied2004@gmail.com 1Department of Computer Science, Faculty of Technology, Debre Tabor University,Debre Tabor, Ethiopia. 2Department of Database Administration, Amhara National Regional State Labour and Training Bureau, Bahir Dar,Ethiopia.SN Applied Sciences(2022) 4:165 23456789)
Research ArticleSN Applied Sciences(2022) 4:165(PQM), Project Human Resource Management (PHRM),Project Risk Management (PRM), Project ProcurementsManagement (PPM), Project Communications Management (PCCM), and Project Stakeholders Management(PSTM) [1]. The problems that cause software projectfailures are poor planning, lack of leadership, problemswith people, vague or changing requirements, life cycleproblems, inefficient communication process, inadequatefunding, little attention to approval of stakeholders, lack ofschedule, missed deadlines, due to the hiring of unqualified project manager. As a result, the research’s goal is toforecast knowledge areas of project management failuresfor software firms. We develop a model based on machinelearning that helps software project managers predict thefailed knowledge areas that best fit the current situation(problem domain (failed motives), company characteristics, project size, indispensable nature of the project,the nature of the opportunities, and the methodologythat follows). Improving the efficiency and maintainingthe sustainability of a software project are obstacles thatproject managers face. The probability of project failureis generally due to a lack of knowledge, skills, resources,and technology during project implementation [3, 4]. Thestudy answers the following research questions.1. How do we design a machine learning model that predicts project management knowledge area failure?2. Which machine learning techniques are the mosteffective for predicting project management knowledge areas failure?3. How well does our model predict project managementfailure in terms of knowledge areas?The study would reduce the amount of time, and effortwas given would spend money (for the project managers, and software companies) to predict the failure of theknowledge areas. However, every software project is different and unique [5]. According to [6] described that asoftware company faces different challenges betweenfunding, team building, and ideation to attract talentat a very early stage. Starting from this idea, the studyfocuses on identifying the reasons behind wariness anduncertainty in organizations. The authors [7] carriedout identifies and categorizes the software engineeringProject Management Knowledge Areas (PMKAs) used insoftware companies to map the state of the art using asystematic study method of literature mapping with theapplication of snowball sampling to evaluate the SoftwareEngineering Body of Knowledge (SWEBOK) characterizesthe content of the software engineering discipline andpromotes a consistent view of software engineering. OurVol:.(1234567890) https://doi.org/10.1007/s42452-022-05051-7work makes predictions not only statistics. The study presented by the Project Management Institute (PMI) identifies new domains of knowledge that contain a process tobe followed for effective project management and project managers must have knowledge and skills in eachof these areas or have specialists who can assist in theseareas like some large projects have dedicated schedulecoordinators, risk managers, communication specialists, orprocurement contract officers. The authors [1] described acompetent and knowledgeable project manager is vital toproject success. The researchers evaluate the ten projectmanagement knowledge areas in service industries andmanufacturing using the Analytic Hierarchy Process (AHP)and the Absolute Degree Grey Incidence Analysis (ADGIA)model. Both models have the result that project qualitymanagement is the most important knowledge area andalso most strongly related to project communication management and least strongly related to project integrationmanagement but the literature has a gap.The authors [8] focus on behavioral advertisement analysis, such as an individual’s preferences, buying habits, orhobbies, and will employ machine-learning approaches toidentify and successfully execute targeted advertising usingdata that reflects the user’s retail activity. By building a uniqueframework that uses a classification model through streaming technologies, and produces a multi-class classier to provide sector-based classification. To improve the accuracyof the model prediction task, the method uses a structuredapproach and multiple ensemble techniques. To forecast failure, we employed a multiclass classifier in our research. Theauthors [9] provided a framework for value realization. Universities must assess learning analytics (LA’s) strategic role andspend carefully on the following criteria like high-quality data,analytical tools, knowledgeable people that are up to date ontechnology, and data-driven prospects for learning improvement. In our research, we used the four criteria to select attributes for prediction. The authors [10] investigated an efficientalgorithm for predicting software reliability using a hybridapproach known as Neuro-Fuzzy Inference System, whichwas also applied to test data for software reliability predictionusing complexity, changeability, and portability parameters insoftware development as input for the Fuzzy Inference System.After testing and training real-time data, forecast reliability interms of mean relative error and mean absolute relative error.The study’s findings are verified by comparing them to otherstate-of-the-art soft computing techniques.From the above-mentioned related work, they have thefollowing gaps in general. To begin with, the majority ofresearch does not focus on making predictions. Second, theabove-mentioned related works are carried out in the automotive supply sector, manufacturing, and non-governmental
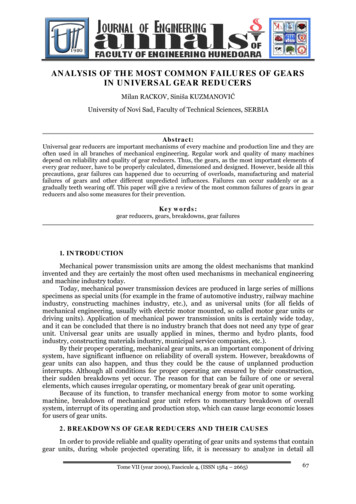
SN Applied Sciences(2022) 4:165 tions (NGOs). Third, they employed a different methodthan we did in our research. As a result, we focused our investigation on software companies. In Ethiopia, most software firmshave inexperienced, unsuccessful, and less skilled project managers as compared to other experienced corporate projects.Third, when to add or reduce the criteria influence on the project management knowledge areas is self-evident. As a result,we added more factors to the mix. Finally, the datasets that areassociated with them are quite modest. As a result, the outputis hurried. So, we prepared the dataset as much as feasible.The introduction section comes to a close with thisparagraph. In Sect. 2, we look at the methodologies,which include everything from using datasets to predicting failed project management, as well as the design ofthe suggested model, data preparation, and the confusion matrices for calculating performance measures. Theresults, validation of the model, and discussion highlightsof the performance metrics of the findings are presentedin Sect. 3, and the paper is concluded with the possibilityof future extension of this work.2 MethodologyThe research is based on experiments. Experimentalresearch is a collection of research designs that employmanipulation and controlled testing to gain a betterunderstanding of entire processes that predict outcomesdepending on certain criteria. As a result, the followingmethods and techniques are employed to complete thisstudy.2.1 The designed proposed prediction modelThe general description of the prediction failure model forproject management knowledge areas in software companies is given in Fig. 1. The model has five major phases;The first phase is the failure of project data collectedfrom software development companies, the second phaseis data pre-processing, which serves to refine our datacleansing, feature selection, data transformation, and datareduction tasks, the third phase consists of implementing the selected algorithms like Support Vector Machine(SVM), Decision Trees (DT), Naïve Bayes (NB), LogisticRegression (LR), and K-Nearest Neighbors (KNN), the fourthstep is to perform data analysis and evaluation to calculateusing the chosen data and the efficiency of the proposedmodels made by the accuracy, precision, F1-score, andrecall of each algorithm, the fifth and final step is the endof our work, which consists of analyzing and drawing conclusions based on the graphical and aggregated experimental result. In addition, we can see in Fig. 1 that eachcomponent in the model is interconnected and sequential.Research Article2.2 Data collection and dataset preparationWe used a questionnaire to gather data from target software companies for this study, and we produced datafound by project managers working for software companies in Ethiopia. The dataset included eighteen attributesclassified into three groups (project manager, project context, and business situations) that influence the predictionfailure of the knowledge areas in project management,and are collected, and prepared based on the criteria ofunambiguity, consistency, practicability, and measurability[11].There are ten knowledge areas or output classes, asindicated in Table 1, namely, PCCM, PCM, PHRM, PIM, PPM,PQM, PRM, PSTM, PSM, PTM and its failure values for eachclass is 48, 76, 45, 82, 40, 21,27,36,42,26 out of 443 totaldatasets. For prediction, we employed multiclass methods.Row failed project data: are produced based on thequestionnaires from software companies. Processingfailed project row data: The gathered row failed projectdata should be processed for three reasons: missing valuesshould be fixed, data should be standardized, and variablesets should be optimized.2.2.1 Analyzing attributes2.2.1.1 Unambiguity Each attribute should have itsmeaning. Each attribute is subject to one and only oneinterpretation. The possible values are yes (Y) and no (N).Ambiguous attributes not selected.2.2.1.2 Consistency Each attribute should be independent of the others. There are three possible values: high (H),medium (M), and low (L). The attributes with the highestconsistency value were chosen.2.2.1.3 Measurability Each attribute should be assigned avalue based on the metric. There are three possible values:high (H), medium (M), and low (L). Attributes with higherease of measurability were chosen.2.2.1.4 Practicability Each attribute should be feasible inthe sense of a particular (sudden) project. There are threepossible values: high (H), medium (M), and low (L). Attributes with higher feasibility or practicability were chosen.There are three possible values in Table 2: High (H),Medium (M), and Low (L). The final list of criteria includedan attribute with a higher level of practicability. A characteristic may be added or removed from the final list ofinfluential attributes based on the aforementioned criteria[11]. As a result, nine attributes were chosen as the inputfor machine learning from 18 preliminary lists of attributes.The project manager has four attributes, three of whichVol.:(0123456789)
Research ArticleSN Applied Sciences(2022) 4:165 https://doi.org/10.1007/s42452-022-05051-7Fig. 1 The proposed modelTable 1 Project management knowledge areas failures after annotating the dataKnowledge areasNo of annotated dataProject Communications Management (PCCM)Project Cost Management (PCM)Project Human Resource Management (PHRM)Project Integration Management (PIM)Project Procurements Management (PPM)Project Quality Management (PQM)Project Risk Management (PRM)Project Stakeholders Management (PSTM)Project Scope Management (PSM)Project Time Management are related to the project’s context and the remaining twoto the nature of the company’s situation. Table 2 showsthe list of attributes and their results ("P" denotes selectedattributes that made it into the final list of attributes, while"F" denotes unselected attributes that did not make it intothe final list of attributes).2.3 Data preprocessingThe information on failed projects was gathered fromsoftware companies. As a result, data preprocessing hasbeen completed, which includes data cleansing, duplicatevalue removal, null value detection, rectification, and balancing. This is where the preprocessing mapping is finished. Because we collect data from a variety of sources,data integration has become a crucial part of the process.We need to make a condensed version of the dataset that
SN Applied Sciences(2022) 4:165Research Article https://doi.org/10.1007/s42452-022-05051-7Table 2 Identified attributes with their description and selected attribute using four criteriaFactorsAttributesCriteria in order of its unambi- Result References Descriptionsguity, consistency, measurability, and practicabilityProject ManagerEducation LevelYHHHP[11]ExperienceYLMMF[12]Knowhow of the PMKAsYMMMP[13]Decision makerYMLLF[13]Relevant JobYMMMP[14]Education BackgroundYHHHP[11]NMMLF[11]Size of the projectYMMLF[11]BudgetYLMMF[15]Reasons for failedYMMMDevelopment model followed YMMMPP[1][1]Requirement elicitation Technique FollowedYMMMP[1]Number of functionalitiesNLHMF[13]Context of the project ComplexityThe act of doing and seeingthings, as well as the act ofmaking things happen to you.The amount of time you havespent on a particular task.: theability or experience you haveacquired from doing something (such as a particular job)Your major and the degree youreceivedIs it a term for practicalknowledge about how to dosomething?Someone who makes decisions, especially at a highlevel in an organization. Astrategic decision-maker maybe in charge of acquisitions,company growth, or capitalinvestmentThe job you want in terms ofthe required skills or knowledgeThe highest grade obtained,or whether the individualhas a secondary school (highschool) diploma or equivalency certificateA factor that plays a role in acomplex process or circumstanceA broad term is used to definethe project’s overall scopeA forecast of sales and expenditures for a future periodAnswers why the project failed?The steps that take place after aproject are completedObtaining information about asystem’s specifications fromusers, consumers, and otherstakeholdersThe condition of making aprofit or gaining moneyVol.:(0123456789)
Research ArticleSN Applied Sciences(2022) 4:165 https://doi.org/10.1007/s42452-022-05051-7Table 2 (continued)FactorsAttributesCriteria in order of its unambi- Result References Descriptionsguity, consistency, measurability, and practicabilityProfitabilityYMMMP[13]In the minds of its target customers, a brand occupiesProper positioningYLMMF[13]Being one of a kind is a desirable attributeUniquenessNLMMF[1]The consistency of beingpersuasiveCredibilityNMMLF[13]The opportunity to take advantage of a deal or circumstancethat may lead to a favorableoutcomeMarket situationsYMMHP[13]The marketing plans in placeand expectations for thefutureis smaller in size but retains the original’s integrity. Datapreparation is the process of transforming data into a format suitable for data modeling, such as converting character values to binary values.The train test split technique is used to measure theperformance of machine learning algorithms that makepredictions on data that was not used to train the model. A training data set is a set of data that is used to fit a2.3.2 Model evaluationThis activity is in charge of describing the evaluationparameters of the designed model and its results. Thecomparison was made between the data categorized bythe proposed model system and the manually labeled(categorized) data. Having a common performanceappraisal metric for classification and classification accuracy (CA) is used as the final proof of performance.machine learning model. Test data set—used to assess the machine learningmodel’s fit.The purpose of splitting the dataset is to assess themachine learning model’s performance on new data thathasn’t been used to train the model. This is how we hopeto use the model in practice. That is, to fit it to existingdata with known inputs and outputs, and then make predictions about future events where we do not have theexpected output or target values.2.3.1 Experimental methodsThe experimental methods are mainly aimed at achieving, identifying, and visualizing what factors contributeto project managers and building a prediction modelthat executes a project whether or not the failed projectmanagement knowledge areas were based on the performance of the model.2.3.2.1 Confusion matrix The confusion matrix assessesthe performance of a classification or classifier modelon a test dataset. Our target class was multiclass, whichmeans classification tasks that have more than two classlabels. So, our target class has ten labels that are 10X10arrays.The performance of a classification model is defined bya confusion matrix.True positives (TP): cases where the classifier predictedthat the true and correct class was true.True negatives (TN): cases in which the model predictedthe false and correct class was false.False positives (FP) (type I error) - Classes predicted truebut the correct class was false.False negatives (FN) (type II error): The classifier predicted false but the correct class was false.2.3.3 AccuracyAccuracy means the number of all misclassified samplesdivided by the total number of samples in the dataset.Accuracy has the best value of one and the worst valueof zero.Vol:.(1234567890)
SN Applied SciencesAccuracy (2022) 4:165(TP TN)(TP TN FP FN) PrecisionPrecision (P)—precision is the fraction or percentage ofidentified or retrieved instances that the classificationalgorithm considers important. High precision meansthat most items labeled, for example, as "positive" actually belong to the class "positive" and is defined as precision characterized as the number of isolated true positivestimes the total sum of true positives and false positives.Precision TP(TP FP)(2)2.3.5 RecallA recall is considered a measure of completeness, which isthe level of positive examples that are marked as positive.Cluster revision is characterized by the number of isolatedtrue positives times the total number of components thathave a place with the positive classes.Recall TP(TP FN)(3)2.3.6 F1 scoreF-Measure (F1 score) is defined as the harmonic meansof precision and recall which is a measure that joins recalland precision into a single measure of performance. TheF1-score was calculated by averaging precision and recall.The relative contribution of precision and recall to theF1-score are equal.F1 - score 2 (Precision*Recall)(Precision Recall)(4)3 Results and discussionExperimentation is recognized to necessitate the preparation of a dataset for training and testing purposes, as thereis no free, ready-to-use dataset available on the Internet.We used 19 software companies in this study, which tookthe dataset and split it into three categories based on nineattributes (project manager, project context, and companysituations). The collection has 443 records with 9 attributes. The remaining 20% was utilized to test the proposedmodel, with 80% being used to train the model.Research Article3.1 Experimental results and analysisAfter importing the necessary python modules and libraries, the second immediate task is to read the processeddata frame (df ) in pythons and check the importedrows. The ID, project manager name, education label,educational experience, relevant work, company name,knowledge about project management knowledge areas(PMKAs), model of development followed, the techniqueof obtaining requirements followed by market situations,the profitability of the company, reasons for failure andclass. From those IDs, the project manager name andproject name are not required for the study as the valueof each attribute removed the remaining unique valuesdisplayed.Feature engineering—the main goal of feature engineering is to add features that are likely to have an impacton the failed project dataset. The fundamental step in feature engineering is to split the training and test datasets.Out of the 443 rows in the dataset, we used 354 rows fortraining and 89 rows for tests. Because our datasets aresmall, we have demonstrated that the data split for training data is high, as high training data and low-test dataare recommended for small datasets to get good accuracy.3.1.1 Results of each prediction algorithmWe employed five methods to predict the failure of theproject management knowledge areas in our experiment.K-Nearest Neighbors (KNN), Decision Trees (DT), LogisticRegression (LR), Naive Bayes (NB), and Support VectorMachines (SVM) are all examples of machine learningalgorithms.3.1.1.1 K‑nearest neighbors (KNN) prediction algorithmresults and analysis We started building a K-NearestNeighbors model to predict knowledge area failures insoftware companies after finalizing the data transformation and splitting the train test. The model result is presented in Table 3, we have got the weighted averageF1-Score with an accuracy of 87.64%. The values listed inthe Support column are classified in the test data into 10classes.3.1.1.2 Decision trees prediction algorithm results and anal‑ysis As we can see from the confusion matrix report inTable 4, we have got a 90% weighted average accuracy ofF1-Score for the decision tree algorithm.3.1.1.3 Logistic regression prediction algorithm resultsand analysis The performance measures we haveobtained during Logistic Regression findings using theVol.:(0123456789)
Research ArticleSN Applied Sciences(2022) 4:165Table 3 K-Nearest Neighbors (KNN) result using the 3456789AccuracyMacro averageWeighted 60.877181412934877898989 https://doi.org/10.1007/s42452-022-05051-7Table 5 Logistic regression (LR) result using the confusion curacyMacro averageWeighted 20.767181412934877898989Table 6 Naïve Bayes (NB) result using the confusion matrixTable 4 Decision Tree (DT) result using the Confusion curacyMacro averageWeighted 80.907181412934877898989testing set are given in Table 5. Here, we achieve the performance of 76.40% weighted average F1-Score.3.1.1.4 Results and analysis of the naïve bayes predictionalgorithm The performance measures we have obtainedduring Naïve Bayes findings using the testing set aregiven in Table 6. Here, we achieve the performance of 66%weighted average F1-Score.3.1.1.5 Support vector machine prediction algorithmresults and analysis The performance of the Support Vector Machine (SVM) model was also evaluated using thetesting set and the obtained performance measures aregiven in Table 7. From the performance report, we can seethat the SVM model achieves a 92.13% weighted F1-scoreSupport0123456789AccuracyMacro averageWeighted 10.667181412934877898989Table 7 Support vector machine (SVM) result using the 3456789AccuracyMacro averageWeighted 20.927181412934877898989
SN Applied Sciences(2022) 4:165 https://doi.org/10.1007/s42452-022-05051-73.2 Validation of the modelValidation ensures the model does not overfit or underfitduring the training process. To prevent the model fromlearning too much or too little from the training set, adropout layer or early stopping can be added. When amodel learns too much on the training set, it performswell in the training phase but fails miserably in the testingphase. In data it has never seen before, it performs poorly.The accuracy of training is high, but the accuracy of testing is extremely low. Here is the validation for our model.Visualizing the training vs. validation accuracy over anumber of epochs is an excellent approach to see if themodel has been properly trained. This is necessary toensure that the model is not undertrained or overtrainedto the point that it begins to memorize the training data,reducing its capacity to predict effectively. We employedearly Stopping and epocs 100 in our model in Fig. 2, withnine attributes as the input layer, two hidden layers, andten classes as the output layer. Early Stopping entails keeping track of the loss on both the training and validationdatasets (a subset of the training set not used to fit themodel). The training process can be interrupted as soonas the validation set’s loss begins to exhibit evidence ofoverfitting. We’ve increased the number of epochs and arecertain that training will finish as soon as the model beginstoo overfit. From the plot of accuracy, as given in Fig. 2,we can see that the model could probably be trained alittle more as the trend for accuracy on both datasets isstill rising for the last few epochs. We can also see thatthe model has not yet over-learned the training dataset,showing comparable skills on both datasets.From the plot of loss, we can see that the model hascomparable performance on both train and validationdatasets (labeled test). If these parallel plots start to departconsistently, it might be a sign to stop training at an earlierResearch Articleepoch. The validation loss is constantly reduced throughout the training procedures, as given in Fig. 3, indicatingthat there is no overfitting.3.3 Discussion of the resultsTable 8 shows, that the Support Vector Machine has stoodout due to its prediction accuracy.First experiment: In the findings of the confusion matrixof the test data for the K-Nearest Neighbors (KNN) prediction model, which is presented in Table 8, 78 of them werecorrectly identified and the remaining 11 were mistakenlyclassified. Finally, K-Nearest Neighbors (KNN) was shownto be 87.64% accurate.Second experiment: In the findings of the confusionmatrix of the test data for the Decision Tree (DT) prediction model, which is presented in Table 8, 80 of them werecorrectly identified and the remaining 9 were mistakenlyclassified. Finally, Decision Trees (DT) were able to reachan accuracy of 90%.Third experiment: In the findings of the confusionmatrix of the test data for the Logistic Regression (LR)prediction model, which is illustrated in Table 8, 68 ofthem were correctly identified and the remaining 21 weremistakenly classified. Finally, the accuracy of the LogisticRegression (LR) was
Keywords Project management · Project Management Knowledge Areas · Project failure · Machine learning 1 Introduction An established software company's goal is to sell software products and prot from them. A project is a short-term undertaking that results in a unique deliverable []. The 1 objectives of project management including initiating,