Transcription
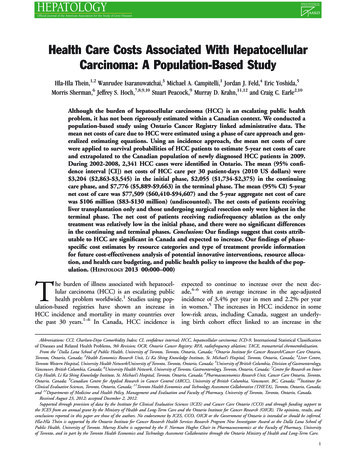
Health Care Costs Associated With HepatocellularCarcinoma: A Population-Based StudyHla-Hla Thein,1,2 Wanrudee Isaranuwatchai,3 Michael A. Campitelli,1 Jordan J. Feld,4 Eric Yoshida,5Morris Sherman,6 Jeffrey S. Hoch,7,8,9,10 Stuart Peacock,9 Murray D. Krahn,11,12 and Craig C. Earle2,10Although the burden of hepatocellular carcinoma (HCC) is an escalating public healthproblem, it has not been rigorously estimated within a Canadian context. We conducted apopulation-based study using Ontario Cancer Registry linked administrative data. Themean net costs of care due to HCC were estimated using a phase of care approach and generalized estimating equations. Using an incidence approach, the mean net costs of carewere applied to survival probabilities of HCC patients to estimate 5-year net costs of careand extrapolated to the Canadian population of newly diagnosed HCC patients in 2009.During 2002-2008, 2,341 HCC cases were identified in Ontario. The mean (95% confidence interval [CI]) net costs of HCC care per 30 patient-days (2010 US dollars) were 3,204 ( 2,863- 3,545) in the initial phase, 2,055 ( 1,734- 2,375) in the continuingcare phase, and 7,776 ( 5,889- 9,663) in the terminal phase. The mean (95% CI) 5-yearnet cost of care was 77,509 ( 60,410- 94,607) and the 5-year aggregate net cost of carewas 106 million ( 83- 130 million) (undiscounted). The net costs of patients receivingliver transplantation only and those undergoing surgical resection only were highest in theterminal phase. The net cost of patients receiving radiofrequency ablation as the onlytreatment was relatively low in the initial phase, and there were no significant differencesin the continuing and terminal phases. Conclusion: Our findings suggest that costs attributable to HCC are significant in Canada and expected to increase. Our findings of phasespecific cost estimates by resource categories and type of treatment provide informationfor future cost-effectiveness analysis of potential innovative interventions, resource allocation, and health care budgeting, and public health policy to improve the health of the population. (HEPATOLOGY 2013 00:000–000)The burden of illness associated with hepatocellular carcinoma (HCC) is an escalating publichealth problem worldwide.1 Studies using population-based registries have shown an increase inHCC incidence and mortality in many countries overthe past 30 years.1–6 In Canada, HCC incidence isexpected to continue to increase over the next decade,4–6 with an average increase in the age-adjustedincidence of 3.4% per year in men and 2.2% per yearin women.5 The increases in HCC incidence in somelow-risk areas, including Canada, suggest an underlying birth cohort effect linked to an increase in theAbbreviations: CCI, Charlson-Deyo Comorbidity Index; CI, confidence interval; HCC, hepatocellular carcinoma; ICD-9, International Statistical Classificationof Diseases and Related Health Problems, 9th Revision; OCR, Ontario Cancer Registry; RFA, radiofrequency ablation; TACE, transarterial chemoembolization.From the 1Dalla Lana School of Public Health, University of Toronto, Toronto, Ontario, Canada; 2Ontario Institute for Cancer Research/Cancer Care Ontario,Toronto, Ontario, Canada; 3Health Economics Research Unit, Li Ka Shing Knowledge Institute, St. Michael’s Hospital, Toronto, Ontario, Canada; 4Liver Centre,Toronto Western Hospital, University Health Network/University of Toronto, Toronto, Ontario, Canada; 5University of British Columbia, Division of Gastroenterology,Vancouver, British Columbia, Canada; 6University Health Network, University of Toronto, Gastroenterology, Toronto, Ontario, Canada; 7Centre for Research on InnerCity Health, Li Ka Shing Knowledge Institute, St. Michael’s Hospital, Toronto, Ontario, Canada; 8Pharmacoeconomics Research Unit, Cancer Care Ontario, Toronto,Ontario, Canada; 9Canadian Centre for Applied Research in Cancer Control (ARCC), University of British Columbia, Vancouver, BC, Canada; 10Institute forClinical Evaluative Sciences, Toronto, Ontario, Canada; 11Toronto Health Economics and Technology Assessment Collaborative (THETA), Toronto, Ontario, Canada;and 12Departments of Medicine and Health Policy, Management and Evaluation and Faculty of Pharmacy, University of Toronto, Toronto, Ontario, Canada.Received August 23, 2012; accepted December 2, 2012.Supported through provision of data by the Institute for Clinical Evaluative Sciences (ICES) and Cancer Care Ontario (CCO) and through funding support tothe ICES from an annual grant by the Ministry of Health and Long-Term Care and the Ontario Institute for Cancer Research (OICR). The opinions, results, andconclusions reported in this paper are those of the authors. No endorsement by ICES, CCO, OICR or the Government of Ontario is intended or should be inferred.Hla-Hla Thein is supported by the Ontario Institute for Cancer Research Health Services Research Program New Investigator Award at the Dalla Lana School ofPublic Health, University of Toronto. Murray Krahn is supported by the F. Norman Hughes Chair in Pharmacoeconomics at the Faculty of Pharmacy, Universityof Toronto, and in part by the Toronto Health Economics and Technology Assessment Collaborative through the Ontario Ministry of Health and Long-Term Care.1
2THEIN ET AL.incidence or prevalence of hepatitis C, immigration ofpeople from countries with a high prevalence of hepatitis B and C, obesity, and diabetes mellitus.1,2,6,7 Historically, HCC is rarely diagnosed in its early stagesand has limited treatment options for its advancedstage, which leads to relatively short survival.8–10The increase in HCC incidence creates a greaterdemand for diagnosis, care, and treatment. Becausetreatments are improving and likely benefiting morepeople with HCC,3,10,11 determining the economicburden of illness, determining how health care resources are expended, and estimating long-term costs usinga phase of care approach12–16 are all important in theplanning of cancer control programs and priority-setting decisions. Although several Canadian studies haveevaluated the economic burden for non-HCC malignancies,17–24 representative cost data are needed foruse in cost-effectiveness analysis of innovative technologies aimed at prevention and early detection ofHCC. Our objectives were to: (1) estimate the phasespecific health care costs attributable to HCC using aphase of care approach to costing; (2) estimate the5-year net costs of HCC care using an incidenceapproach13,16,25; and (3) estimate the aggregate 5-yearnet costs of HCC care in the Canadian population.Patients and MethodsFull details of methodological descriptions regardingdata sources, estimation of health care costs associatedwith HCC, and 5-year net costs of HCC care can befound in the Supporting Information.Study Design. We conducted a population-basedretrospective cohort study using Ontario Cancer Registry (OCR) linked administrative data and a referenceOntario population to estimate the net costs of carefor HCC from January 1, 2002, through December31, 2008. Individuals were followed from the day ofdiagnosis until death or until 12 months after the endof the study period to capture deaths. The studydesign included three key elements. The first elementHEPATOLOGY, Month 2013was a phase of care (initial, continuing care, and terminal phases) approach to costing.12–16 The initial phaseof cancer care includes services normally providedwithin the first few months at the time of diagnosis,which commonly include diagnostic services and curative treatments.14 The continuing care phase includessurveillance activities for detecting recurrences, medications to prevent cancer recurrence, and treatment ofcomplications deriving from the initial therapy. Theterminal phase applies to care received at the end oflife, often palliative in nature.14 The second elementwas an estimation of the net costs of care due to HCC(difference between the mean costs for HCC patientsand for matched controls without HCC).15 The thirdelement was a construction of estimates of the 5-yearnet costs of care due to HCC (using an incidenceapproach estimating cumulative costs from the date ofdiagnosis to death and by aggregating the costs of thethree phases).13,16,25 Approval for the study wasgranted by the University of Toronto Health SciencesResearch Ethics Board.Study Population. The study population includedall diagnosed cases of HCC in Ontario recorded in theOCR between January 1, 2002, and December 31,2008, in individuals aged 18 years who did not havea second cancer. We used the International StatisticalClassification of Diseases and Related Health Problems,9th Revision (ICD-9) site code 155.0 and the International Classification of Diseases for Oncology, 3rd Editionhistology codes 8170-8175 to identify cases of HCC.Selection criteria for the patient sample are summarized in Supporting Table 1. Potential controls wereselected from a 5% random sample of the referenceOntario population database (Registered Persons Database), including all persons with unique health cardnumbers registered for the purposes of Ontario healthinsurance coverage and Ontario drug benefits. All eligible controls were persons aged 18 years who did nothave a diagnosis of HCC.Residents of Ontario with a valid health card haveaccess to health services within a universal, publicallyThis work was presented in part at the Canadian Cancer Research Conference, November 2011, Toronto, Canada (poster presentation); the CanadianSymposium on Hepatitis C Virus, February 2012, Montreal, Canada (oral presentation); the Ontario Institute for Cancer Research and Cancer Care Ontario,Health Services Research Program 4th Annual Meeting, May 2012, Toronto, Canada (poster presentation); and the 2012 Canadian Association for HealthServices and Policy Research conference, Montreal, Canada (oral presentation). It was also accepted for a poster presentation at the American Association for theStudy of Liver Diseases in November 2012.Address reprint requests to: Hla-Hla Thein, Dalla Lana School of Public Health, University of Toronto, 155 College Street, 5th Floor, Room 560, Toronto,Ontario M5T 3M7, Canada. E-mail: rosie.thein@utoronto.ca; fax: 416-978-7735.C 2013 by the American Association for the Study of Liver Diseases.Copyright VView this article online at wileyonlinelibrary.com.DOI 10.1002/hep.26231Potential conflict of interest: Nothing to report.Additional Supporting Information may be found in the online version of this article.
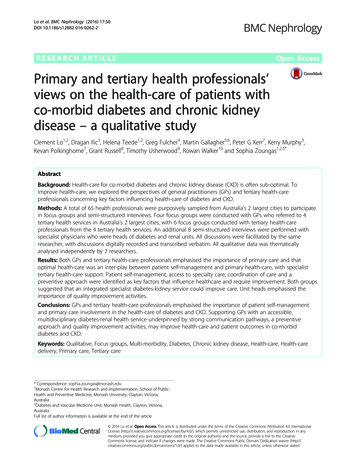
HEPATOLOGY, Vol. 000, No. 000, 2013THEIN ET AL.3Table 1. Characteristics of Individuals With HCC by Year of DiagnosisTreatment in Year After Diagnosis, %Survival After Diagnosis, %Yearn% Aged 60 Years% Aged 80 Years% withCCI therapySorafenib*1 Year3 Years5 n: NA, not applicable.*Sorafenib was approved by Health Canada in late 2007.funded health care system administered by the OntarioMinistry of Health and Long-Term Care. Althoughthere are certain exceptions within the different services, the system provides free access to hospital andemergency room visits, physician services, home care,copayments for long-term care placements, and prescription medications for those aged 65 years.Data Sources. The OCR is a population-based tumor registry consisting of information on all new casesof cancer in Ontario (except non-melanoma skin cancers) since 1964. Using the perspective of the OntarioMinistry of Health and Long-Term Care, direct medicalcosts were determined. Costs associated with outpatientvisits in Ontario were determined from the Physician’sClaims History Database of the Ontario Health Insurance Plan. The Canadian Institute for Health Information Discharge Abstract Database was used to estimatecomorbidity,26–28 frequency and type of hospital admissions, length of stay, and in-hospital mortality. Costsassociated with radiofrequency ablation (RFA), surgicalresection, liver transplantation, transarterial chemoembolization (TACE), percutaneous ethanol injection,chemotherapy, and sorafenib were determined using theCanadian Institute for Health Information and OntarioHealth Insurance Plan databases. Costs for emergencyroom visits and same-day surgery were determinedusing the National Ambulatory Care Reporting SystemDatabase. Medication costs were obtained from the Ontario Drug Benefit Program Database. Costs associatedwith home care, continuing care, and long-term carewere determined using the Ontario Home Care Database, Continuing Care Reporting System, and OntarioDrug Benefit Program Database.Phases of Cancer Care. To determine the durationof the initial phase and the terminal phase of ourlinked cohort, we performed a joinpoint regression ofthe log-linear trends in the average cost of HCC careper 30 patient-days from HCC diagnosis to death.29,30This allows the identification, through regression modelling of the observed data, of the points at which statistically significant changes occur in the slope of the longitudinal cost function.30 This suggested that asignificant trend started to emerge 3 months prior toHCC diagnosis and declined 1 month after diagnosis.Models of patients surviving 3, 6, 12, and 86 monthsafter diagnosis of HCC showed that all four cohortshad markedly increased average total cost per 30patient-days in the months leading up to diagnosis,with very high costs in the month of diagnosis, anddecreased costs after diagnosis (Fig. 1). For 6-, 12-, and86-month survivors, costs gradually increased again asthe month of death approached although there was nosignificant trend. Based on these findings, we definedthe phases of care as follows: initial phase, between 3months prior to HCC diagnosis and 1 month after diagnosis; terminal phase, 6 months preceding death; andcontinuing care phase, the intermediate observationtime. For instance: for patients who died within 1month after diagnosis of HCC, the costs for 3 monthsbefore diagnosis were attributed to the initial phase andthe costs within 1 month after diagnosis were attributedFig. 1. Joinpoint regression of the log-linear trends in the averagetotal cost per 30 patient-days from 3 months before diagnosis todeath for persons surviving 3 (black solid line), 6 (black dashed line),12 (black dotted line), and 86 (gray solid line) months after diagnosisof HCC.
4THEIN ET AL.to the terminal phase; for patients who died 7 monthsafter diagnosis, the costs for 3 months before diagnosisand 1 month after diagnosis were attributed to the initial phase and the remaining costs after diagnosis wereattributed to the terminal phase. For patients who didnot die during the study period, all observation time(and costs) was sequentially allocated to the initial andcontinuing care phases.13 For costing purposes, all incident cases were referred to as cohort 1 (the incidentcohort) and the incident cases who died were referredto as cohort 2 (the death cohort).Matching Cases and Controls. The ‘‘net cost’’method12,15 involves matching cases and controls onsocio-demographic and clinical factors associated withresource use. For each case and control, we calculatedthe income quintile,31 Charlson-Deyo ComorbidityIndex (CCI),26,27 and propensity score.32,33 Thehousehold neighborhood income was calculated usingthe Statistics Canada Postal Code Conversion file andthe 2001 and 2006 Canadian census data. The firstquintile represents the lower 20% of neighborhoodswith the poorest median neighborhood income. Thefifth quintile represents the upper 20% of neighborhoods with the most affluent median neighborhoodincome.31 The CCI was calculated using the methodsdescribed by Charlson et al.26 and Deyo et al.,27applying an ICD-9 coding algorithm to the 14 diagnostic field codes in our hospitalization data (excludingdiagnoses for liver disease and metastatic cancer). Baseline comorbidity was determined using the hospitalization record at diagnosis date. Conditions wereweighted and then summed up to provide an overallCCI which reflected the number and severity ofcomorbid diseases reflecting the cumulative increasedlikelihood of 1-year mortality. The summed weightsfor a given episode were then categorized into one offive groups (CCI of 0, 1, 2, 3, or no hospital record)representing different degrees of comorbidity. If casesdid not have a hospitalization record at diagnosis date,we determined baseline comorbidity by looking back 2years into the hospitalization data to find the mostrecent hospitalization record and applying the CCIfrom that hospitalization.28 Patients were assigned ashaving a missing CCI at baseline if they had no hospitalization records at diagnosis or 2 years prior to diagnosis. The propensity score for an individual is theconditional probability of assignment to a diagnosis ofHCC given the observed individual covariates.32,33This was derived by fitting a logistic model with HCCstatus as dependent variable and the index year, age,sex, income quintile, rurality, CCI, and the interactionbetween age and comorbidity as independent variables.HEPATOLOGY, Month 2013We performed matching for each cohort using twosets of cases and controls: in cohort 1, all cases werematched 1:1 to controls to estimate costs for the initialand continuing care phases; and in cohort 2, caseswho died as a result of HCC were matched 1:1 tocontrols who died from other causes to estimate costsfor the terminal phase. For each case, the closest nonHCC control was selected that matched the followingcriteria: age 610 years at the index date; same sex;diagnosed in the same year; CCI, and a propensityscore within a caliper width (i.e., the difference in propensity scores between matched cases and controls differs by at most a fixed distance) of 0.2 SD.34Estimation of Health Care Costs Associated WithHCC. Because of regional variations in reimbursements, the median 2008 cost for each physician andlaboratory service fee code was used to estimate outpatient costs. The mean costs of hospitalization, emergency room visits, and same-day surgery for a particular year were estimated using the Resource IntensityWeight methodology. All costs were adjusted for inflation to 2010 Canadian dollars using the Statistics Canada Consumer Price Index for health care and personalitems for Ontario. Purchasing Power Parities for GrossDomestic Product was used to convert 2010 Canadiandollars to 2010 U.S. dollars.Net Costs of HCC Care. Within each phase ofcare, we calculated total costs of care and total monthsof observation for cases and controls. For each phaseof care, we estimated mean (and 95% confidenceinterval [CI]) net costs of care due to HCC (per 30patient-days) using generalized estimating equations toaccount for the matched study design. CIs for the predicted costs for each phase were reproduced by applying bootstrap resampling of the data 1,000 times.5-Year Net Costs of HCC Care. We applied theincidence approach16,25 that involves using the meannet costs of HCC care per 30 patient-days by phase,in conjunction with survival probabilities after HCCdiagnosis accounting for competing risks35 (using cancer registry statistics from 2002 to 2008), to estimate5-year net costs of care in diagnosed HCC patients.The lower and upper bound of the 95% CI for phasespecific net costs of care were used to estimate a plausible range of 5-year net costs of care.16 Costs werediscounted at 3% and 5% annually.Aggregate 5-Year Net Costs of HCC Care in theCanadian Population. We applied 5-year net cost ofcare estimates to the number of newly diagnosedHCC patients in the Ontario population in 2009from the OCR ( 36% of the total HCC in the Canadian population)36 to estimate the aggregate 5-year net
HEPATOLOGY, Vol. 000, No. 000, 2013costs of care due to HCC. To extrapolate to the totalCanadian population of newly diagnosed HCCpatients in 2009, we divided the estimated number ofnewly diagnosed HCC patients in Ontario by 0.36.We assumed that the cost of care and survival forpatients diagnosed in 2009 would approximate ourestimates derived over a period 2002-2008.16Sensitivity Analysis. A sensitivity analysis was performed where the initial phase was defined as the first12 months after diagnosis of HCC, the terminal phasewas defined as the final 12 months of life, and thecontinuing care phase was defined as all monthsbetween the initial and terminal phases of care. Forpatients surviving 24 months after diagnosis, thefinal 12 months of observation and costs of care wereallocated first to the terminal phase, consistent withother studies.12,16ResultsCharacteristics of the Study Population. Overall,2,341 cases were identified with a principal diagnosis ofHCC in the OCR during the study period 2002-2008(Table 1). Over the period, the number of new HCCcases increased, and the proportion of those aged 80 andabove increased. Patients receiving treatment with livertransplantation, RFA, or TACE in the year after HCCdiagnosis increased over time; in contrast, those receivingsurgical resection decreased. The overall 1-, 3-, and 5year survival was 51%, 24%, and 13%, respectively.Both sets of cases and controls (cohort 1 and cohort2) were well matched except for birth location, becausethis information was missing for the controls (Table2). Cases that contributed person-time to the initialphase (110 days) were closely matched to the controls(119 days); however, many cases that contributed person-time to the continuing care (826 versus 1,493days) and terminal (129 versus 169 days) phases couldnot be matched with suitable controls.Health Care Costs Associated With HCC. The average total health care costs per 30 patient-days amongHCC patients was relatively high in the initial phase( 3,660), declined during the continuing care phase( 2,745), and increased markedly in the terminalphase ( 12,036) (Table 3). Estimates of the averagenet costs of HCC care per 30 patient-days were highest in the terminal phase ( 7,776, 65% of the totalcosts in this phase), followed by the initial phase( 3,204, 88% of the total costs) and continuing carephase ( 2,055, 75% of the total costs) (Table 4). Weonly reported 95% CIs derived from the generalizedestimating equations since they were practically theTHEIN ET AL.5same as the bootstrap CIs. Liver failure or potentialcomplications of cirrhosis accounted for approximately30% of the total net costs in the initial phase ( 957;95% CI, 800 to 1,115), 18% in the continuing carephase ( 379; 95% CI, 315 to 444), and 52% in theterminal phase ( 4,022; 95% CI, 3,179 to 4,864).The net costs of patients that received liver transplantation only, and those undergoing surgical resectiononly were highest in the terminal phase. The net costsof patients receiving RFA as the only treatment wererelatively low in the initial phase, and no significantcost differences were observed in the continuing careand terminal phases.In the sensitivity analysis (Table 5) assigning 12months after the diagnosis to the initial phase and 12months preceding death to the terminal phase, therewas a significant increase (83%) in the total net costsof care in the initial phase and a slight increase (8%)in the terminal phase compared with the total netcosts of care in the primary analysis (Table 4). The netcosts of care were about halved (54%) in the continuing care phase.The net costs of outpatient visits due to HCC(69%-93% of the total costs of outpatient visits), acuteinpatient care due to HCC (72%-91% of the totalcosts of acute inpatient visits), and emergency roomvisits due to HCC (62%-75% of the total costs ofemergency room visits) accounted for the highest costcategories across all three phases.Estimates of 5-Year Net Costs of HCC Care. Estimates of the mean (95% CI) 5-year net costs of HCCcare were 77,509 ( 60,410 to 94,607) (undiscounted), 52,959 ( 41,435 to 64,482) (3% discount), and 48,602 ( 38,152 to 59,052) (5% discount) (Table 6). Year 1 net costs of care accountedfor 49% of the 5-year net costs of care. In the sensitivity analysis, the respective 5-year estimates were: 103,688 ( 77,636 to 129,740), 65,225 ( 49,162to 81,288), and 57,559 ( 43,525 to 71,592).Aggregate 5-Year Net Costs of HCC Care in theCanadian Population. When the mean 5-year netcosts were applied to the newly diagnosed HCC casesin the Canadian population in 2009, the 5-year aggregate net costs of care were approximately 106.4 million (undiscounted; 95% CI, 82.9 to 129.9 million), 72.7 (3% discount; 95% CI, 56.9 to 88.5million), and 66.7 million (5% discount; 95% CI, 52.4 to 81.1 million). In the sensitivity analysis, therespective 5-year aggregate net costs of care were: 142.3 million ( 106.6, 178.1 million), 89.5 million ( 67.5, 111.6 million), and 79.0 million( 59.8, 98.3 million).
6THEIN ET AL.HEPATOLOGY, Month 2013Table 2. Baseline Characteristics of Matched Cases and Controls and Unmatched CasesCohort 1Initial PhaseCohort 2Continuing Care PhaseTerminal PhaseVariableHCC CasesControlsUnmatchedControlsHCC CasesControlsUnmatchedControlsHCC CasesControlsUnmatchedCasesUnmatchedControlsnMean 6 SD timespent, daysAge, % 60 years61-70 years71-80 years 80 yearsFemale sex, %Rural residence, %Birth location, %CanadaAsia*EuropeOther†MissingIncome quintile, %1 (lowest)2345 (highest)CCI, %0123þNo hospital recordIndex year20022003200420052006200720082,320110 6 142,320119 6 8156,009119 6 141,478826 6 712,2851,493 6 74156,0091,517 6 7621,103129 6 651,103169 6 36579132 6 612,879172 6 51095121114162419262117151164*Asia includes China and Japan.†Other countries include Africa, United Kingdom, United States.Table 3. Mean Health Care Costs Among HCC Cases and Controls According to Cost Category and Disease PhaseDisease PhaseInitialCost CategoryContinuing CareCasesN2,320Outpatient visits, 2,024 (1,803 - 2,245)Emergency room visits, 120 (109 - 132)Same-day surgery, 45 (41 - 50)Acute inpatient care, 1,283 (1,140 - 1,426)Medications, 106 (95 - 117)Home care, 52 (43 - 60)Continuing Care, 8 ( - 2 - 19)Long-term care, 10 (4 - 16)Total cost, 3,660 (3,329 - (106 - 164) 1,182 (1,000 - 1,365)(22 - 45)161 (135 - 187)(10 - 16)37 (31 - 44)(69 - 155)827 (678 - 976)(59 - 70)280 (246 - 313)(16 - 28)175 (124 - 226)(8 - 56)38 (13 - 64)(23 - 46)22 (11 - 32)(380 - 532) 2,745 (2,426 - 3,063)TerminalControls242402416384343161690All costs reflect 2010 US per 30 patient-days. Values are expressed as the mean (95% CI).CasesControls2,2851,1031,103(217 - 268) 3,059 (2,050 - 4,067)944 (780 - 1,108)(27 - 52)551 (423 - 678)211 (180 - 241)(21 - 26)46 (32 - 61)22 (16 - 28)(139 - 188) 7,075 (6,189 - 7,960) 1,970 (1,697 - 2,243)(77 - 91)207 (184 - 230)149 (136 - 162)(27 - 41)492 (433 - 551)215 (171 - 260)(10 - 52)526 (206 - 846)331 (227 - 435)(44 - 78)64 (44 - 84)400 (350 - 450)(631 - 748) 12,036 (10,214 - 13,857) 4,260 (3,880 - 4,639)
HEPATOLOGY, Vol. 000, No. 000, 2013THEIN ET AL.7Table 4. Mean Net Costs of Care Due to HCC According to Cost Category, Treatment Type and Disease PhaseDisease PhaseCost CategoryInitialOutpatient visits, Emergency room visits, Same-day surgery, Acute inpatient care, Medications, Home care, Continuing care, Long - term care, Total net costs, Type of HCC treatment, Curative treatmentRFA onlySurgical resection onlyLiver transplantation onlyRFA þ surgical resectionRFA þ liver transplantationSurgical resection þ liver transplantationRFA þ surgical resection þ liver transplantationNoncurative treatmentTACE onlyPercutaneous ethanol injection onlyChemotherapy onlySorafenib onlyTACE þ chemotherapyTACE þ sorafenibPercutaneous ethanol injection þ chemotherapyChemotherapy þ sorafenibTACE þ chemotherapy þ sorafenibContinuing CareTerminal1,88987321,1714230 24 253,204(1,665 - 2,112)(71 - 102)(27 - 37)(1,021 - 1,320)(30 - 53)(19 - 40)( 50 - 3)( 38 - 12)(2,863 - 3,545)940122136641961417 392,055(756 - 1,123)(93 - 150)(6 - 20)(515 - 813)(161 - 230)(90 - 192)( 26 - 41)( 60 - 19)(1,734 - 2,375)2,115340245,10558277195 3367,7761,6847,33711,4547,9712,11411,2491,961(717 - 2,652)(5,455 - 9,219)(9,059 - 13,849)(4,687 - 11,256)(529 - 3,699)(5,771 - 16,729)( 842 - 4,764)1,2851,8113,0161,4373,9673,3952,791( 518 - 3,089)(481 - 3,142)(2,247 - 3,786)(780 - 2,095)(3,014 - 4,919)(497 - 6,294)(1,696 - 3,886) 88132,71229,8654,2417561,7935345181,036742(379 - 1,133)(118 - 3,469)(160 - 907)( 1,970 - 3,006)( 1,933 - 4,005)( 123 - 1,605)1,203262 (125 - 399)2,287620 (145 - 1,096)2,631 ( 121 - 5,381)601 ( 45 - 1,248)1,026 (544 - 1,509)701 ( 228 - 1,630)1,257 (936 - 1,577)875655 (44 - 1,267)1,624(1,090 - 3,139)(209 - 472)(8 - 40)(4,158 - 6,052)(32 - 83)(204 - 350)( 142 - 532)( 389 - 283)(5,889 - 9,663)( 3,280 - 1,519)(1,954 - 63,469)(1,243 - 58,487)( 3,490 - 11,973)13,267 ( 47,431 - 73,966) 1,066 ( 3,817 - 1,685) 344 ( 8,694 - 8,007)461 ( 1,385 - 2,308) 6,248 ( 13,248 - 751)2,1761,1161,834Net costs were generated using generalized estimating equations. Values are expressed as the mean (95% CI), where mean costs reflect 2010 US per 30patient-days.DiscussionIn the face of limited health care resources and anincreasing national health burden, it is reasonable toconsider cost when making policy decisions for a
were applied to survival probabilities of HCC patients to estimate 5-year net costs of care and extrapolated to the Canadian population of newly diagnosed HCC patients in 2009. During 2002-2008, 2,341 HCC cases were identified in Ontario. The mean (95% confi-dence interval [CI]) net costs of HCC care per 30 patient-days (2010 US dollars) were