Transcription
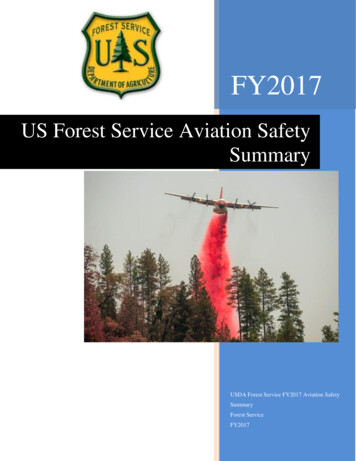
FY2017US Forest Service Aviation SafetySummaryUSDA Forest Service FY2017 Aviation SafetySummaryForest ServiceFY2017
CONTENTSSCOPE OF THIS REPORT .3EXECUTIVE SUMMARY .3The Forest Service Aviation Program .3Safety Management System (SMS) .4AVIATION SAFETY DATA AND STATISTICS - FY2017 & 10 YEAR .5LEADING INDICATORS - ACCOMPLISHMENTS IN AVIATION SAFETY – FY2017 .6Policy: .6Risk Management: .6Assurance: .6Safety Promotion: .6SAFECOM STATISTICAL SUMMARY .7Margin of Error - SAFECOM Reporting .7Summary – Total Number of SAFECOM Reports – all Categories.8Percent SAFECOMs By Category – FY2017 .1Percent of SAFECOMs by Category – 10 YR: FY08-FY17 .1SAFECOMs Reported vs Flight Hours – FY08-FY17 .2#SAFECOMs By FS Region – FY2017 .2SAFECOM Stats By Category .3Top 10 SAFECOM Reports By Category/Subcategory– FY2017 . 12FLIGHT HOURS STATS . 1210 – Year Flight Hour Stats . 12Aircraft Flight Hr. Percentages by Aircraft Type . 13Flight Hour – 10 Year Average vs Actual by Aircraft Type . 13LAGGING INDICATORS: AIRCRAFT MISHAPS & FATALITIES . 14FY 2017 Accident Statistics- Rate Calculations. 1410 Year Accident Statistics - USFS Aircraft . 1510 Year Avg vs Actual – Accident and Fatality Stats . 16Accident Data by Aircraft Category: FY08 - FY17 . 17Accident Rates by Aircraft Type: 10 Yr. Average vs FY17. 1730 Year Aircraft Accident & Fatality Trend. 18USDA FOREST SERVICE FY2017 AVIATION SAFETY SUMMARY1
Forest Service Aircraft Accident History- 1940 to 2017 . 19Fatal Accident and Fatality Rates – FY 2017 and 10-Year Stats . 21Total Number of Fatalities for all Aircraft (5 Year Increments starting 1940) . 21AIRCRAFT ACCIDENT STATS & FLIGHT HOURS BY AIRCRAFT TYPE . 22USFS Owned and/or Operated (O&O or “Fleet”) Aircraft Statistics . 22Fixed-Wing Aircraft Statistics . 23Airtanker Statistics . 24Single Engine Airtanker Statistics . 25Helicopter Statistics . 26MISHAP SUMMARY – FY17 . 27GLOSSARY AND DEFINITIONS. 27Aircraft Category Definitions: . 27Mishap Definitions: . 27Acronyms . 28REFERENCES: . 30USDA FOREST SERVICE FY2017 AVIATION SAFETY SUMMARY2
SCOPE OF THIS REPORTThis Aviation Summary provides statistical information for aviation activities under theoperational control of the US Forest Service (FS) and for Forest Service Owned and Operated (O/O) or“Fleet” aircraft during Fiscal Year 2017. The report also makes comparisons to historical data. Itincludes information from SAFECOM reports, flight hour tracking, accident/incident analysis andreviews. Due to the volume and variations in aviation management policies and processes amongagencies, states and cooperators, the taxonomy of the data is relevant only to Forest Service (FS)aviation management. Using this specific taxonomy provides for data integrity and allows FS aviationsafety personnel to best gauge how well the agency Safety Management System (SMS) is workingwithin the parameters they have direct influence over.EXECUTIVE SUMMARYThe Forest Service incorporates SafetyFISCAL YEAR (FY) 2017 AVIATIONManagement System principles as a core businessSAFETY SUMMARYpractice to accomplish aviation safety goals.FLIGHT HOURS85,126#SAFECOMREPORTS474SMS is the international industry standard for# ACCIDENTS1aviation safety and provides the structure within a# INCIDENTS3network of programs that includes aviation safety# FATALITIES0policy, promotion, assurance and riskmanagement. Mishap prevention is influenced by the quality of information available that may affectour decisions, actions, behaviors and attitudes towards the work we do.The Interagency SAFECOM reporting system satisfies Federal Aviation Regulationrequirements for incident reporting, but more importantly, it provides management and front linesupervisors with information about aviation concerns, issues or hazards as they occur. Although theprimary purpose of the SAFECOM system is for timely reporting of safety concerns, data from thereports can be monitored and trended to detect issues that could potentially affect safety. Reportingallows aviation users and managers to take appropriate actions as a defense helping to prevent mishapsfrom occurring.Note: the symbol “#” seen throughout this report refers to number, (not a hashtag).THE FOREST SERVICE AVIATION PROGRAMApproximately 300 employees at the Washington Office, Regional Offices and Forestlevels administer the Forest Service aviation program. The national staff is located inWashington D.C. and at the National Interagency Fire Center in Boise, Idaho. The vastmajority of aviation personnel are located throughout the forests, where local forest and regional staffprovide day-to-day operational oversight and program guidance within their respective regions/units.USDA FOREST SERVICE FY2017 AVIATION SAFETY SUMMARY3
The Forest Service utilized approximately 615 aircraft in FY 2017. These include governmentowned and leased, but primarily contracted aircraft. Numerous state agencies and county municipalitiesoperate aircraft that have been acquired for use under the Federal Excess Personal Property (FEPP)program. Under the FEPP program, the Forest Service holds the registration and transfers the aircraft toauthorized programs (bailed agreements). These aircraft are not included in statistics or mishap data asoperational control typically resides with the operator (state or county municipality), unless the aircraftis operating on a FS controlled incident or mission. Missions: The primary mission of Forest Service Aviation is to support natural resourceprograms including, but not limited to: Aerial delivery of firefighters by parachute, rappel rope, or on site landingAir tactical command and controlSurveillance, reconnaissance, and intelligence gatheringInfrared detection & mappingAerial delivery of fire retardant and waterPassenger transport for firefighting and resource missionsAdministrative flightsResearchForest rehabilitationForest Health Protection (aerial surveys, application and photography)Law enforcementAerial photographyEmergency Medical AssistanceSAFETY MANAGEMENT SYSTEM (SMS)Safety Management Systems influences the organizational culture.SMS practices involve engaging people to make safety a sharedresponsibility and recognizing the value of teamwork across aviationdisciplines (operations, safety, airworthiness, training, etc.). Organizingaviation operations with an SMS mindset allows the agency to maintaincontrol over the key factors that affect safety performance. This structureprovides an effective and proven way to organize and apply what we know so that we continue to learn andmake necessary adjustments in a tangible, measurable way.A Safety Management System provides the organizational framework to construct and support a soundsafety culture that actively controls risk exposure. The goal is to develop a safety culture that achieves andmaintains a zero accident rate. In order to accomplish this, we need to maintain the capability to continuouslyseek out and eliminate latent defects within our systems and culture.USDA FOREST SERVICE FY2017 AVIATION SAFETY SUMMARY4
The four pillars of SMS that comprise the Agency’s safety management system are briefly describedbelow:Policy formalizes the agency’s fundamental approach to achieve acceptable or tolerable safety. Itidentifies management commitment, responsibility and accountability for the program and theappointment of key safety personnel.Risk Management is the core of the SMS. It is the avenue to recognize and address hazardousconditions at a point where they can still be effectively managed. It involves identifying the hazards,assessing the risk, analyzing the risk, and controlling/mitigating the risk. This is a fundamental activitythat relies on reporting of hazards by people who coexist with or encounter them.Assurance activities are designed to monitor our aviation activities and provide us with adequateconfidence that our system achieves an acceptable or tolerable level of safety. Assurance activities andcontrols include quality assurance audits and reviews, pre-use inspections, review and analysis ofhistorical data, accident/incident investigation, error analysis, and corrective action plans.Promotion includes processes and procedures that ensure our personnel are trained, informed andcompetent to perform duties in the safest manner possible. This includes communication of safetyissues in the form of alerts, bulletins, and lessons learned that provide a sense of purpose to safetyefforts. Promoting safety in the agency helps to build and sustain a culture that goes beyond merelyavoiding accidents or reducing the number of incidents, it sets the stage for aviation personnel to do theright thing at the right time in response to both normal and emergency situations.AVIATION SAFETY DATA AND STATISTICS - FY2017 & 10 YEARTracking aviation activities is critical in establishing confidence in the agency’s performance asSMS implementation continues to evolve. Tracking, reporting and sharing safety information feeds thesafety culture and provides a means to compare safety efforts with outcomes.Data capturing of aviation information (audits/reviews, SAFECOM system, investigations, etc.)involves collecting both leading and lagging indicators of safety performance. Capturing both types ofdata helps us identify and understand potential weaknesses in our safety efforts so we can adjust andpredict future success. Leading indicators are focused on future safety performance and continuousimprovement. These measures are proactive in nature and report on efforts completed on a regular basisto help identify safety issues and correct them to help prevent mishaps. Examples include: qualityassurance program audits, aviation safety training, implementation of accident recommendations andbase reviews. Lagging indicators are the traditional safety metrics that display accident and fatalitynumbers and rates. The reactionary nature of lagging indicators makes them an imprecise indicator ofsafety. In short, lagging indicators measure undesirable outcomes; leading indicators are data collectedthat can be utilized to prevent undesirable outcomes.USDA FOREST SERVICE FY2017 AVIATION SAFETY SUMMARY5
LEADING INDICATORS - ACCOMPLISHMENTS IN AVIATION SAFETY – FY2017POLICY: Re-write of Forest Service Manual (FSM) 5700 complete Provided technical expertise to several Interagency guides and handbooks updates Provided aviation safety input for the updated HC-130H Operations Plan Participated in the development of the Sherpa Operations PlanRISK MANAGEMENT: Instructed multiple risk management sessions nationally (A-205; 305) Provided Safety Officer oversight to the HC-130H Airtanker program Ensured inclusion of SMS requirements into Type 3 Helicopter, Next Generation Airtanker, and Light FixedWing Contracts Assembled Aviation Investigation Review (AIR) with Agency SMEs (2-HOS, HMGB-PLDO, RXB1-FMO—see acronyms defined on page 28) to evaluate the Desoto Helicopter Accident recommendations and developan agency action planASSURANCE: Coordinated investigations for 3 Incidents With Potential (IWP), Incidents and other Lessons LearnedReviews. Participated in contract technical evaluation board proposals Participated in various quality assurance reviews, including Region 5 Night Helicopter Ops QA and Region 5Pilot Safety Audits at 3 different locations (Redding, Lancaster, McClellan)SAFETY PROMOTION: Published Annual Aviation Safety Report Published Annual Aviation Safety Briefing and presented at Helicopter Association International (HAI),several Regional Aviation and Safety meetings, Helicopter Crewmember, Helicopter Manager and HelibaseManager Courses Provided administration and review to all USFS and State SAFECOMs and management of WO, Vendor andsome State SAFECOMs Published a combined total of 23 Safety Alerts, Technical Bulletins, Lessons Learned, Accident PreventionBulletins and Information Bulletins Presented A-200 Aviation Mishap Reviews at HAI, several Regional Aviation and Safety meetings, HelicopterCrewmember, Helicopter Manager and Helibase Manager Courses Delivered Crew Resource Management (CRM) 7 Skills Training: Initial CRM- 16 classes with 336 FS & Inter-Agency students completing Refresher CRM- 8 classes with 128 FS & Inter-Agency students completing Train the Trainer- 2 classes with 36 FS & Inter-Agency students completingUSDA FOREST SERVICE FY2017 AVIATION SAFETY SUMMARY6
Evaluated 10 USFS CRM 7 Skills Facilitators Total number of CRM Facilitators is now 81 (58 USFS, 17 BLM, 1 NPS, 5 State) Delivered 3 SMS presentations Delivered Human Factors and A-200 at the interagency Aviation Centered Education (ACE) Supported nine employees in earning their Career Certificate in Aviation Safety Management Systems and theFederal Aviation Safety Officer Certificate. Twenty-five employees applied for and received scholarship funding to take courses in Aviation SafetyManagement Systems from institutes of higher education. USFS students completed a total of 11,655 Interagency Aviation Training (IAT) modules. These werecompleted through Classroom (2,930 modules), Webinars (249 modules) and on-line learning (8,476 modules)SAFECOM STATISTICAL SUMMARYThe SAFECOM statistical summary is comprised of both narrative and graphic displays thatpresent the Forest Service SAFECOM data submitted to the Interagency SAFECOM database. In fiscalyear (FY) 2017 there were 474 Forest Service SAFECOMs submitted; the 10-year average ofSAFECOMs submitted annually is 486.USFS Fleet (O&O) aircraft are not separated in the SAFECOM data system and are reported under theactual type of aircraft; fixed-wing, airtanker or helicopter.The SAFECOM report is not a substitute for taking immediate needed action. The first step todealing with a safety issue is to try to correct the situation at the lowest level possible and follow-upwith a SAFECOM to document. If the safety issue requires subject matter expertise to resolve, contactthe Regional Aviation Safety Manager (RASM) to facilitate collaboration with Regional subject matterexperts; for example: Aviation Maintenance Inspectors (AMI), Helicopter Operations Specialist (HOS),and Helicopter Inspector Pilots (HIPs).Note: The SAFECOM system is not a venue to launch complaints or to seek punitive action. Althoughused to provide statistics, the SAFECOM system is primarily a communication tool to report hazards andsafety issues allowing appropriate action to be taken in a timely manner. SAFECOM reports can alertaviation managers to emerging safety trends allowing them to be reversed. SAFECOM reports are alsoused to identify good decisions and positive safety events that can generate Airwards.MARGIN OF ERROR - SAFECOM REPORTINGThe information pulled from the SAFECOM system is highly contingent on a positive safetyreporting culture. The data displayed is considered a representative sample, rather than a completecapture, of issues encountered in the field. To continue to build trust in the system and improve thereporting culture, it is imperative that use of the SAFECOM system is promoted appropriately byaviation supervisors and that SAFECOMs are never used punitively or sent to the public side unsanitized.USDA FOREST SERVICE FY2017 AVIATION SAFETY SUMMARY7
SUMMARY – TOTAL NUMBER OF SAFECOM REPORTS – ALL CATEGORIESThe overall total of SAFECOMs reported in FY17 for all agencies is 937 (474 Forest Service,373 DOI, 88 State and 2 Other/Unknown/Military/Vendor).The 10 most reported USFS SAFECOMs in FY2017 were:1.2.3.4.5.6.7.8.9.10.Incident - *Precautionary Landing (72),Mishap Prevention – Kudos (46),Airspace – Intrusion (41),Maintenance - Engine (34),Hazard other (32),Maintenance – Other (29)Airspace- UAS (25),Hazard – Mission Equipment (25),Maintenance – Chip Light (25),Management – Internal (23),*Precautionary landing—a premeditatedlanding, on or off an airport, when furtherflight is possible but inadvisable. These areaeronautical decisions that can prevent asituation from progressing into anemergency. (Reference: The Airplane FlyingHandbook (FAA, 2016)). Examples include:landings due to deteriorating weather, chiplight, or fuel management/low fuel.Other notables: Airspace – Procedures (22), Communication – (22), Policy Deviation - (20)10-Year SAFECOM DataYearNumber of SAFECOM’s201710-Year Total10-Year Average4744860486USDA FOREST SERVICE FY2017 AVIATION SAFETY SUMMARY2017 FS SAFECOMs by Aircraft TypeAircraft TypeFixed FS Owned/OperatedTotalNumber962392347821021284748
PERCENT SAFECOMS BY CATEGORY – FY2017The numbers of SAFECOMs by category will exceed the total number of SAFECOMs reported aseach SAFECOM may have more than one category assigned to it. For example several Incident andHazard SAFECOMs may also have a Maintenance component.SAFECOM - PERCENTAGES PER CATEGORY - 2.2%Hazard22.9%Accident0.2%Mishap Prevention6.9%Incident21.7%PERCENT OF SAFECOMS BY CATEGORY – 10 YR: FY08-FY1710 YR - % SAFECOMS BY CATEGORYMishap Prevention5.01%Management2.34%Maintenance*UAS 0.68%Incident*UAS (Unmanned Aerial Systems) is a new category in the SAFECOM systemUSDA FOREST SERVICE FY2017 AVIATION SAFETY SUMMARY1
SAFECOMS REPORTED VS FLIGHT HOURS – FY08-FY17There is a general positive correlation between the flight hours (an indicator of operational tempo)and the number of reports (reporting culture) over the past 10 years, until 2017, when the number of reportsdeparts (downward) from the flight hours. Interpreting this is only speculative. Because flight hours andthe number of SAFECOM reports appear to correlate, this information will continue to be reviewed andtrended. The decline in the number of reports in 2017 could be as simple as less safety issues or concerns toreport, or it could be an early indicator of a drop off in reporting.# SAFECOM Reports vs Annual Flight 12Flight HoursFY13FY14FY15FY16FY17# SAFECOM Reports#SAFECOMS BY FS REGION – FY2017The amount of reporting in each Forest Service Region generally correlates with the amount of flighthours and complexity of missions flown. Regional Aviation Safety Managers (RASMs) follow up on eachSAFECOM received in their respective Region by evaluating and processing the reports and providinglessons learned when appropriate.FY17 - #SAFECOM Reports by FS A FOREST SERVICE FY2017 AVIATION SAFETY SUMMARYR5R6R8961R9R10NEA2
SAFECOM STATS BY CATEGORYACCIDENTThe FS experienced one (1) Aircraft Accident in FY17. This aircraft was a Forest Service CessnaTU206G (fleet) that sustained damage to the firewall and nose wheel after a porpoised landing in gustyconditions. There were no injuries.AIRSPACEThere were a total of 79 Airspace SAFECOMs reported in 2017; the 10 year average is 46. Therewere three near mid-air events; the10-year average is 2.3. There were 41 intrusions in which 11 of thosereports involved UAVs (Unmanned Aerial Vehicles), as compared to 2016 when there were only 5 UAVairspace intrusions reported. Out of 16 Airspace conflict SAFECOMs, 7 involved UAVs. These were alsosubcategorized as Airspace: UAS. UAS was added as a subcategory to the SAFECOM system in 2017 tobetter track intrusions and conflicts involving recreational UAVs. (Note: UAV refers to the vehicle itself andUAS is an all-encompassing term describing the entire operating system for the UAV: the ground controlstation with operator, communications equipment, support equipment etc.).Top 5 Airspace SAFECOMs - ASINTRUSIONOTHER* In all reports where UAVs were encountered in the Airspace, aviation operations were shut down untildeemed safe to return.USDA FOREST SERVICE FY2017 AVIATION SAFETY SUMMARY3
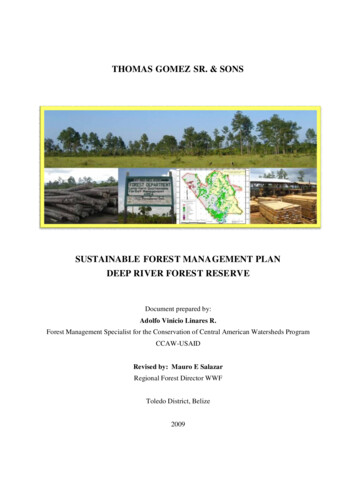
Total # Airspace SAFECOMs with #NMAC reports - past 10 1120103521201120122013# SAFECOMs61201442015201632017NMAC 10 year average 2.3/yr.NMACThe FS continues to monitor the number of near mid-air collision (NMAC) reports. NMAC is aconstant hazard, with an average of about 2.3 reported per FY (23 reports from FY08-FY17). A near mid–air collision is defined by the Federal Aviation Administration (FAA) as “an incident associated with theoperation of an aircraft in which a possibility of a collision occurs as a result of proximity of less than 500feet to another aircraft and/or where a report is received from a pilot or other flight crew member stating thata collision hazard existed between two or more aircraft.” Incident aviation operations are often conductedunder adverse flight conditions that can include congested airspace, reduced visibility, poorweather/turbulence and mountainous terrain. These conditions add risk and complexity to the missions andcan create environments that contribute to near mid-air events.Top 5 Airspace SAFECOMs - FY08-FY17(total NPROCEDURESCONGESTIONUASUAS Airspace issues are an emerging concern, as verified by the number of SAFECOM reportsshown in the graph above (43). UAS intrusions and conflicts have made it into the top 5 with only 2 years’worth of reporting under this new subcategory (18 reports in 2016, 25 in 2017)—the other 5 categoriesshown consist of a full 10 years of data.USDA FOREST SERVICE FY2017 AVIATION SAFETY SUMMARY4
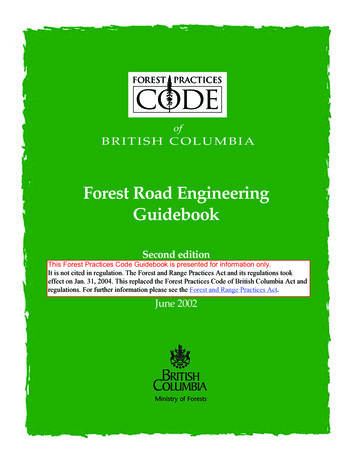
FY17 Airspace: UAS reports439216Airspace:UASAirspace: Procedures/UASAirspace: Intrusion/UASAirspace: es/UASAirspace: conflict/UASHAZARDSThere were a total of 152 Hazard SAFECOMs reported. The following 2 graphs display 1) the top 5Hazard SAFECOMs reported and 2) the number of Hazard SAFECOMs for the past 10 years.Top 5 Hazards by SubcategoryFY2017353230252220201516991050USDA FOREST SERVICE FY2017 AVIATION SAFETY SUMMARY5
Top 5 HAZARDs by SubcategoryFY08- FY17 (total ION EQUIPMENTOTHERPILOT ACTIONPOLICY DEVIATIONINCIDENTSThere were a total of 146 Incident SAFECOMs reported in FY17. The graphs in this sectiondisplay the top 5 Incident SAFECOMs reported (listed by subcategory) and the total number of IncidentSAFECOMs (by subcategory) reported for the last 10-years. The Forest Service experienced 3 eventsconsidered to be Incidents With Potential in FY17: 1 was a near mid-air collision (NMAC) in the landingpattern of an airport between a large airtanker and a SEAT (location of an Airtanker Base); 1 was a nearCFIT (controlled flight into terrain) after an airtanker experienced significant down air after a retardant dropand had to take steps to avoid terrain, and 1 was a hydraulic failure resulting in a nose gear collapse on thelanding rollout. Additionally, there were 2 NMAC SAFECOMs incorrectly reported in the SAFECOMsystem under Forest Service operational control (Brianhead Incident). These two reports fell under theoperational control of the State of UT, and therefore are not included in the statistics.Top 5 Incidents by SubcategoryFY2017807270605040302013151113100A/C DAMAGEDRAGGED LOADDROPPED nary Landing includes the general category, crew, mechanical and weather*Dragged Load includes the general category, human and mechanical*Dropped Load includes the general category, human and mechanicalUSDA FOREST SERVICE FY2017 AVIATION SAFETY SUMMARY6
Top 5 Incidents by 0AIRCRAFTDAMAGEDRAGGED LOAD(HUMAN FACTOR)MISSIONEQUIPMENTOTHERPRECAUTIONARYLANDING (MECH)Total #Incident SAFECOMs - past 10 200920102011201220132014201520162017# SAFECOMsMAINTENANCEThere were a total of 216 maintenance related SAFECOMsreported in FY17, which includes several subcategories. Below arethe top 5 Maintenance SAFECOMs reported by subcategory andthe total number of maintenance SAFECOMs reported for the past10 years. Maintenance related SAFECOMs accounted for 32% ofall the FY17 USFS SAFECOM reports. Engine maintenancediscrepancies continue to be the most reported; there were a total of35. Eight (8) of the 35 were either an engine failure or required anengine shutdown.USDA FOREST SERVICE FY2017 AVIATION SAFETY SUMMARY7
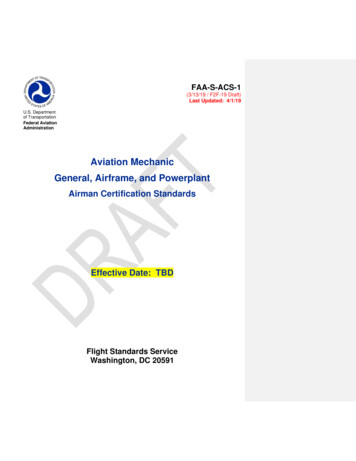
Top 5 Maintenance Reports by Subcategory - FY2017353530292625192020151050CHIP LIGHTENGINEELECTRICALOILOTHERTop 5 Maintenance Reports by 477294212CHIP LIGHT163ELECTRICALUSDA FOREST SERVICE FY2017 AVIATION SAFETY SUMMARYENGINEMISSIONEQUIPMENT160OTHER8
Total #- Maintenance SAFECOMs - #SAFECOMsMANAGEMENTThere were a total of 27 management related SAFECOMs reported, which includes both internal(23) and external (9) subcategories. Some Management SAFECOM reports are categorized as both internaland external, which results in the subcategory number exceeding the total number of Management reports.Below are the SAFECOM reports classified as Management, sub-categorized by internal and external.Total # Management SAFECOMs by subcategoryFY08-FY17252325202017
aviation safety and provides the structure within a network of programs that includes aviation safety policy, promotion, assurance and risk management. Mishap prevention is influenced by the quality of information available that may affect our decisions, actions, behaviors and attitudes towards the work we do.