Transcription
Alsallakh et al. BMC Medicine(2021) SEARCH ARTICLEOpen AccessImpact of COVID-19 lockdown on theincidence and mortality of acuteexacerbations of chronic obstructivepulmonary disease: national interruptedtime series analyses for Scotland and WalesMohammad A. Alsallakh1,2*† , Shanya Sivakumaran1† , Sharon Kennedy3, Eleftheria Vasileiou2,4 , Ronan A. Lyons1 ,Chris Robertson3,5 , Aziz Sheikh2,4 , Gwyneth A. Davies1,2 and on behalf of the EAVE II CollaboratorsAbstractBackground: The COVID-19 pandemic and ensuing national lockdowns have dramatically changed the healthcarelandscape. The pandemic’s impact on people with chronic obstructive pulmonary disease (COPD) remains poorlyunderstood. We hypothesised that the UK-wide lockdown restrictions were associated with reductions in severeCOPD exacerbations. We provide the first national level analyses of the impact of the COVID-19 pandemic and firstlockdown on severe COPD exacerbations resulting in emergency hospital admissions and/or leading to death aswell as those recorded in primary care or emergency departments.Methods: Using data from Public Health Scotland and the Secure Anonymised Information Linkage Databank inWales, we accessed weekly counts of emergency hospital admissions and deaths due to COPD over the first 30 weeksof 2020 and compared these to the national averages over the preceding 5 years. For both Scotland and Wales, weundertook interrupted time-series analyses to model the impact of instigating lockdown on these outcomes. Usingfixed-effect meta-analysis, we derived pooled estimates of the overall changes in trends across the two nations.Results: Lockdown was associated with 48% pooled reduction in emergency admissions for COPD in bothcountries (incidence rate ratio, IRR 0.52, 95% CI 0.46 to 0.58), relative to the 5-year averages. There was nostatistically significant change in deaths due to COPD (pooled IRR 1.08, 95% CI 0.87 to 1.33). In Wales,lockdown was associated with 39% reduction in primary care consultations for acute exacerbation of COPD(IRR 0.61, 95% CI 0.52 to 0.71) and 46% reduction in COPD-related emergency department attendances (IRR0.54, 95% CI 0.36 to 0.81).(Continued on next page)* Correspondence: m.a.alsallakh@swansea.ac.uk†Mohammad A. Alsallakh and Shanya Sivakumaran contributed equally asfirst authors.1Population Data Science, Swansea University Medical School, Data ScienceBuilding, Singleton Park, Swansea University, Swansea SA2 8PP, UK2Health Data Research UK BREATHE Hub for Respiratory Health, University ofEdinburgh, Edinburgh EH8 9AG, UKFull list of author information is available at the end of the article The Author(s). 2021 Open Access This article is licensed under a Creative Commons Attribution 4.0 International License,which permits use, sharing, adaptation, distribution and reproduction in any medium or format, as long as you giveappropriate credit to the original author(s) and the source, provide a link to the Creative Commons licence, and indicate ifchanges were made. The images or other third party material in this article are included in the article's Creative Commonslicence, unless indicated otherwise in a credit line to the material. If material is not included in the article's Creative Commonslicence and your intended use is not permitted by statutory regulation or exceeds the permitted use, you will need to obtainpermission directly from the copyright holder. To view a copy of this licence, visit http://creativecommons.org/licenses/by/4.0/.The Creative Commons Public Domain Dedication waiver ) applies to thedata made available in this article, unless otherwise stated in a credit line to the data.
Alsallakh et al. BMC Medicine(2021) 19:124Page 2 of 10(Continued from previous page)Conclusions: The UK-wide lockdown was associated with the most substantial reductions in COPDexacerbations ever seen across Scotland and Wales, with no corresponding increase in COPD deaths. This mayhave resulted from reduced transmission of respiratory infections, reduced exposure to outdoor air pollutionand/or improved COPD self-management.Keywords: Acute exacerbation of chronic obstructive pulmonary disease, COVID-19 lockdownBackgroundThe COVID-19 pandemic and subsequent challenges tohealthcare systems have led to unprecedented disruptions of routine care for people with chronic conditions.In response to a surge in COVID-19 cases, the UK anddevolved governments announced the first nationwidelockdown on 23rd March 2020, thereby severely restricting movements and social contacts [1]. The accompanying messages to avoid overwhelming the National HealthService (NHS) and fear of contracting SARS-CoV-2 inhealthcare settings had an impact on people’s willingnessto seek emergency care [2].There is evidence that the UK-wide lockdown was associated with poorer cardiovascular [3] and cancer [4] outcomes, but its impact on serious chronic obstructivepulmonary disease (COPD) outcomes remains unclear.Despite the disruption to routine COPD care [5, 6],the societal changes associated with lockdown—in particular, improvements in air quality and reductions inother viruses responsible for acute respiratory tract infections [7, 8]—may have led to an overall improvementin COPD outcomes. The available body of evidence suggests that there may have been a reduction in acute exacerbations of COPD (AECOPD), but these data aredifficult to interpret because of methodological limitations including studying selective populations and/orfrom a limited number of centres [9–26]. Despite thechanges in healthcare-seeking behaviour during thelockdown, people with severe AECOPD were still likelyto seek medical attention as the symptoms are intensesuch that they are difficult to tolerate at home [12].We sought to investigate the impact of the UK-wideCOVID-19 lockdown on the overall numbers of recorded severe AECOPDs leading to admission and/or death acrossthe entire populations of Scotland and Wales. To contextualise the findings, we also investigate AECOPDs that were recorded in primary care and emergency departments (EDs) inWales.MethodsData sources, populations and case definitionsThe study was based on the entire populations ofScotland and Wales (the 2019 mid-year population estimates were 5,463,300 and 3,152,900, respectively). Weaccessed complete coverage person-level datasets fromPublic Health Scotland (PHS) [27] and the Secure Anonymised Information Linkage (SAIL) Databank [28] inWales. PHS receives individual-level data from all general or acute specialties in NHS hospitals in Scotland.The SAIL Databank receives linkable, routinely collecteddata from all NHS hospitals in Wales and 80% of generalpractices as well as other healthcare and administrativedata.We defined two primary outcome measures relating tosevere COPD exacerbations: COPD-related emergencyhospital admission, and death due to COPD. Emergencyadmissions for COPD were defined as those with a primary diagnosis of COPD recorded using the J43 and J44codes of the 10th revision of the International StatisticalClassification of Diseases (ICD-10). These data were extracted from the Scottish Morbidity Record 01 (SMR01)and the Patient Episodes Database for Wales (PEDW),both of which undergo regular data quality checks [29,30]. In Wales, we also extracted the average length ofstay (LOS) of COPD admissions.Deaths due to COPD were defined as those withCOPD (ICD-10 codes of J43 and J44) as the underlyingcause of death in the National Records of Scotland(NRS) deaths database or the Annual District Death Extract (ADDE) in SAIL. Mortality data were regularlychecked and validated by the UK Office for National Statistics (ONS) [31–33].In Wales, we also had access to primary care and EDdata. We defined COPD-related ED attendances as thosewith a COPD code (14B) as the primary diagnosis in theEmergency Department Dataset (EDDS) in SAIL. Wedefined a general practitioner-recorded AECOPD fromthe Welsh Longitudinal General Practice (WLGP) dataset in SAIL as an AECOPD code preceded by a COPDdiagnosis code. The code sets are included in the supplementary information.Statistical analysesWe visualised the trends of the aforementioned outcomes for the first 30 calendar weeks in 2020 and corresponding national averages for the preceding 5 years. Toinvestigate the impact of the UK lockdown on these outcomes, we undertook interrupted time series analyseswith a single change point of the 23rd of March (week13). We modelled the trends in the first 30 calendar
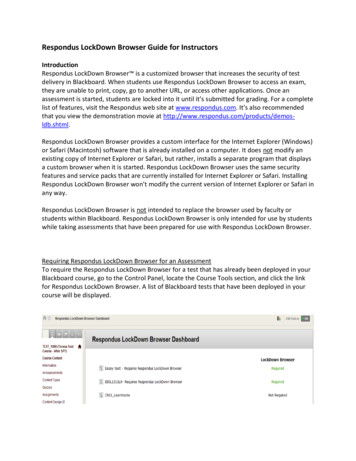
Alsallakh et al. BMC Medicine(2021) 19:124weeks in 2020 and the corresponding 5-year averages(2015–2019) using Poisson generalised linear regressionin R 4.0.3. The initial change point model in both thebaseline period and 2020 had a pre-lockdown slope andintercept as well as an instantaneous change in interceptat the week of lockdown and a change in slope followinglockdown. In the baseline period, we were anticipatingno change in intercept and no change in slope at week13. The final model was based upon the baseline and2020 data and included a binary variable to differentiatethe two periods, together with interaction terms for theslopes and instantaneous effects of lockdown. Theseinteraction terms were used to compare the slopes priorto lockdown in the baseline period with 2020, to compare the instantaneous change in intercept at lockdownin baseline with 2020 and to compare the change inslope post-lockdown in baseline with 2020. Residualplots were used to check the linearity assumption, andthe Breusch-Godfrey test [34] was used to assess autocorrelation. Separate models were used in Scotland andWales, and z tests were used to compare the model coefficients between the two countries. We then used fixedeffect meta-analysis to derive pooled estimates fromtheir weighted averages.In pre-specified sensitivity analyses, we restricted thedefinition of the study outcomes in Wales to peopleaged at least 35 years with a smoking history (current orformer smokers) documented in the Welsh LongitudinalGeneral Practice (WLGP) dataset. Linkage to the WLGPdataset was available within the SAIL Databank throughthe Anonymised Linkage Field (ALF) [35]. We excludedrecords with missing ALF field or low-quality linkage.For COPD admissions in Wales, we compared lengthof stay over the weeks 13 to 30 between 2020 and the 5year average using a separate Poisson model controlledfor week number. We used beta regression to model therelationship between the year of admission and the proportion of COPD admissions during which patients dieddue to COPD in every week, with week number as acovariate.Data analysis was performed in R 4.0.2.Reporting guidelinesWe followed the Framework for Enhanced Reporting ofInterrupted Time Series (FERITS) [36] and the REporting of studies Conducted using Observational Routinelycollected Data (RECORD) statement [37] in the reporting of this study (see the Supplementary Materials).Page 3 of 10ResultsEmergency admissionsIn the first 30 weeks of 2020, there were a total of 9847emergency admissions for COPD in Scotland (6786) andWales (3061). Those admissions were consistently lowerthan the averages of the corresponding periods in thepreceding 5 years in both countries (Fig. 1).In Scotland, the slope before lockdown in 2020 wasdecreasing (IRR 0.97, 95% CI 0.96 to 0.98), althoughthere was no evidence that this slope differed from the5-year average (IRR 1.00, 95% CI 0.98 to 1.01). Introducing lockdown in week 13 was associated with a reduction in admissions by 48% (IRR 0.52; 95% CI 0.47 to0.58). This reduction was 52% greater than the averagechange at the same point in the preceding 5 years (IRR0.48; 95% CI 0.42 to 0.55). The slope of admissions thengradually increased over the coming weeks (IRR 1.05,95% CI 1.04 to 1.07), which was in contrast to the slopeof the 5-year average which was decreasing (Fig. 1 andTable 1).In Wales, admissions in the first 12 weeks of 2020were falling (IRR 0.94, 95% CI 0.92 to 0.95), slightly faster than the corresponding 5-year average (IRR 0.96,95% CI 0.95 to 0.98). Introducing lockdown in week 13was associated with a 38% reduction in admissions (IRR0.62, 95% CI 0.53 to 0.72). This reduction was 40%greater than the average change at the same point in thepreceding 5 years (IRR 0.60; 95% CI 0.50 to 0.73). Similar to the pattern seen in Scotland, there was a slightgradual increase in the slope of admissions over the ensuing weeks (IRR 1.07, 95% CI 1.05 to 1.09), which contrasted with the decreasing slope in the 5-year average(Fig. 1 and Table 1). Admissions for COPD were 22%shorter in 2020 during lockdown than in the corresponding periods in the preceding 5 years (IRR 0.78,95% CI 0.78 to 0.79, p value 0.001). However, therewas no evidence that the proportion of COPD admissions during which patients died due to COPD in theweeks 13 to 30 was different in 2020 than the corresponding periods of the preceding 5 years (odds ratio1.05, 95% CI 0.77 to 1.43, p value 0.756).The estimated effects in Wales did not change significantly after restricting the analysis to those aged 35years at admission with a smoking history (Table B,Additional file 1).There was a 48% pooled reduction in admissions during lockdown across Scotland and Wales (IRR 0.52, 95%CI 0.46 to 0.58).Role of the funding sourceThe funders had no role in the study design, data collection and analysis, interpretation of findings, writing ofthe manuscript, or the decision to submit this manuscript for publication.DeathsThere were a total of 2554 deaths with COPD as theunderlying cause in Scotland (1535) and Wales (1019) inthe first 30 weeks of 2020.
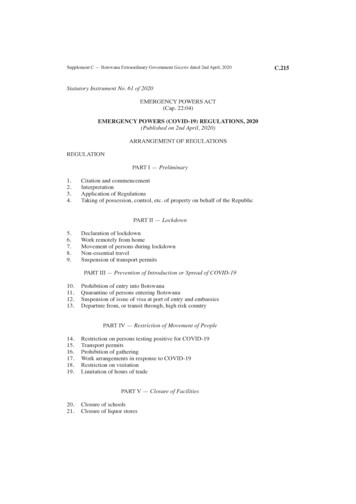
Alsallakh et al. BMC Medicine(2021) 19:124Page 4 of 10Fig. 1 Weekly count of emergency COPD admissions in Scotland and Wales in 2020 and the corresponding 5-year averages (2015–2019, points)in addition to modelled trend linesIn 2020 before lockdown, the trend of deaths withCOPD as the underlying cause was not significantly different from the 5-year average (Fig. 2). The slope ofdeaths during this period was falling slightly in both nations (Scotland: IRR 0.98, 95 %CI 0.96 to 1.00; Wales:IRR 0.97, 95% CI 0.94 to 0.99, Table 2), as it did in thecorresponding 5-year average.There was no statistically significant change in deathsfollowing the introduction of lockdown at week 13 of2020 nor at the same point in the 5-year average in bothnations (in Scotland, IRR in 2020 relative to 5-year average: 1.07, 95% CI 0.81 to 1.41; in Wales, IRR 1.09, 95%CI 0.78 to 1.53; pooled IRR: 1.08, 95% CI 0.87 to 1.33).Deaths during the lockdown continued to fall, similarto the same period in the 5-year average (Fig. 2).The estimated effects in Wales did not change afterrestricting the analysis to those with a smoking history whodied at the age of 35 years (Table C, Additional file 1).Primary care consultationsIn Wales, there were 4575 primary care consultationsfor AECOPD in the first 30 weeks of 2020. Beforelockdown, consultations were declining (IRR 0.93,95% CI 0.92 to 0.94) in a steeper slope than the 5year average (IRR 0.96, 95% CI 0.95 to 0.97, Table 3and Fig. 3). Introducing lockdown was associated withTable 1 Poisson models of emergency COPD admissions in 2020 and the corresponding 5-year averages (2015-2019).ScotlandWalesPooled estimatesIRR (95% CI)p valueIRR (95% CI)p valueIRR (95% CI)p value0.83 (0.75, 0.91) 0.0010.59 (0.51, 0.67) 0.0010.74 (0.68, 0.80) 0.0015-year average0.97 (0.97, 0.98) 0.0010.97 (0.96, 0.98) 0.0010.97 (0.97, 0.98) 0.00120200.97 (0.96, 0.98) 0.0010.94 (0.92, 0.95) 0.0010.96 (0.95, 0.97) 0.0012020 relative to 5-year average1.00 (0.98, 1.01)0.6860.96 (0.95, 0.98) 0.0010.99 (0.98, 1.00)0.0065-year average1.08 (1.00, 1.18)0.0561.02 (0.92, 1.15)0.6661.06 (0.99, 1.13)0.07220200.52 (0.47, 0.58) 0.0010.62 (0.53, 0.72) 0.0010.55 (0.50, 0.60) 0.0012020 relative to 5-year average0.48 (0.42, 0.55) 0.0010.60 (0.50, 0.73) 0.0010.52 (0.46, 0.58) 0.0015-year average1.01 (1.00, 1.02)0.0231.01 (1.00, 1.03)0.0341.01 (1.00, 1.02)0.00220201.05 (1.04, 1.07) 0.0011.07 (1.05, 1.09) 0.0011.06 (1.05, 1.07) 0.0012020 relative to 5-year average1.04 (1.03, 1.06) 0.0011.06 (1.03, 1.08) 0.0011.05 (1.03, 1.06) 0.001Pre-lockdown intercept in 2020 compared to 5-year averageSlope in weeks 1–12Change in level at week 13Change in slope after week 13
Alsallakh et al. BMC Medicine(2021) 19:124Page 5 of 10Fig. 2 Weekly count of deaths with COPD as the underlying cause in Scotland and Wales in 2020 and the corresponding 5-year averages (2015–2019, points) in addition to modelled trend linesa 39% instantaneous reduction in those consultationsafter adjusting for the 5-year averages (IRR 0.61, 95%CI 0.52 to 0.71). After week 13 of 2020, the slopecontinued to decline although it was less steep thanthe pre-lockdown slope (IRR for change in slope:1.03, 95% CI 1.01 to 1.04). The estimated effects didnot change after restricting the analysis to those witha smoking history who died at the age of 35 years(Table D, Additional file 1).unlike the corresponding slope in the baseline period whichwas decreasing. Introducing lockdown was associated witha 46% fall in attendances compared with the 5-year averages (IRR 0.54, 95% CI 0.36 to 0.81). After week 13 of 2020,there was an upward slope (IRR for change in slope: 1.05,95% CI 1.01 to 1.09), unlike the corresponding slope in thebaseline period which continued to decrease. The estimatedeffects did not change after restricting the analysis to thosewith a smoking history who died at the age of 35 years(Table E, Additional file 1).Emergency department attendancesIn Wales, there were 625 COPD-related ED attendances inthe first 30 weeks of 2020. These events were consistentlylower in the weeks 1 to 30 in 2020 than in the same periodof the preceding 5 years (Fig. 4). There was no clear trendbefore lockdown (IRR 0.97, 95% CI 0.94 to 1.01, Table 4),DiscussionOur national level interrupted time-series analyses of theimpact of lockdown across Scotland and Wales foundsubstantial reductions in severe AECOPD leading to EDattendance and/or hospital admission as well as the lessTable 2 Poisson models of deaths with COPD as the underlying cause in 2020 and the corresponding 5-year averages (2015–2019).ScotlandWalesPooled estimatesIRR (95% CI)p valueIRR (95% CI)p valueIRR (95% CI)p value0.87 (0.70, 1.08)0.2060.85 (0.66, 1.11)0.2340.86 (0.73, 1.02)0.0835-year average0.96 (0.94, 0.98) 0.0010.98 (0.96, 1.00)0.0630.97 (0.95, 0.98) 0.00120200.98 (0.96, 1.00)0.0420.97 (0.94, 0.99)0.0040.97 (0.96, 0.99)0.0012020 relative to 5-year average1.02 (0.99, 1.05)0.2400.99 (0.95, 1.02)0.4461.00 (0.98, 1.03)0.6735-year average1.02 (0.84, 1.22)0.8690.95 (0.75, 1.20)0.6570.99 (0.86, 1.14)0.88320201.09 (0.89, 1.33)0.4171.03 (0.81, 1.32)0.8031.06 (0.91, 1.24)0.4322020 relative to 5-year average1.07 (0.81, 1.41)0.6271.09 (0.78, 1.53)0.6271.08 (0.87, 1.33)0.4945-year average1.02 (1.00, 1.04)0.0840.99 (0.97, 1.02)0.6871.01 (0.99, 1.03)0.26620200.99 (0.97, 1.01)0.4110.99 (0.96, 1.02)0.6990.99 (0.97, 1.01)0.3792020 relative to 5-year average0.97 (0.94, 1.00)0.0781.00 (0.96, 1.04)0.9970.98 (0.96, 1.01)0.169Pre-lockdown intercept in 2020 compared to 5-year averageSlope in weeks 1–12Change in level at week 13Change in slope after week 13
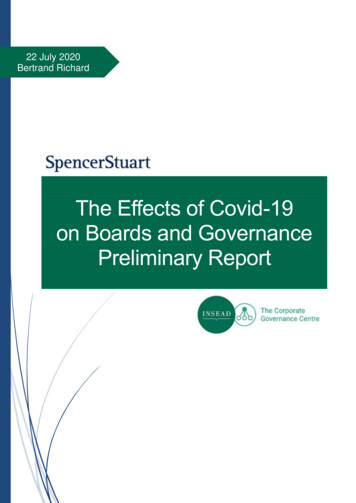
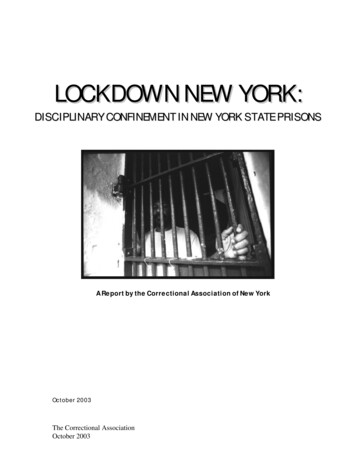
Alsallakh et al. BMC Medicine(2021) 19:124Page 6 of 10Table 3 Poisson models of primary care consultations for acute exacerbations of COPD in Wales in 2020 and the corresponding 5year averages (2015–2019)Pre-lockdown intercept in 2020 compared to 5-year averageIRR (95% CI)p value0.76 (0.68, 0.86) 0.001Slope in weeks 1–125-year average0.97 (0.96, 0.98) 0.00120200.93 (0.92, 0.94) 0.0012020 relative to 5-year average0.96 (0.95, 0.97) 0.001Change in level at week 135-year average1.05 (0.95, 1.16)0.32220200.64 (0.56, 0.72) 0.0012020 relative to 5-year average0.61 (0.52, 0.71) 0.001Change in slope after week 135-year average1.01 (1.00, 1.02)0.04320201.03 (1.01, 1.04) 0.0012020 relative to 5-year average1.01 (1.00, 1.03)0.147severe AECOPD that are recorded in primary care. Thelevels remained well below the corresponding 5-year averages throughout the study period. The easing of strictlockdown restrictions announced at the end of May 2020[38, 39] did not lead to a substantial rebound in theseevents, but there was a gradual rise in ED attendances andadmissions. There was no evidence of an increase indeaths due to COPD during the lockdown.These findings are especially significant given thatCOPD exacerbations are one of the commonest reasonsfor emergency admission to hospital [40]. Reduced incidence of AECOPDs therefore increases healthcareFig. 3 Weekly count of primary care consultations for acuteexacerbation of COPD in Wales in 2020 and the corresponding 5-yearaverages (2015–2019, points) in addition to modelled trend linescapacity and resources available for those with COVID19, as well as conferring obvious benefits to people withCOPD. A reduction in AECOPD admissions is also particularly advantageous given the specific challenges in thehospital management of AECOPD during the pandemic—components of care, such as non-invasive ventilation(NIV), are associated with increased risk of viral transmission due to aerosolization [41] and can therefore only bedelivered in specified clinical areas.To the best of our knowledge, this is the first nationallevel analysis of the impact of the COVID-19 lockdownon AECOPD incidence and mortality, using data acrossFig. 4 Weekly count of COPD-related emergency departmentattendances in Wales in 2020 and the corresponding 5-yearaverages (2015–2019, points) in addition to modelled trend lines
Alsallakh et al. BMC Medicine(2021) 19:124Page 7 of 10Table 4 Poisson models of COPD-related emergency department attendances in Wales in 2020 and the corresponding 5-yearaverages (2015–2019)Pre-lockdown intercept in 2020 compared to 5-year averageIRR (95% CI)p value0.65 (0.48, 0.88)0.006Slope in weeks 1–125-year average0.97 (0.94, 0.99)0.00620200.97 (0.94, 1.01)0.1012020 relative to 5-year average1.01 (0.97, 1.05)0.686Change in level at week 135-year average1.08 (0.85, 1.38)0.50820200.59 (0.42, 0.82)0.0022020 relative to 5-year average0.54 (0.36, 0.81)0.003Change in slope after week 135-year average1.02 (0.99, 1.05)0.22720201.05 (1.01, 1.09)0.0192020 relative to 5-year average1.03 (0.98, 1.08)0.256primary and secondary care as well as data on deaths.We used population-based data with high-to-completegeographical coverage across Scotland and Wales, whichenabled comparison of findings between the two UK nations, which were broadly comparable.Our study has some limitations. Firstly, there are novalidated case definitions for COPD admissions ordeaths in UK data, and so the case definitions used mayhave variable accuracy. We did not include deaths withCOPD as a contributing cause because they would nothave been specific enough for the purpose of this study.Data on AECOPD in primary care and ED data isunder-recorded [42, 43]. However, our sensitivity analysis, limiting data to those aged 35 and ever-smokers,did not impact our overall results. Further, given that wewere interested in trends over time rather than absolutenumbers and that coding practices of these events areunlikely to have changed, this is unlikely to have significantly affected our findings.The observed reduction in AECOPDs during lockdowndoes not necessarily imply direct causal effects of lockdown. Nonetheless, they are likely to have been mediatedby reductions in the transmission of other respiratorypathogens and outdoor air pollution during lockdown [7,8, 14], both of which have a major role in triggeringAECOPD [44]. These factors could also have mediatedthe reductions in emergency admissions for asthma thathave been reported following lockdowns [45–48].A number of potential confounding factors such aschanges in prescribing for COPD [49], behaviouralchanges related to improved self-management andsmoking reduction/cessation [50], and possibly improvedair quality [7] during the first wave of pandemic mighthave contributed to the observed reduction inAECOPDs. However, we were not in a position to adjustfor these potential sources of bias. Care therefore needsto be taken when interpreting our findings. Furthermore,national messaging on the need to avoid overwhelmingthe NHS and the fear about the spread of SARS-CoV-2might have contributed to the fall in AECOPD-relatedED attendances and admissions during the first wave ofthe pandemic. However, this effect on healthcareseeking behaviour is likely limited in those experiencinga severe AECOPD, which usually requires hospital assessment and treatment. In addition, the correspondingdecline in AECOPD in primary care records suggests atrue decline in incidence during lockdown. However, itis possible that the milder forms of AECOPDs have beenself-managed by patients and were not presented to thehealth care system during lockdown.The lifting of restrictions on travel and social contactwas associated with a gradual rise in emergency admissions for AECOPD seen in our data for Scotland andWales. This could be partly due to an increase in the circulation of respiratory viruses (mainly rhinoviruses initially) [8] and levels of outdoor air pollutants [51].However, this could also be explained by an increasingthreshold of hospital admission, since primary care consultations for AECOPD continued to fall towards summer in accordance with the typical seasonal trend ofAECOPD in the UK [52].Although there is extensive literature on COPD as arisk factor for COVID-19 severe outcomes and deaths[53–55], there is currently limited data examining howthe pandemic, and specifically lockdowns, has affectedCOPD deaths more widely. Two studies from HongKong and England reported no difference in inpatientmortality during admissions for COPD exacerbation [13,
Alsallakh et al. BMC Medicine(2021) 19:12415]. Analysis of excess mortality from specific conditionsis important in understanding whether reductions inemergency healthcare utilisation represent a true reduction in incidence or avoidance of healthcare settings, thelatter of which could lead to increased mortality. Ourstudy has shown no significant increase in non-COVIDCOPD deaths over the first 30 weeks of 2020. This is incontrast to a recent analysis of cardiovascular mortalityin England and Wales [3], which demonstrated excessnon-COVID acute cardiovascular deaths. The authorssuggested that people with these diagnoses either didnot seek help for their illness or were not referred tohospital, consistent with the greatest proportional increase in cardiovascular deaths occurring in communitysettings. Data from England from March to September2020 from the Office for National Statistics shows thatCOVID-19 accounted for over 90% of excess deathsamong those aged over 75 from both sexes, but the proportion of non-COVID excess deaths was higher acrossyounger people [56]. The leading causes of these nonCOVID excess deaths were dementia, ischaemic heartdisease, cerebrovascular disease and other circulatorydiseases. Deaths in England due to “chronic lower respiratory diseases” (ICD-10 codes J40-47) includingCOPD actually fell compared to expected levels whenassessed cumulatively from March to September 2020[56], consistent with our findings in Scotland and Wales.There are several important areas for future investigation to understand underlying reasons for our findings.These include person-level analyses of how factors related to COPD, such as disease severity, control andhealth service utilisation and positive drivers such as reduced exposure to respiratory pathogens and pollutants,improved self-management, smoking cessation and otherbehavioural changes, might have affected the risk ofAECOPD and related death during lockdown. If furtherwork suggests that altered outdoor air pollution levelshave played a significant role, findings should spur increased drive to improve air quality longer term [57].Other interventions with the potential to produce lastingreductions in the rate of severe AECOPD include the facilitation of self-management of chronic conditions andthe consolidation of public health messages to reducethe transmission of respiratory infections, includinghand hygiene, use of facemasks and wider deployment oftesting and isolation when viruses are most likely to becirculating.ConclusionsWe found significant declines in AECOPDs across primary and secondary care in Scotland and Wales duringthe initial UK-wide lockdown in 2020, with no associated increase in non-COVID deaths due to COPD. Ourstudy strengthens the notion that outcomes relating toPage 8 of 10chronic respiratory disease improved during the lockdown period. It is crucial to assess the fuller impact ofthe pandemic on care and outcomes in chronic healthconditions such as COPD, including non-COVID relatedmorbidity and mortality. This will inform the targetingof public health strategy to minimise any adverse effectsas well as capture any positive elements that could beharnessed to reduce hospital admissions in vulnerablegroups over the longer term.AbbreviationsADDE: Annual District Death Extract; AECOPD: Acute exacerbation of chronicobstructive pulmonary disease; ALF: Anonymous Linking Field; CI: Confidenceinterval; COPD: Chronic obstructive pulmonary disease; COVID19: Coronavirus disease 2019; ED: Emergency department; EDDS: EmergencyDepartment Dataset; FERITS: Framework for Enhanced Reporting ofInterrupted Time Series; ICD: International Statistical Classification of Diseases;IRR: Incidence rate ratio; LOS: Length of stay; NHS: National Health Service;NIV: Non-invasive ventilation; NRS: National Records of Scotland; ONS: Officefor National Statistics; PEDW: Patient Episode Database for Wales; PHS: PublicHealth Scotland; RECORD: REporting of studies Conducted usingObservational Routinely-collected Data; SAIL: Secure Anonymised Infor
severe COPD exacerbations: COPD-related emergency hospital admission, and death due to COPD. Emergency admissions for COPD were defined as those with a pri-mary diagnosis of COPD recorded using the J43 and J44 codes of the 10th revision of the International Statistical Classification of Diseases (ICD-10). These data were ex-