Transcription
AcceleratingAcceptance 2016A Harris Poll survey of Americans’acceptance of LGBT people1
“GLAAD’s findingsAcceleratingAcceptance 2016point to a culture ofcomplacency, whereinthe non-LGBT publicis under the false andpotentially dangerousimpression thatthe work for LGBTequality is done.Introduction2015 represented an especially historic year in the movementfor LGBT equality, with the Supreme Court’s landmark ruling inObergefell v. Hodges, which guaranteed same-sex couples the rightto marry nationwide. Notwithstanding the American public hasgrown well beyond majority status in support for marriage equalityand we have reached what TIME Magazine called the “transgendertipping point,” GLAAD’s recent survey results, conducted by HarrisPoll, reveal that other key, yet perhaps more nuanced attitudesabout LGBT people are lagging and the cause of AcceleratingAcceptance in 2016 and beyond must continue.“With the monumental progress achieved for marriage equalityalso comes a misperception that LGBT people are now fully equalin the eyes of the law. For example, half of non-LGBT Americans(50%) currently believe that “gay people have the same rights aseverybody else,” GLAAD’s survey reveals. GLAAD’s findings point toa culture of complacency, wherein the non-LGBT public is under thefalse and potentially dangerous impression that the work for LGBTequality is done.Yet, GLAAD’s survey also reveals that slow but steady progressis being made for acceptance of LGBT people. In many of the‘comfortability’ questions central to GLAAD’s AcceleratingAcceptance survey, non-LGBT Americans report significantly lessdiscomfort than was reported in 2014. Whereas in 2014 over 36%of non-LGBT Americans said they were “very uncomfortable” or“somewhat uncomfortable” seeing a same-sex couple holdinghands, this year’s survey finds 29% of non-LGBT Americans areuncomfortable in the same scenario, a notable decline of sevenpercentage points. Still, these Americans’ level of discomfortremains about the same year over year when asked about theirchildren, once again indicating there is still much work to be done.In Accelerating Acceptance, GLAAD celebrates the progress thathas been achieved in recent years and signals concern with theemerging complacency and ambivalence. Most importantly, GLAADremains committed to its leadership role identifying, amplifying,and ultimately breaking down barriers to full LGBT acceptance.MethodologyThe 2015 and 2014 surveys were conducted online within the UnitedStates by Harris Poll on behalf of GLAAD. The 2015 survey was fielded from October 5-7, 2015 among2,032 adults ages 18 and older. The non-LGBT sub-sample was1,781. The 2014 survey was conducted online within the United Statesby Harris Poll on behalf of GLAAD from November 10-12, 2014among 2,010 adults ages 18 and older. The non-LGBT subsample was 1,821.This online survey is not based on a probability sample and thereforeno estimate of theoretical sampling error can be calculated.For complete survey methodology, including weighting variables,please contact Seth Adam, GLAAD’s Director of Communications, atseth@glaad.org.Contributing author: Daniel Berrier, Northstar Research Partners2
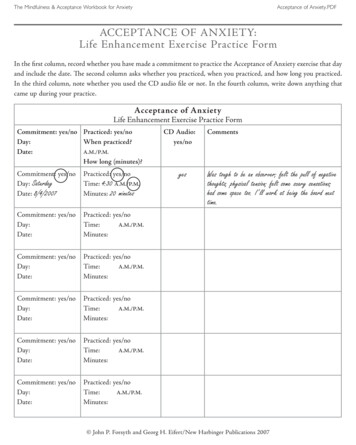
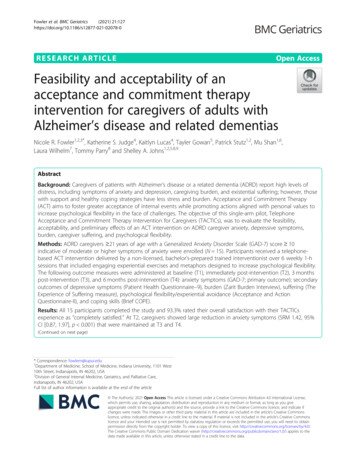
1Progress over the last year inacceptance of the LGBT communityThere is no mistaking that the LGBT community and its allies have made immense strides, withsignificant gains for legal equality achieved in 2015. GLAAD’s Accelerating Acceptance survey showsnon-LGBT Americans are also growing more comfortable with LGBT people, indicating increasedlevels of acceptance. In fact, in most situations surveyed, these Americans report less discomfort withLGBT people than was reported the previous year. Notably, the scenarios that saw the most changewere also those that were the most personal, for example seeing a couple hold hands and learning afamily member is LGBT. Perhaps not surprisingly, the exception to this progress was on issues involvingchildren, such as “learning that my child had a lesson on LGBT history in their school,” where more thana third of non-LGBT Americans are still uncomfortable.% of non-LGBT Americans “very uncomfortable” or“somewhat uncomfortable” in given situations36%Seeing a same-sexcouple holding hands2014Learning a familymember is LGBT2014Having LGBT membersat your religious placeof worship2014Learning my doctoris LGBT2014Seeing an LGBTco-worker’swedding picture2014Learning my child’steacher is LGBT2014Learning my childhad a lesson on LGBThistory in their 327%26%22%31%28%27%26%30%29%
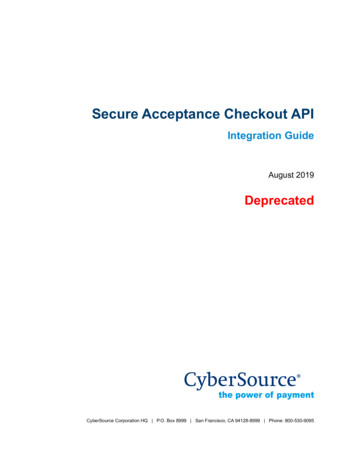
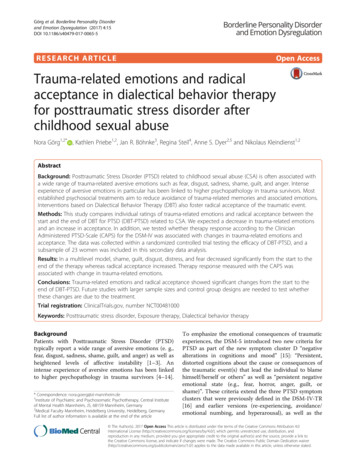
Building on GLAAD’s first Accelerating Acceptance survey, this year’s study built an acceptance scalebased on responses of non-LGBT people to the LGBT community. To better understand how supportdiffers across society, this year’s study split non-LGBT Americans into three segments based on professedcomfort across seven surveyed LGBT-themed situations:1.Allies: Non-LGBT Americans who were either very or somewhat comfortable with all situations (51% of the2.3.Detached Supporters: Non-LGBT Americans whose comfort level varied across situations (35% of the sample)Resisters: Non-LGBT Americans who were either very or somewhat uncomfortable with all situations (14%sample)of the sample)2Complacency setting in among alarge number of non- LGBT AmericansDespite measurable progress, the data also suggests a growing complacency appears to be developingabout the state of the LGBT community in America. Perhaps because marriage equality was so widelycovered by the media in 2015, half of all non-LGBT Americans now report that ‘gay people have the samerights as everybody else.’ This is where Detached Supporters tend to look more like Resisters than Allies.Perception of LGBT rights andinfluence by non-LGBT Americans(% of non-LGBT respondents who agreed with the following statements)In the United States today, gay people have the same rights as everybody else.Total Non-LGBT Segment50%Allies43%Detached Supporters61%Resisters48%23% strongly agree22% strongly agree22% strongly agree30% strongly agreeGay, lesbian, bisexual, and transgender people receive more media attentiontoday than other minority communities.Total Non-LGBT Segment55%Allies42%Detached Supporters69%Resisters69%24% strongly agree10% strongly agree34% strongly agree48% strongly agreeThe gay, lesbian, bisexual, and transgender community has more influence thanother minority communities.Total Non-LGBT Segment34%Allies22%Detached Supporters47%Resisters47%12% strongly agree6% stronglyagree15% strongly agree25% strongly agreeMost politicians support policies favorable to gay, lesbian, bisexual, andtransgender people.Total Non-LGBT Segment8% stronglyagree30%Allies22%Detached Supporters37%Resisters45%5% stronglyagree10% strongly agree17% strongly agree4
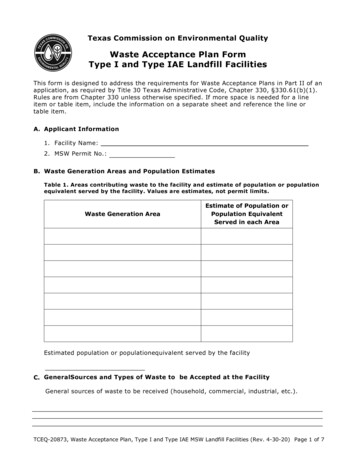
3Many non-LGBT Americans areunconcerned by or unaware of LGBT issuesBeyond being denied basic legal rights at both the state and federal level – such as protection from discriminationin employment, housing, and public accommodations – LGBT citizens also face many serious negative socialconsequences, including disproportionate rates of homelessness, mental illness, and violence. Yet, a significantnumber of non-LGBT Americans report that many of the issues still facing the LGBT community are not serious,indicating a lack of knowledge or lack of interest in the harsh realities LGBT people face.Perception of LGBT problems by non-LGBT Americans(total % of non-LGBT respondents who stated that the following problemswere not serious; strongest responses of disbelief highlighted)HIV and AIDS in the gay, lesbian,bisexual, and transgender upporters26%Resisters35%TotalNon-LGBTSegment6% “not at all serious”3% “not at all serious”5% “not at all serious”17% “not at all rs57%2% “not at all rs51%6% “not at all serious”30% “not at all rs60%13%32%Resisters52%8% “not at all serious”2% “not at all serious”8% “not at all serious”27% “not at all rs58%9% “not at all serious”2% “not at all serious”9% “not at all serious”31% “not at all serious”Homeless gay, lesbian, bisexual, andtransgender teensTotalNon-LGBTSegment9% “not at all serious”4% “not at all serious”37%Allies22%11% “not at all serious”DetachedSupporters51%25% “not at all serious”Resisters58%Racism within the gay, lesbian,bisexual, and transgender ersTotalNon-LGBTSegment7% “not at all serious”Social acceptance of gay, lesbian,bisexual, and transgender peopleTotalNon-LGBTSegment25%Acts of violence against transgenderpeopleActs of violence against gayand lesbian peopleTotalNon-LGBTSegmentDepression & suicide among gay, lesbian,bisexual, and transgender people11% “not at all serious”5% “not at all serious”13% “not at all serious”29% “not at all serious”510% “not at all serious”4% “not at all serious”10% “not at all serious”30% “not at all serious”
4Ambivalence toward otherimportant LGBT issuesIn addition to the aforementioned undercurrent of complacency regarding the state of LGBT issues, thesurvey data also suggests an unusually high level of ambivalence, or people who report they neitherdisagree nor agree with statements about the LGBT community. Roughly a third of non-LGBT Americansprofess no strong opinion about important LGBT issues. Interestingly, this ambivalence appears acrosssegments, including Allies.w% of non-LGBT Americans who neitheragreed nor disagreed with the followingstatementsThe gay, lesbian, bisexual, andtransgender community has moreinfluence than other minority communities.It is best for a child to be raised by amother and a father as opposed to twofathers or two mothers.DR esiT38%Gay, lesbian, bisexual, and transgenderpeople receive more media attention todaythan other minority communities.Segment30%DpTBentpoLGi e s 39%32%Sete rsr s 25%R esis 22%n-rteoTo t a l Nste rAllgmr s 26%Most politicians support policiesfavorable to gay, lesbian, bisexual, andtransgender people.R esiBSes 14%i e s 37%uetached Sptached SuLGTrteAllDeonTo t a l Npote rsentpi e s 46%Bgmr s 32%poLGAlls 28%n-BSerteoTo t a l NsR esiptached SuLGTte ruetached SDeonTo t a l NporteAllgms 32%r s 41%i e s 36%ent37%Summary2015 was a monumental year for the LGBT community. The Supreme Court ruling that marriageequality is a matter of equal dignity under the law afforded by the United States Constitutionrepresents the culmination of decades of hard work and advocacy. However, even as we celebrateimportant advances, we must be mindful of momentum slowing, of becoming prematurelycomplacent or ambivalent. We must continue to raise awareness of and advocate for a broaderspectrum of LGBT equality and acceptance — beyond the single issue of marriage equality. Thehard work of legislative change must go hand in hand with that which cannot be conducted in acourtroom: changing the hearts and minds of society.6
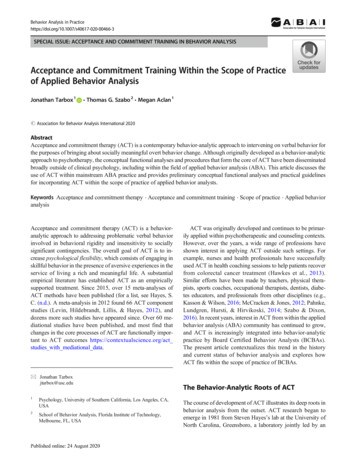
Demographic make-up of three segmentsof Americans on LGBT issues GenderAllies are more likely to be female, whereasResisters are more likely to be male.IncomeAllies are more likely to either be middle incomeand/or especially very high income. Resistersare lower income. Detached Supporters are morelikely to be upper middle income.AgeEducationAllies are more likely to be young, whereas Resisterstend to be between the ages of 45 - 64. DetachedSupporters are relatively evenly distributed, thoughslightly more likely to be over 65.Resisters are more likely to be less educated, whileAllies are more likely to have gone to college orgraduate school. Detached Supporters tend toeither be well-educated or poorly educated.RegionAllies are concentrated in the Northeast and West,while Resisters live in the South and Midwest.Detached Supporters are most likely to live in theMidwest.ALLAMERICANS% (INDEX)*Gender%ALLIES(INDEX)*DETACHEDSUPPORTERS% (INDEX)*RESISTERS% (INDEX)*49.5% (103)53.2% (111)Male48.1% (100)44.4%Female51.9% (100)55.6% (107)50.5%(97)46.8%Under 35k27.5% (100)24.2%27.3%(99)29.5% (107) 35K to 75k31.9% (100)34.2% (107)32.0% (100)30.1% 75k - 125k24.6% (100)24.1%27.4% (111)25.0% (101) 125k 16.0% (100)17.4% (109)13.3%15.4%High school or less (no college)32.1% (100)28.5%34.3% (107)40.5% (126)Some college19.3% (100)19.6% (101)18.9%(98)16.5%(87)9.7% (102)7.4%(78)(85)16.7%(78)8.9% cation9.0%(89)Associate’s degree9.5% (100)College graduate21.5% (100)26.1% (121)Graduate school8.3% (100)8.8% (106)Job training9.4% (100)8.1%(95)(86)18.2%10.0% (107)15.8%(169)Age18 to 2410.6% (100)11.1% (105)25 to 3419.4% (100)18.9%35 to 4415.3% (100)45 to 547.8%(74)5.0%(48)17.4%(90)13.6%(70)16.3% (106)15.3% (100)14.9%(97)16.4% (100)15.0%16.3%(99)25.0% (152)55 to 6419.3% (100)19.4% (101)20.1% (104)23.8% (123)65 19.0% (100)19.4% (103)23.1% (122)17.7%(93)Northeast21.5% (100)23.0% (107)21.4% (100)18.4%(86)Midwest21.7% (100)20.9%(96)24.1% (111)22.9% (105)South33.6% (100)30.8%(91)33.9% (101)35.5% (106)West23.2% (100)25.4% (110)20.6%23.2% (100)(97)(91)Region(89)* e.g., 21.5% of the general population are college graduates. 26.1% of allies are college graduates. Therefore, an ally is 1.21x more likely than the general population to be a college graduate.7
BoilerplateGLAAD rewrites the script for LGBTacceptance. As a dynamic media force,GLAAD tackles tough issues to shapethe narrative and provoke dialoguethat leads to cultural change. GLAADprotects all that has been accomplishedand creates a world where everyonecan live the life they love.glaad.orgfacebook.com/glaadtwitter.com/glaad8
The 2015 and 2014 surveys were conducted online within the United States by Harris Poll on behalf of GLAAD. The 2015 survey was fielded from October 5-7, 2015 among 2,032 adults ages 18 and older. The non-LGBT sub-sample was 1,781. The 2014 survey was conducted online within the United States