Transcription
Advancing SustainableMaterials Management:2015 Fact SheetAssessing Trends in Material Generation, Recycling,Composting, Combustion with Energy Recovery andLandfilling in the United StatesJuly 2018
IntroductionThe U.S. Environmental Protection Agency (EPA) has collected and reported data on the generation and disposition ofmunicipal solid waste (MSW) in the United States for more than 30 years. This information is used to measure thesuccess of materials management programs across the country and to characterize the national waste stream. Thesefacts and figures are based on the most recent information, which is from calendar year 2015.In 2015, in the United States, approximately 262 million tons (U.S. short tons unless specified) of MSW were generated(See Figure 1). Of the MSW generated, approximately 68 million tons of MSW were recycled and 23 million tons of MSWwere composted. Together, more than 91 million tons of MSW were recycled and composted, equivalent to a 34.7percent recycling and composting rate (See Figure 2). In addition, more than 33 million tons of MSW (12.8 percent) werecombusted with energy recovery. Finally, more than 137 million tons of MSW (52.5 percent) were landfilled (See Figure3 and Table 1).Information about waste generation and disposal is an important foundation for managing materials. Sustainablymanaging materials requires thinking beyond waste and instead focusing on the life cycle of a product, from the time it isproduced, used, reused and ultimately recycled or discarded. This is known as Sustainable Materials Management(SMM). SMM refers to the use and reuse of materials in the most productive and sustainable way across their entire lifecycle. SMM conserves resources, reduces waste and minimizes adverse environmental impacts from materials.This report analyzes MSW trends in generation and management, materials and products, and economic indicatorsaffecting MSW. It also includes a section on the generation of construction and demolition (C&D) debris, which is not apart of MSW, but comprises a significant portion of the non-hazardous solid waste stream.Figure 1. MSW Generation Rates, 1960 to 20152
Figure 2. MSW Recycling and Composting Rates, 1960 to 2015Figure 3. Management of MSW in the United States, 20153
Table 1. Generation, Recycling, Composting, Combustion with Energy Recovery and Landfilling of Materials in MSW, 2015*(in millions of tons and percent of generation of each tedWeightCombustedwith EnergyRecoveryWeightLandfilledRecycling asPercent ofGenerationCompostingas Percent ofGenerationCombustionas Percent ofGenerationLandfilling asPercent ofGenerationPaper and .5%-13.9%67.6%Other nonferrous metals†2.221.50-0.060.6667.6%-2.7%29.7%Total 4.503.14-5.3526.019.1%-15.5%75.4%Rubber and 811.0616.3%-15.8%67.9%Other .77-22.7893.4436.8%-12.4%50.8%Food, other‡39.73-2.107.3830.25-5.3%18.6%76.1%Yard laneous inorganic wastes3.99--0.783.21--19.5%80.5%Total other wastes78.44-23.3910.7944.26-29.8%13.8%56.4%Total municipal solid %MaterialMetalsTotal materials in productsOther wastes* Includes waste from residential, commercial and institutional sources.Details might not add to totals due to rounding.† Includes lead from lead-acid batteries.Negligible Less than 5,000 tons or 0.05 percent.A dash in the table means that data are not available.‡ Includes collection of other MSW organics for composting.4
Trends in Municipal Solid WasteOur trash, or MSW, is comprised of various items consumers throw away. These items include packaging, food,yard trimmings, furniture, electronics, tires and appliances. MSW does not include industrial, hazardous or C&Dwaste. Sources of MSW include residential waste (including waste from multi-family housing) and waste fromcommercial and institutional locations, such as businesses, schools and hospitals.Over the last few decades, the generation, recycling, composting, combustion with energy recovery andlandfilling of MSW have changed substantially. Solid waste generation peaked at 4.74 pounds per person perday in 2000. However, the rate of 4.48 pounds per person per day in 2015 is slightly higher than the 2014 rate,which was 4.45 pounds per person per day (See Figure 1).The combined recycling and composting rate increased fromless than 10 percent of generated MSW in 1980 to 34.7 percentin 2015 (See Figure 2). Without including composting, recyclingalone rose from 14.5 million tons (9.6 percent of MSW) in 1980to 67.8 million tons (25.8 percent) in 2015. Composting wasnegligible in 1980, and it rose to 23.4 million tons in 2015 (8.9percent; see Figure 3 and Table 2 for details).FoodNationally, the composting of foodrose from 1.94 million tons in 2014(5 percent of food) to 2.10 milliontons in 2015 (5.3 percent of food).Combustion with energy recovery was less than 2 percent ofgeneration in 1980 (2.8 million tons). In 2015, more than 33.5million tons (12.8 percent of MSW generated) were combusted with energy recovery (See Table 2).Since 1990, the total amount of MSW going to landfills dropped by 7.6 million tons, from 145.3 million to137.7 million tons in 2015 (See Table 2). The net per capita 2015 landfilling rate was 2.3 pounds per day,which was lower than the 3.2 per capita rate in 1990 (See Table 3).Table 2. Generation, Recycling, Composting, Combustion with Energy Recovery and Landfilling of MSW,1960 to 2015 (in millions of on with Landfilling and 136.2137.7*†Composting of yard trimmings, food and other MSW organicmaterial. Does not include backyard composting.Includes combustion of MSW in mass burn or refuse-derived fuelform, and combustion with energy recovery of source separatedmaterials in MSW (e.g., wood pallets, tire-derived fuel).5‡ Landfilling after recycling, composting and combustionwith energy recovery. Includes combustion withoutenergy recovery.Details might not add to totals due to rounding.neg. Negligible less than 5,000 tons or 0.05 percent.
Table 3. Generation, Recycling, Composting, Combustion with Energy Recovery and Landfilling of MSW,1960 to 2015 (in pounds per person per 0.40.40.40.4Combustion with illing and 4.0227.3249.9281.4296.4309.1318.9320.9Population (In millions)*†Composting of yard trimmings, food, and other MSWorganic material. Does not include backyard composting.Includes combustion of MSW in mass burn or refuse-derivedfuel form, and combustion with energy recovery of sourceseparated materials in MSW (e.g., wood pallets, tire-derivedfuel).‡ Landfilling after recycling, composting, and combustionwith energy recovery. Includes combustion withoutenergy recovery.Details might not add to totals due to rounding.neg. Negligible less than 5,000 tons or 0.05 percent.Analyzing MSWEPA analyzes MSW by breaking down the data in two ways: by material or by product. Materials are made intoproducts, which are ultimately reprocessed through recycling or composting, or managed by sending them tocombustion with energy recovery facilities or landfills. Examples of materials that EPA tracks include paper andpaperboard, plastics, metals, glass, rubber, leather, textiles, wood, food and yard trimmings. For a full list ofmaterials, see Table 1.Products are what people buy and handle, and they are manufactured out of the types of materials listed above.Product categories include containers and packaging, nondurable goods, durable goods, food and yardtrimmings. Containers and packaging, such as milk cartons and plastic wrap, are assumed to be in use for ayear or less; nondurable goods like newspaper and clothing are assumed to be in use for less than three years;and durable goods, such as furniture, are assumed to be in use for three or more years. Some products, suchas appliances, may be made of more than one material. Information about products shows how consumers areusing and discarding materials and offers strategies on how to maximize source reduction, recycling andcomposting of materials.Materials in MSWTable 1 and the following figures provide specific information about materials in municipal solid waste. Table 1shows generation, recycling, composting, combustion with energy recovery and landfilling by material, by weightand percent of generation.6
Figure 4 below provides the breakdown of MSWgeneration by material. Paper and paperboard, and foodcontinued to be the largest components of MSWgenerated. Paper and paperboard accounted for about26 percent, while food accounted for 15 percent. Yardtrimmings and plastics comprised about 13 percenteach. The remaining amount of MSW generatedconsisted of rubber, leather, and textiles; metals; wood;glass and other materials.Composting Collection Programs 1,2 About 3,860 community compostingprograms were documented in 2015—anincrease from 3,227 in 2002. Food composting curbside collectionprograms served 3.8 million households in2015. About 5.4 million households hadaccess to drop-off food collectionprograms that year.Figure 5 provides the breakdown of MSW recycling bymaterial. Paper and paperboard was the largestcomponent of MSW recycling, representing nearly 67percent. Metals made up 12 percent of MSW recycled.The remaining amount of MSW recycled consisted of rubber, leather, and textiles; plastics; glass; wood andother materials.Figure 6 provides the breakdown of MSW composting by material. Yard trimmings made up 91 percent of MSWcomposted. Food made up the remaining 9 percent of material composted.Figure 7 provides the breakdown of MSW combustion with energy recovery.Figure 8 provides the breakdown of MSW landfilling.Figure 4. Total MSW Generation (by material), 2015262 Million Tons7
Figure 5. Total MSW Recycling (by material), 201568 Million TonsFigure 6. Total MSW Composting (by material), 201523 Million TonsFigure 7. Total MSW Combusted with Energy Recovery (bymaterial), 2015 34 Million TonsFigure 8. Total MSW Landfilled (by material), 2015138 Million Tons8
Products in MSWThe following information provides the details of the products found in municipal solid waste. Table 4 showsgeneration, recycling, composting, combustion with energy recovery and landfilling by product category, weightand percent of generation. Figure 9 displays selected products with high recycling and composting rates.Containers and packaging made up the largest portion of MSW generated at almost 78 million tons (29.7percent). Nondurable and durable goods were more than 50 million tons each (about 20 percent for each). Foodwas 39.7 million tons (15.1 percent), yard trimmings were 34.7 million tons (13.2 percent), and other wasteswere about four million tons (1.5 percent).Containers and packaging was the product category with the highest recycling rate with approximately 53percent of the generated materials recycled. Paper products, steel and aluminum were the most recycledmaterials by percentage in this category. The recycling of nondurable goods was approximately 31 percent.Paper products such as newspapers/mechanical papers were the most recycled nondurable goods.Newspapers/mechanical papers include newspapers, directories, inserts, as well as some advertisement anddirect mail printing. Overall, about 19 percent of durable goods were recycled. With a 99 percent recycling rate,lead-acid batteries continued to be one of the most recycled products.Yard trimmings was the product category with the highest composting rate at 61.3 percent. Food in MSW wascomposted at a rate of 5.3 percent.Food was the product category with the highest rate of combustion with energy recovery with a rate of nearly 19percent. Durable goods were combusted at a rate of nearly 16 percent and nondurables at a rate of nearly 14percent. Containers and packaging, and yard trimmings were combusted at rates below 10 percent.Food was the product category with the highest landfill rate at 76 percent. Durable goods followed with a landfillrate of 65 percent. Nondurable goods had the third highest landfill rate at 55 percent. Containers and packaging,and yard trimmings were the product categories with the lowest landfill rates at 38 percent and 31 percent,respectively.Recycling RatesMeasured by percentage of generation, products with the highest recycling rates in 2015 were lead-acid batteries(99 percent), corrugated boxes (92.3 percent), steel cans (71.3 percent), newspapers/mechanical papers(71.2 percent), major appliances (61.7 percent), aluminum cans (54.9 percent), mixed paper (43.6 percent), tires(40.2 percent) and selected consumer electronics (39.8 percent). The 2015 composting rate for yard trimmingswas 61.3 percent (See 2015 data tables).9
Figure 9. Selected Products with High Recycling and Composting Rates, 2015**Does not include combustion with energy recovery.10
Table 4. Generation, Recycling, Composting, Combustion with Energy Recovery and Landfilling of Products in MSW, 2015*(in millions of tons and percent of generation of each edWeightCombustedwith EnergyRecoveryWeightLandfilledRecycling asPercentof GenerationComposting asPercentof GenerationCombustion asPercent ofGenerationLandfilling asPercent %Aluminum1.55--0.221.33--14.2%85.8%Other nonferrous .500.83-1.4910.186.6%-11.9%81.5%Rubber and 0.54-1.062.3413.7%-26.9%59.4%Other materials1.811.43-0.030.3579.0%-1.7%19.3%Total durable goods54.1510.25-8.6035.3018.9%-15.9%65.2%Paper and ics7.320.16-1.405.762.2%-19.1%78.7%Rubber and %Textiles11.771.91-1.937.9316.2%-16.4%67.4%Other .4%Total nondurable urable goodsNondurable goods(Continued on next page)11
Table 4. Generation, Recycling, Composting, Combustion with Energy Recovery and Landfilling of Products in MSW, 2015*(in millions of tons and percent of generation of each edWeightCombustedwith EnergyRecoveryWeightLandfilledRecycling asPercentof GenerationComposting asPercentof GenerationCombustion asPercent ofGenerationLandfilling asPercent .03-1.204.8933.2%-13.2%53.6%Paper and 1.405.7627.1%-14.3%58.6%Other .2%Total containers d, other‡39.73-2.107.3830.25-5.3%18.6%76.1%Yard laneous inorganicwastes3.99--0.783.21--19.5%80.5%Total other wastes78.44-23.3910.7944.26-29.8%13.8%56.4%Total municipal solid %ProductsContainers and packagingOther wastesDetails might not add to totals due to rounding.* Includes waste from residential, commercial and institutional sources.Negligible less than 5,000 tons or 0.05 percent.A dash in the table means that data are notavailable.† Includes lead from lead-acid batteries.‡ Includes collection of other MSW organics for composting.12
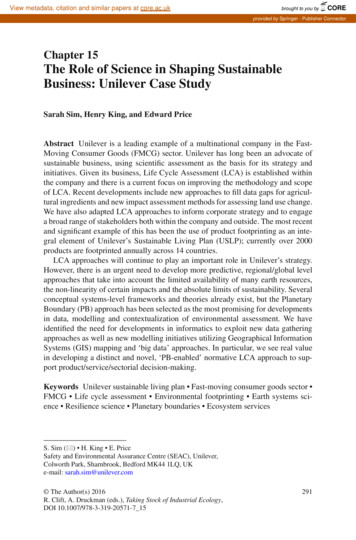
Economic IndicatorsThe Benefits of RecyclingHow our nation uses materials is fundamental to our economic and environmental future. Global competition forfinite resources is expected to continue to increase. A more productive and less impactful use of materials helpsour society remain economically competitive, contributes to our prosperity and protects the environment. Byusing waste materials as valuable raw materials, recycling creates jobs, builds more competitive manufacturingindustries and significantly contributes to the U.S. economy.EPA’s 2001 Recycling Economic Information (REI) Study evaluated the number of recycling jobs, wages andtax revenue. The Agency updated the study with a 2016 REI Report3 to increase the understanding of theeconomic implications of material reuse and recycling. The 2016 REI Report included updated information aboutthe number of recycling jobs, wages and tax revenue (See Figure 10). The report showed that the recycling andreuse of materials creates jobs while also generating local and state tax revenues. The data from the mostrecent year available (2007) showed that in 2007, recycling and reuse activities in the United States accountedfor: 757,000 jobs; 36.6 billion in wages; and 6.7 billion in tax revenues.This equates to 1.57 jobs for every 1,000 tons of materials recycled. Construction and demolition debrisprovided the largest contribution to all three categories (jobs, wages and tax revenue), followed by ferrousmetals and nonferrous metals, such as aluminum.The 2016 REI Report used an updated analytical framework and a new Waste Input-Output methodology, whichfocused on the life cycle of materials. These refinements offered significant improvements over the original 2001REI Study by providing a better definition of recycling and addressing double counting. This new methodologyassists decision makers and researchers in more accurately estimating the economic benefits of recycling, andit creates a foundation upon which additional studies can be built.13
Figure 10. Wages, Taxes and Jobs Attributed to RecyclingRecycled Commodity ValuesNormalized to 2015, using the Consumer Price Index (CPI) from the Bureau of Labor Statistics to account forinflation, Figure 11 depicts the commodity values for high-density polyethylene (HDPE) natural bottles;polyethylene terephthalate (PET) clear bottles; aluminum used beverage cans (UBC); steel cans; oldnewspaper (ONP) (grade 6); old corrugated containers (OCC) (grade 11); paper stock (PS) (grade 1) soft mixedpaper; and glass containers from 1990 to 2015.Data were not available for ONP, metals, plastics and glass in 1997 and 1998. For plastics, glass and metals,there was a transition in data sources between 1996 and 1999 and between 2004 and 2005, so some of thechange between years could be due to the methodology of the data source for capturing data.Figure 11 shows the indexed values by year for the recycled commodities. It is indexed to allow commodityvalues with different metrics, such as dollars per ton, dollars per gross ton and dollars per short ton, to be shownon the same graph and to compare their relative rates of change. The indexed value indicates the change invalue of the data since 1990, where one is equal to the value in 1990. For example, if for a given year theindexed value were two, then the commodity value for that year would be two times the 1990 value. In this case,if the 1990 value were 400, then the resulting year’s value would be 800.14
Figure 11 shows similar trends across all commodities for indexed values. For example, values for plastics andpapers spiked in 1995, and values for most commodities dipped in 2009 relative to their values in 1990.Additionally, many commodities, such as plastics and papers, also experienced a price spike in 2000, 2007 and2011. In contrast, the indexed lines for glass (which represent an average of flint, amber and green glasscontainer values), aluminum and steel cans appear to fluctuate less frequently.Figure 11. Indexed Recycled Commodity Values by YearNational mean annual commodity values were normalized to constant 2015 using the Consumer Price Index (CPI) from the Bureau of Labor Statisticsto allow meaningful comparisons. 1990 has an indexed value of 1. Soft mixed paper consists of a clean, sorted mixture of various qualities of paper notlimited as to type of fiber content. Prohibitive Materials may not exceed 1 percent. There are specific limits on the percent of contaminants allowed insoft mixed paper.Source: Pulp & Paper Global Fact & Price Book, 2003-2004. Page 128. Paperloop, Inc. 2004.Secondary Materials Pricing and Secondary Fiber Pricing. 2003-2015. Released September 2017. Available at http://www.recyclingmarkets.net/.Accessed September 2017.1970 to 2004 historical data tabulated from weekly or monthly industry publications and averaged annually during the time periods shown. Publicationsincluded Waste Age Recycling Times, Waste News, Paper Recycler, Miller Freeman, Inc.15
Landfill Tipping FeesFrom 1985 to 1995 there was a rapid rise in national landfill tipping fees, followed by a steady decrease from1995 to 2004. Since 2004, there has been a slow and steady average increase of about one percent per year inlandfill tipping fees (See Figure 12). The tipping fees are expressed in constant 2015 dollars.Figure 12. National Landfill Tipping Fees, 1982-2015 ( 2015 per ton)National mean annual landfill tipping fees were normalized to constant 2015 using the Consumer Price Index (CPI) from the Bureau of LaborStatistics to allow meaningful comparisons. This figure shows an average increase from 1985 to 1995 of 3.20 per year followed by a steadydecrease of 0.78 per year followed by an increase of 0.46 per year from 2004 to 2015.Source: National Solid Wastes Management Association (NSWMA) Municipal Solid Waste Landfill Facts. October 2011 (Data from 1985 to 2008).Waste Business Journal. “The Cost to Landfill MSW Continues to Rise Despite Soft Demand.” July 11, 2017 (Data for 2010 to 2015).MSW Generation and Household SpendingIn the U.S., the change in the amount of MSW generated typically mirrors trends in how much moneyhouseholds spent on goods and services. Personal Consumer Expenditures (PCE) measure householdspending on goods and services such as food, clothing, vehicles and recreation services. PCE is one of the fourcomponents of economic growth, along with government spending, private investments and net exports. AsPCE is an indicator of the household consumption of goods and services, which make up nearly 70 percent ofthe gross domestic product (GDP), PCE has a stronger conceptual tie to MSW generation than the other threeGDP components. PCE adjusted for inflation is referred to as real PCE. This metric is more useful in makingcomparisons over time because it normalizes the value of a dollar by considering how much a dollar could16
purchase in the past versus today. Figure 13 explores the relationship between MSW generated and real PCEsince 1960.Figure 13 is an indexed graph showing the relative changes in real PCE, MSW generated and MSW generatedper capita over time. It is indexed to allow all three of these metrics to be shown on the same graph and tocompare their relative rates of change since 1960. The indexed value indicates the change in the value of thedata since 1960. For example, if for a given year the value were three, then the data value for that year wouldbe three times the 1960 value. In this case, if the 1960 value were 200, then the resulting year’s value would be600. The 2015 MSW per capita generation indexed value is 1.7, which means MSW per capita generation hasincreased by 70 percent since 1960.Figure 13 shows that real PCE has increased at a faster rate than MSW generation, and the disparity hasbecome even more distinct since the mid-1990s. This metric indicates the amount of MSW generated per dollarspent is falling. In other words, the U.S. economy has been able to enjoy dramatic increases in householdspending on consumer goods and services without the societal impact of similarly increasing MSW generationrates. This figure also shows that the MSW generated per capita leveled off in the early-to-mid 2000s.Figure 13. Indexed MSW Generated and Real PCE over Time (1960-2015)17
MSW MethodologyThe data summarized in this fact sheet characterizes the MSW stream as a whole by using a materials flowmethodology that relies on a mass balance approach. EPA recognizes that there are several approaches tomeasuring material flows, such as by volume. To be consistent, EPA reports the quantities of materials in tonsin the current fact sheet but will continue to explore options for alternative measurement quantifications todescribe materials management in the United States.EPA has consistently used materials flow analysis to allow for the comparison of data over the last threedecades. EPA recognizes that this methodology differs from other methodologies that also estimate thegeneration of MSW and other waste data. EPA will continue to work with stakeholders to identify methodologiesand additional publicly available data to improve our national understanding of materials flow in the UnitedStates.Using data gathered from industry associations, businesses and government sources, such as the U.S.Department of Commerce and the U.S. Census Bureau, we estimate the weight in tons of all MSW materialsand products generated, recycled, composted, combusted with energy recovery and landfilled. Other sources ofdata, such as waste characterizations and research reports performed by governments, industry or the press,supplement these data.Construction and Demolition (C&D) DebrisGeneration ResultsC&D debris is a type of waste that is not included in MSW. Materials included in C&D debris are steel, woodproducts, drywall and plaster, brick and clay tile, asphalt shingles, concrete and asphalt concrete. Thesematerials are used in buildings, roads and bridges and other structures. The generation estimate representsC&D debris amounts from construction, renovation and demolition activities for buildings, roads and bridges andother structures.In 2015, 548 million tons of C&D debris were generated. Figure 14 shows the 2015 generation composition forC&D debris. C&D concrete was the largest portion at 70 percent, followed by asphalt concrete at 15 percent.C&D wood products made up 7 percent, and the other products accounted for 8 percent combined. The 2015generation estimates are presented in more detail in Table 5. As shown in Figure 15, demolition representedover 90 percent of total C&D debris generation. Construction, on the other hand, represented under 10 percent.18
Figure 14. C&D Generation Composition by Material (before processing), 2015548 Million TonsTable 5. C&D Debris Generation by Material and Activity, 2015 (in millions of tons)Waste DuringConstructionDemolitionDebrisTotalC&D Debris23.1358.7381.82.836.138.9Drywall and Plasters2.510.513.0Steel20.04.54.5Brick and Clay Tile0.311.912.2Asphalt Shingles0.912.613.5Asphalt Concrete0.083.983.929.6518.2547.8ConcreteWood ProductsTotal121Wood consumption in buildings also includes some lumber consumed for the construction of otherstructures. Data were not available to allocate lumber consumption for non-residential and unspecifieduses between buildings and other structures except for railroad ties. Since non-residential buildings suchas barns, warehouses and small commercial buildings are assumed to consume a greater amount oflumber than other structures, the amount of lumber for construction remaining after the amount forrailroad ties is split out is included in the buildings source category.Steel consumption in buildings also includes steel consumed for the construction of roads and bridges.Data were not available to allocate steel consumption across different sources, but buildings areassumed to consume the largest portion of steel for construction.19
Figure 15. Contribution of Construction and Demolition Phases to Total 2015 C&D Debris GenerationTable 6 displays the amount of C&D debris generation from buildings, roads and bridges and other structuresfor each material. The “other structures” category includes C&D debris generation estimates fromcommunication, power, transportation, sewer and waste disposal, water supply, conservation and developmentand the manufacturing infrastructure. In 2015, roads and bridges contributed significantly more to C&D debrisgeneration than buildings and other structures, and concrete made up the largest share of C&D debrisgeneration for all three categories.20
Table 6. C&D Debris Generation by Source, 2015 (in millions of tons)BuildingsRoads andBridgesOther88.4158.4135.037.6-1.4Drywall and Plasters13.0--Steel24.5--Brick and Clay Tile12.1--Asphalt Shingles13.5--Asphalt Concrete-83.9-169.1242.3136.4ConcreteWood ProductsTotal1Wood consumption in buildings also includes some lumber consumed for the construction of otherstructures. Data were not available to allocate lumber consumption for non-residential andunspecified uses between buildings and other structures except for railroad ties. Since non-residentialbuildings such as barns, warehouses and small commercial buildings are assumed to consume agreater amount of lumber than other structures, the amount of lumber for construction remainingafter the amount for railroad ties is split out is included in the buildings source category.2Steel consumption in buildings also includes steel consumed for the construction of roa
This report analyzes MSW trends in generation and management, materials and products, and economic indicators affecting MSW. It also includes a section on the generation of construction and demolition (C&D) debris, which is not a part of MSW, but comprises a significant portion of the non-hazardous solid waste stream. Figure 1.