Transcription
REAL ASSETSReal estate and infrastructure:The same, but differentAXA IM – Real Assets, Research & StrategyMarch 2017For use of recipient only - Strictly private and confidentialnot for onward distribution. For institutional investors only
Focus Drivers of real real estate performance Governments and the private sector as drivers of infrastructure delivery Infrastructure sector activity: cyclical and secular shifts Market activity Summary1
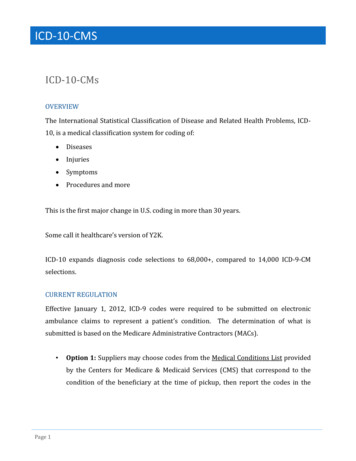
What drives real estate returns?U.S: GDP Growth vs Real EstateU.S. GDP (% YoY)Europe: GDP Growth vs Real EstateIPD U.S. Annual All Property Total Returns (% YoY)EU 28 GDP (% YoY)Real Estate ReturnGDP8%36%IPD Pan European Annual All Property Total Returns (% YoY)Real Estate ReturnGDP5%15%EU 28 GDPU.S. GDP5%U.S. Real EstateReturns3%0%-3%24%3%10%12%0%5%0%-3%-12%-5%GDP vs Real EstateCorrelation (2Qtr lag): 0.9-5%-24%1996 1997 1999 2001 2003 2005 2007 2009 2011 2013 2015Source: Macrobond, MSCI (data as at 19 January 2017)European RealEstate Returns0%-5%GDP vs Real EstateCorrelation (1Qtr lag): 0.9-8%-10%1996 1997 1999 2001 2003 2005 2007 2009 2011 2013 2015Source: Macrobond, MSCI (data as at 19 January 2017)Real estate returns largely driven by economic growth2
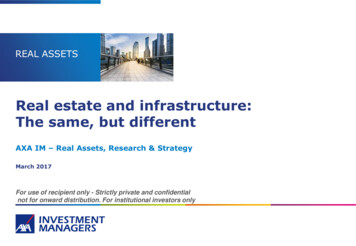
Relationship between economy and real estate extends to occupierfundamentalsU.S: Tenant Demand Linked to Labour MarketEurope: Tenant Demand Linked to Labour MarketEU 28 UnemploymentUnited States UnemploymentUnemploymentUS Vacancy RateVacancy Rate11%19%UnemploymentEurope Office Vacancy RateVacancy Rate12%12%U.S. UnemploymentEU 28 Unemployment9%17%10%7%10%15%U.S. OfficeVacancy RateEurope OfficeVacancy Rate8%5%8%13%3%200411%200620082010Source: Macrobond, CBRE (data as at 19 January ource: Macrobond, CBRE (data as at 19 January 2017)Note: U.S. office vacancies include the entire metro area, whereas European office vacancies only include the real estate market area, as defined by CBRE. As a result the U.S. vacancy rate tends tobe systematically higher than the European dataOffice markets are heavily reliant on labour market trends3
Urbanisation leads to a focus on global cities, which typicallyoutperformed regions over the last cycleMajor cities outperformed national market(Office 2007-2015, Cumulative Value Change)Major cities outperformed U.S. excluding Top 25(Office 2007-2015, Cumulative Value Change)Performance relative to U.S. exc. Top 25 marketsNew YorkLondon vs43%66%Amsterdam vsSan Francisco23%39%Paris vsWashington, DC33%BostonHamburg vs10%Stockholm vs9%Madrid vs8%14%Milan vs-3%-4%Berlin vs8%Frankfurt vs0%18%22%Los AngelesChicagoMunich vs31%Seattle20%10%20%30%40%50%Source: CoStar, AXA IM – Real Assets (data as at January 2017)Note: “Regions” and “National Market” exclude the comparison city, i.e. London vs UK excluding London.U.S. cities are compared to the U.S. aggregate excluding the Top 25 markets: the cities shown above plus,Houston, Dallas FW, Philadelphia, San Jose, Orange County, Atlanta, San Diego, Miami, Phoenix, East Bay,Denver, Northern New Jersey, Austin, Minneapolis, Baltimore, Sacramento, Long Island, Portland OR-9%-20%0%20%40%60%80%Source: MSCI, AXA IM – Real Assets (data as at April 2016)4
Continual investment required in real estate and infrastructure stockAgeing stock in the main office citiesLast 5 yrs6-10 yrs11-20 yrsInfrastructure in Europe good quality, but othercountries have overtakenMore than 20 yrs% of stock100Rank/138090Hong Kong80101203040Best qualityinfrastructureSingapore e720Germany810Source: PMA, AXA IM - Real Assets, data as at Autumn 2016NB: CEE is Budapest, Prague, WarsawCEELondon: ndon West oorerqualityinfrastructure42Source: World Economic Forum Global Competitiveness Report 2016-17, AXA IM – RealAssets, data as at September 2016Without ongoing investment or asset renewal, quality and effectiveness likely to suffer5
Development can threaten real estate rental growth, but new supplycurrently appears in check in most locationsLondon City Supply PipelineRelative Office New Supply PipelineCompletionsIndex150New LetNew Unlet22BRefurbRequires Pre-Letm sq/ft5ParisParisLondon10050MunichLong-Term 21BarcelonaSource: PMA, AXA IM – Real Assets, data as at Oct 2016Note: 100 1991-2016 1020102018 - 20192009201720080Source: CBRE, AXA IM – Real Assets, data as at February 2017Much more difficult (but not impossible) to over-supply infrastructure assets6
Significant increase in infrastructure investment needed: Privatesector has an important role to playInfrastructure investment has beenfalling in many ‘developed’ countriesUSD57 trillion of infrastructure investmentrequired out to 2030RAILUSD4tnROADSTELECOM Shortfall increases significantly ifinvestment to meet the UNSustainable Development Goalsis 2tnWATER Current rate of global investmentresults in an annual shortfall ofUSD350bn p.a Developed economies account for40% of the annual USD3.3tninvestment requirementUSD12tnPOWERSource: McKinsey & Co, Global Insight, AXA IM – Real Assets, data as at June 2016Data at 2015 pricesIncrease in global infrastructure spending required to meet future needs7
Water: abundant source but limited availability – demand tied toindustrial growth in Western economiesIndustrial demand for water in US and Europegenerally outstrips other useWater resources: stable and abundant butrelatively inaccessible and under pressure%100Fresh water 3%Surface water /other0.6%Streams 98.7%Salt water97%3082505540Ice dAfricaAsia191516USEurope0Total waterFresh waterSource: PwC, AXA IM – Real Assets, 2012 data as at October 2016Surface waterOceaniaSource: UN Food & Agriculture Organisation, AXA IM – Real Assets, data as at Oct-2016Across US and Europe, industrial demand links water use to GDP growth8
Transport: networks must evolve along with shifts in demandVehicle fleet in developed countries has seenlow or no growth - Asia Pacific the source ofglobal demandInternational Arrivals Into AustraliaNew ZealandChinaUKU.S.billion cars1.0Monthly Arrivals120,000EuropeNorth AmericaSouth AmericaAsia PacificMiddle EastAfricaChina becoming majortourism source100,0000.880,000New 19962001Source: Australian Bureau of Statistics (data as at October 2016)2006201120162005 2006 2007 2008 2009 2010 2011 2012 2013 2014Source: International Organisation of Motor Vehicle Manufacturers, AXA IM – RealAssets, 2014 data as at October 2016New technologies could change the face of transport - investment needs to keep pace9
Digital infrastructure: data centre and fibre network investmentrequired regardless of wider economic cycle2015 – 2020F: DC traffic growth 27% p.a.Video the biggest and fastest growing areaZB %6.54.743.1220%3.42.61.801.00%2010 2011 2012 2013 2014 2015 2016F2017F2018F2019F2020FSource: Cisco Global Cloud Index, AXA IM – Real Assets, data and forecasts as atJanuary 2017File sharingWeb / dataInternet videoSource: Cisco, AXA IM – Real Assets, data and forecasts as at January 2017High-definition video likely to drive future growth in data consumptionImportant Notice: The information has been established on the basis of data, projections, forecasts, anticipations and hypotheses which are subjective. Thisanalysis and conclusions are the expression of an opinion, based on available data at a specific date. Due to the subjective aspect of these analyses, theeffective evolution of the economic variables and values of the financial markets could be significantly different from the projections, forecast, anticipationsand hypotheses which are communicated in this overview. For illustrative purposes only. There can be no guarantee that any investment strategy presented 10will be implemented or ultimately be successful.
Driverless cars: the futureDriverless car data vs human created dataIn 2020, the average driverless car may process 4,000GB of data per day,while the average internet user is expected to process 1.5GB*Data created by driverless carsglobally could reach 2ZB/day –almost equal to the totalamount of data centre trafficin the whole of 2012 Assumes driverless reaches50% of the world’s 1bn totalfleet – possibly achieved in25 years** Tesla: cars using Autopilotmode have travelled 222mmiles***1 driverless car 2,666 internet users* Source: Intel, AXA IM – Real Assets, data as at November 2016Images: Waymo and Bigstock Photo, as at February 2017, for illustrative purposes only Google: self-driving car, 2mmiles travelled (13 minoraccidents – none the fault ofthe cars***)** Based upon IHS and McKinsey forecasts as at 2016*** Waymo data as at January 2017Data generated by driverless cars could dwarf that from other sourcesPlease refer to the important notice on slide10The above list is illustrative, indicative only and is neither detailed nor exhaustive11
Energy generation composition is evolving fast, particularly inEurope, as economies decarboniseEuropean capacity 2016: 918GWEuropean capacity 2005: 676GWOther4%Solar PV0.3%Wind6%LargeHydro18%Natural Gas20%Other4%Wind17%LargeHydro15%Fuel Oil3%Solar PV11%Fuel Oil8%Nuclear13%Nuclear19%Coal25%Source: WindEurope, AXA IM – Real Assets, data as at February 2017Natural Gas20%Coal17%Source: WindEurope, AXA IM – Real Assets, data as at February 201712
Pressure on government finances a risk for infrastructure: privatesector playing its part but more to do Government finances – debt levels and focuson austerityMore capital allocated to infrastructure: fundsizes are growingEURbn50 Shifts in priorities – lack of appetite forsubsidies, switch back towards fossil fuelsCapital raisedAverage fund size (RHS)EURbn4.5403.0 Financing costs, given the level of debt usedto fund projects3020 Cyclicality – regulated industries subject toshort-term cycles see investment (and jobs)peak and trough1.5100 Inability or unwillingness to price constructionrisk201420152016YTD 2017Source: InfraDeals, AXA IM – Real Assets, data as at March 201713
Real estate and infrastructure transactions have followed a similarpath post the GFCGlobal infra transactions followed that for real estate postGFC: market size is smallerEURbnReal EstateEURbnInfrastructure (RHS)1,000Real estate and infrastructuremarkets staged a sharp increase intransactions post the GFC4008003006002004001002000 The US accounts for the largestshare of real estate transactions(2009: 24%, 2016: 51%) Europe has seen its share ofinfrastructure transactions fall(2009: 65%, 2016: 35%) Asia has experienced the largestincrease (2009: 12%, 2016: e: InfraDeals, RCA, AXA IM – Real Assets, as at March 2017Europe has seen both its share of real estate and infrastructure transactions fall14
Infrastructure investment opportunities are as diverse as thoseoffered by real estateExampleRenewables Debt,Airport DebtReturns: 2-6%ExampleTelecoms Infrastructure,Airports and SeaportsReturns: 14-20%Low Risk/ReturnHigh Risk/ReturnInfrastructureDebtReal EstateDebtBrownfieldInfrastructureCore RealEstateLow Risk/ReturnValue-AddReal EstateGreenfieldInfrastructureCapital is waitingthese opportunities:for YTD capital raised byunlisted infrastructurefunds is already more thanhalf that for than whole of2016 (EUR24bn vsEUR44bn)Source: InfraDeals (as at March 2017)Opp. RealEstateHigh Risk/ReturnSource: AXA IM – Real AssetsFor illustrative purposes onlyInfrastructure has more to offer than just long-term income15
Summary:Real estate and infrastructure share many common drivers – primarily a link, direct or indirect, toGDP growth but this is not true for all sectorsReal estate and infrastructure benefit from major shifts in underlying demand, be that a move toonline retail boosting logistics demand or shifting energy generation compositionInfrastructure is a diverse sector, offering investors more than just long-term incomeBoth asset classes are experiencing rising demand from global investors, as they diversify and seekgreater returns, many aiming to match income to future liabilitiesInfrastructure remains a market dominated by government policies, backed by private sector capitaland this is unlikely to change in the future16
DisclaimerPart 1/3This material (the “Material”) is solely for the use of the recipient who has received it directly from AXA Investment Managers – RealAssets or any of its affiliates (“AXA IM – Real Assets”) for information and discussion purposes only. It is to be treated strictlyconfidential. This Material and any information contained herein should not be copied or circulated, in whole or in part, without the priorwritten consent of AXA IM – Real Assets. This Material does not constitute an offer or solicitation, nor is it the basis for any contract forthe purchase or sale of any investment, security or product. It is not for use by retail customers under any circumstances. AXA IM –Real Assets disclaims any and all liability relating to a decision based on or for reliance on this Material.This Material has not been reviewed, approved or disapproved by any regulatory authority in any jurisdiction. The distribution of thisMaterial in certain jurisdictions may be restricted by law. The recipient represents that it is able to receive this Material withoutcontravention of any applicable legal or regulatory restrictions in the jurisdiction in which it resides or conducts business. AXA IM –Real Assets does not accept any responsibility for ensuring that a recipient complies with applicable laws and regulations. The Materialdoes not constitute, and may not be used for or in connection with, an offer or solicitation by anyone in any jurisdiction in which suchoffer or solicitation is not authorized or to any person to whom it is unlawful to make such offer or solicitation.Due to its simplification, this Material is partial and thus the information can be subjective. The information set forth herein does notpurport to be complete and is subject to change without notice. This Material does not take into account the recipient’s objectives,financial situation or needs. This Material shall not be deemed to constitute investment advice and/or tax, accounting, regulatory, legalor other advice and it should not be relied upon as the basis for a decision to enter into a transaction or as the basis for an investmentdecision. The recipient is urged to consult with its own advisers with respect to legal, tax, regulatory, financial, accounting and othermatters concerning any investment decision.Analysis and conclusions express the views of AXA IM – Real Assets and may be subject to change without notice. All information,analysis and conclusions herein present AXA IM – Real Assets’ current knowledge and market estimation at the time of its production.Nevertheless it can come to unintended erroneous statements or presentations and the information may change at any time withoutprevious announcements and/or notices to the recipient of this Material. Thus, a liability or guarantee for the up-to-datedness,correctness and completeness of the allocated information, estimation and opinion cannot be assumed. Information contained hereinmay vary from previous or future published versions of this Material. Information regarding the background and experience ofpersonnel of AXA IM – Real Assets are provided for information purposes only. Such persons may not necessarily continue to beemployed by AXA IM – Real Assets and may not perform or continue to perform services for AXA IM – Real Assets. The reference toleague tables and awards are not an indicator of the futures places in league tables or awards. Unless otherwise noted, informationprovided herein is current as of the date of this Material.17
DisclaimerPart 2/3The data including but not limited to scenarios and investment guidelines set forth in this Material are presented for illustrativepurposes only and such data could vary significantly from the final investment policy and/or actual results. Where past performance,past experience and track record information is provided, this is not necessarily representative of future results: performance is notconstant over time and the value of investments may fall as well as rise. No representation is made that any results or other figuresindicated in this Material will be achieved and that investments will achieve comparable results that targeted returns. Propertyinvestments can be illiquid and there is no guarantee that properties can be sold at valuation levels. Investment may be subject togearing and should be considered higher risk than a similar ungeared investment. Investment returns may be subject to foreigncurrency exchange risks. Actual results on unrealized investments described herein will depend on, among other factors, futureoperating results, the value of the assets and market conditions at the time of disposition, legal and contractual restrictions on transferthat may limit the liquidity, any related transactions costs and the timing and manner of sale, all of which may differ materially from theassumptions and circumstances on which the valuations used in the prior performance data contained herein are based.Some statements and analysis in this Material and some examples provided are based upon or derived from the hypotheticalperformance of models developed by AXA IM – Real Assets and/or third parties. In particular, in connection with certain investmentsfor which no external pricing information is available, AXA IM – Real Assets will rely on internal pricing models, using certain modelingand data assumptions. Such valuations may vary from valuations performed by other parties for similar types of investments. Modelsare inherently imperfect and there is no assurance that any returns or other figures indicated in this Material and derived from suchmodels will be achieved. AXA IM – Real Assets expressly disclaims any responsibility for (i) the accuracy of the models or estimatesused in deriving the analyses, (ii) any errors or omissions in computing or disseminating the analyses or (iii) any uses to which theanalyses are put.Any hypothetical illustrations, forecasts and estimates contained in this Material are forward looking statements and are based uponassumptions. Hypothetical illustrations are necessarily speculative in nature and it can be expected that some or all of the assumptionsunderlying the hypothetical illustrations will not materialise or will vary significantly from actual results. Accordingly, the hypotheticalillustrations are only an estimate and AXA IM – Real Assets assumes no duty to update any forward looking statement. This Materialmay also contain historical market data; however, historical market trends are not reliable indicators of future market behaviour.18
DisclaimerPart 3/3Although some information has been provided by AXA IM – Real Assets, the information is based on information furnished by thirdparties the accuracy and completeness of which has not been verified by AXA IM – Real Assets. All information and data in thisMaterial is established on the accounting information, on market data basis or has been sourced from a number of recognized industryproviders. All accounting information, except otherwise specified, is un-audited. While such sources are believed to be reliable andaccurate, none of AXA IM – Real Assets or its respective affiliates, directors, officers, employees, partners, members or shareholdersassumes any responsibility for the accuracy or completeness of such information. Details of these sources are available upon request.Any pictures, plans, drawings, diagrams or schedules set forth in this Material are provided for information purposes only.AXA IM – Real Assets makes no representation or warranty (express or implied) of any nature nor is responsible or liable in any waywith respect to the truthfulness, completeness or accuracy of any information, projection, representation or warranty (express orimplied) in, or omission from, this information. 2017 AXA Real Estate Investment Managers and its Affiliated Companies. All rights reserved.19
25 JANUARY 20171LGIM REAL ASSETSPerformance Measurement of Private InfrastructureDeclan O’Brien, Infrastructure Strategist
2Agenda Mapping the infrastructure universe Where are we now? – property vs. infrastructure benchmarking Overview of property benchmarking The infrastructure journey What tools are investors using to benchmark infrastructure Challenges/ obstacles to infrastructure benchmarking What next?
3Mapping the infrastructure universeInfra EquityInfra DebtSource: CFA, LGIM
5 OCTOBER 20164LGIM REAL ASSETSWhere Are We Now?INFRASTRUCTURE10 YEARS AGO!INFRASTRUCTURENOWPROPERTY
5Overview of Property Benchmarking Investor-led initiative in UK; benchmarking now enshrinedWell-established industry sector and sub-sector classificationsLarge sample sizes across most sub-sectors allows for “accurate” benchmarkingPerformance vs. peer group linked to remunerationPerformance typically based on total return, i.e. income return capital returnCapital return validated based on quarterly valuation reportsGlobal Property Class SectorsStandard Industry therStandard Retail - South EastShopping CentreOffice - CityOffice - Rest of South EastIndustrial - South EastGranular Sub-sectors31Standard Retail - Rest of UKRetail WarehouseOffice - West End & Mid TownOffice - Rest of UKIndustrial - Rest of UKSource: IPD
6The Infrastructure Journey Another equity or riskier bond-like return?Survey results describinginfrastructure benchmarking options AIMCo (2012) described infra benchmarking as a“hodgepodge” of approaches First indices suffered from generic aggregation of data Useful for asset class education but unsuitable as a measureof manager/fund performance Most recent initiatives are more sophisticated and providebetter data points, but further work needed to match propertySource: EDHECinfra/GIH Survey (Blanc-Brudeet al., 2016)
7What Tools Are Investors Using to Benchmark Infrastructure?Preqin: Global Infra Risk/Return by VintageEDHEC/ LTIIA: Contracted Infrastructure FundMSCI Global Infrastructure IndexMarkit Iboxx Infrastructure Debt Indices (with DB)Markit Iboxx GBP Infrastructure IndexMarkit Iboxx EUR Infrastructure IndexMarkit Iboxx USD Infrastructure IndexMarkit iBoxx USD High Yield Infrastructure Index
8Major Improvements Driven by Human Intervention For Now
9Challenges/ Obstacles to Infrastructure Benchmarking Immature market with small sample sizes- Perhaps, no benchmark is better than a bad benchmark Data collection- Heterogeneous asset class with wide scope of risk- Sectors and risk profile need standardised reporting Asset valuations- Few secondary data trading points/ full-cycle assets- EDHEC survey found that only half of investors trust valuations Motivation- Property investor led; will investors demand the same from infrastructure?
10What Next? Immature market with small sample sizes Infra AUM annual growth of 35% since 2011 Data collection Already big steps in this area, but furtherimprovements needed Asset valuations No obvious path to overcoming valuations Benchmarking should be easy for concession-based infrastructure, i.e. more focusedon income, less need for valuations Total return over fund may be most relevant measure for rest of industrySource: Preqin Motivation Lack of benchmarking does not seem to be impacting fundraising However, it will become more important for core infrastructure strategies as IRRs continue to fall The industry needs to work together to showcase asset class to increase allocations to sector
Regulating Infrastructurelandmarks, trends, challengesEugene ZhuchekoExecutive Director, LTIIAMarch 24, 2017
Why regulation?Essential Services for CommunityLarge scale operationsFinancial Risk ManagementL T I I A / March 20172
Sector RegulationEnsure that private investor earns areasonable returnSource: OfWatL T I I A / March 20173
Asset Class RegulationSolvency II: stipulates risk charge for maintaining reserves byinsurers and pension plansSource: DeloitteL T I I A / March 20174
Policy IncentivesSubsidies for renewablesCrowding in private capitalTIFIA program (US)Trump’s plan on tax creditsJuncker plan (Europe)L T I I A / March 20175
Performance data is key to enablingfair regulationL T I I A / March 20176
STRICTLY PRIVATE CONFIDENTIALJ.P. Morgan Asset Management – Global Real Assets OmniReal Assets Portfolio Construction 24th March 2017Finding Synergies between Property and Infrastructure Research:Society of Property Researchers and the Long-Term Infrastructure Investors AssociationBernie McNamara, Head of Global Real Assets Investment SolutionsPulkit Sharma, CFA, CAIA, Head of Global Portfolio Construction for Real AssetsFOR INSTITUTIONAL/WHOLESALE/PROFESSIONAL CLIENTS AND QUALIFIED INVESTORS ONLY –NOT FOR RETAIL USE OR DISTRIBUTION
STRICTLY PRIVATE CONFIDENTIALGlobal Real Assets Omni Investment SolutionsBringing the pieces of the real assets puzzle togetherGlobal Real Estate Part of 95 Billion J.P. Morgan GlobalReal Assets business Platform for working with investors to builddiversified portfolios across real estateand other real assets strategies Targeted to investors’ individual needsand risk/return objectives Collaborative research and data-sharingthrough cross-firm Omni QuantitativeGroupGlobal TransportGlobal InfrastructureOther Real AssetsGoal is to bring more science and less art to the real asset portfolio construction process1 FOR INSTITUTIONAL/WHOLESALE/PROFESSIONAL CLIENTS AND QUALIFIED INVESTORS ONLY– NOT FOR RETAIL USE OR DISTRIBUTION
0903c02a811881feSTRICTLY PRIVATE CONFIDENTIALMore science, less art: enhanced data, tools and transparency for portfolio construction Omni Returns DatabaseOmni Portfolio Construction Frameworks– US Core/Core RE – NCREIF ODCE– US VA/Opp RE – NCREIF/Cambridge– US Real Estate Mezzanine – JPMAM-GRA– European Core RE – IPD/CBRE/JPMAM-GRA– European Non-Core RE – IPD/CBRE/JPMAM-GRA– Asia Core Real Estate – JLL/IPD/JPMAM-GRA– Asia Non-Core Real Estate – JLL/IPD/JPMAM-GRA– REITs – FTSE EPRA/NAREIT– OECD Infrastructure – JPMAM-GRA– Asian Infrastructure – UBS/JPMAM-GRA– Global Transport – Clarkson Research/JPMAM-GRA– Timber and Farmland – NCREIF– Other real assetsCore FoundationCore Complements18.0%Global Diversifiers16.0%14.0%Core Complements12.0%10.0%Core Foundation8.0%60/406.0%0.0%– 20 years of consistent data for 200 time series acrossstyles, sectors and regions5.0%10.0%Current Allocations15.0%Mean Variance10%46%50%4%38%38%6%8%Omni Allocation Modeling Tools– Inflation sensitivity, non-normal, downside risk models12%24%23%15%50%51%– Mean variance, risk parity, passive market frameworks30.0%Inflation Sensitivity8%11%12%25.0%Non-Normality4%1%3%16%– Proprietary, customized tools for real asset allocations20.0%Risk Parity10%5% Global Diversif iers20.0%25%26%4%Public EquityFixed IncomeInflation – Linked BondsCommoditiesREITsPrivate EquityHedge FundsPrivate Real AssetsExpected Return7.4%8.0%5.7%8.0%8.0%Historical Volatility15.2%8.3%7.9%10.2%8.3%Equity Probability CPI38%27%37%31%27%EQUITIESREAL ASSETSFIXED INCOMEREAL ASSETSREAL ASSETSMax AllocationMajor ExclusionsKey ConsiderationsN/APE, HEDGE FUNDSN/AEQUITIES, HEDGE FUNDSPE, HEDGE FUNDSUNDERPERFORMANCEEQUITY RISKINVESTMENT CAPACITYUNDERPERFORMANCEINVESTMENT CAPACITYINVESTMENT CAPACITY– Country, currency, and other bespoke modelsNotes: RE Real Estate, NCREIF National Council of Real Estate investment Fiduciaries, ODCE Open End Diversified Core Equity, IPD Investment Property Databank, CBRE CB Richard Ellis, JLL Jones Lang LaSalle FTSE FinancialTimes Stock Exchange, EPRA European Public Real Estate Association, NAREIT National Association of Real Estate Investment Trusts, UBS Union Bank of Switzerland. For illustrative purposes only.2 FOR INSTITUTIONAL/WHOLESALE/PROFESSIONAL CLIENTS AND QUALIFIED INVESTORS ONLY– NOT FOR RETAIL USE OR DISTRIBUTION
STRICTLY PRIVATE CONFIDENTIALHistory lesson #1: determining the long-term strategic mix of core vs. non-core within realassetsFixed income and equities investment universe by style (core and non-core)Global Real Estate100%19%90%39%Percent Allocation (%)80%70%60%50%40%Treasurysand stmentGradeCorporate0%FixedIncome20 - 40%37%DiversifiedDeveloped MarketInternationalLarge CapU.S. LargeCap BlendU.S. LargeCap Value81%61%63%Passive Market(US FocusedPensions)Risk ParityAllocation?60 - 80%U.S.Large CapGrowthEquitiesSharpe MaximizingMean VarianceStrategicReal EstateAllocationVarious asset allocation frameworks point to acore real estate allocation in the range of 60-80%Sources: Morningstar, NCREIF, Kingsley Associates, and IREI. Notes: The passive market allocation is sourced from the 2015 Institutional Real Estate Trends Survey 2015 conducted by the Kingsley Associates and IREI – the survey tracks responses of 86institutional investors, of which 62 are U.S. tax-exempt institutions.The allocation represents the real estate passive market targets in private market core and non core real estate exclusive of foreign real estate and REITs. Data Source: NCREIF-ODCE, NCREIF-Townsend, JPMAM Global Real Assets Research. Note t
Office markets are heavily reliant on labour market trends EU 28 Unemployment Europe Office Vacancy Rate U.S. Office Vacancy Rate Note: U.S. office vacancies include the entire metro area, whereas European office vacancies only include the real estate market area, as defined by CBRE. As a result the U.S. vacancy rate tends to