Transcription
Application ReportSNLA098A – October 2007 – Revised April 2013AN-1728 IEEE 1588 Precision Time Protocol TimeSynchronization Performance.ABSTRACTThis application report presents specific time synchronization results from the precision PHYTER.Histograms and oscilloscope plots of these synchronization results are provided, showing the relationshipbetween the slave clock and the master clock.1234567ContentsIntroduction .Background .Testing Time Synchronization Theory .Software Reported Synchronization Test Results .4.1Software Reported Test Setup .4.2Software Reported Test Conditions .4.3Software Reported Test Results .Pulse Per Second Synchronization Test Results .5.1PPS Test Setup .5.2PPS Test Conditions .5.3PPS Test Results .Clock Synchronization Test Results .6.1Clock Test Setup .6.2Clock Test Conditions .6.3Clock Test Results .Summary .2233344556666778List of Figures1Implementation Choices to Achieve Better Time Synchronization . 22The Precision PHYTER IEEE 1588 Time Synchronization Advantage . 33Software Synchronization Test Setup . 44Synchronized to Master Using IEEE 1588 – Software Test Results . 55Pulse Per Second Output Synchronization Test Setup . 56Synchronized to Master Using IEEE 1588 – PPS Jitter Histogram . 67Clock Output Synchronization Test Setup . 78Synchronized to Master Using IEEE 1588 - Clock Output Jitter Histogram . 89Synchronized to Master Using IEEE 1588 - Clock Output Signals . 8List of Tables1Test Conditions . 42Synchronized to Master using IEEE 1588 PTP . 43Test Conditions . 64Synchronized to Master Using IEEE 1588 PTP5Test Conditions . 76Synchronized to Master using IEEE 1588 PTP . 7.6All trademarks are the property of their respective owners.SNLA098A – October 2007 – Revised April 2013Submit Documentation FeedbackAN-1728 IEEE 1588 Precision Time Protocol Time SynchronizationPerformanceCopyright 2007–2013, Texas Instruments Incorporated1
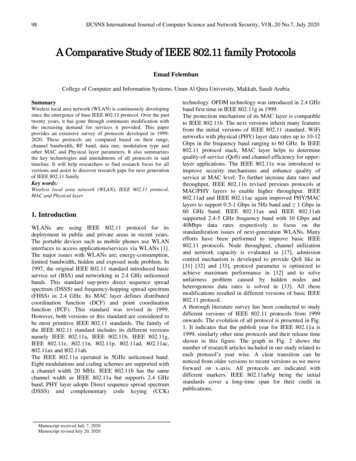
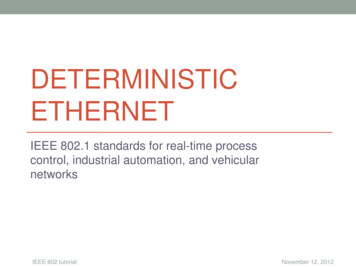
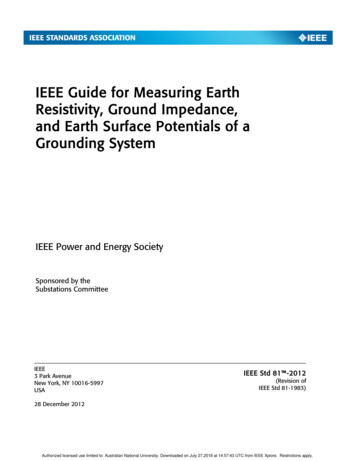
Introduction1www.ti.comIntroductionThe purpose of the IEEE 1588 Precision Time Protocol (PTP) is to synchronize the time between differentnodes on an Ethernet network. Many applications in factory automation, test and measurement, andtelecommunications require very close time synchronization. This requirement is often well beyond whatcan be provided by a standard software solution. The Precision PHYTER solution provides exceptionallytight time synchronization that meets these application needs and is easily added to existing products.This application report is applicable to the following product: DP83640.2BackgroundNetwork Time Protocol (NTP) has been the traditional way to synchronization time over Ethernetnetworks. NTP allows time synchronization up to 100 milliseconds. The IEEE 1588 PTP is required toachieve tighter synchronization. In software PTP applications, single link synchronization in the range of100 microseconds can be reached. As can be seen in Figure 1, hardware assistance is required toachieve time synchronization in the nanosecond region.Standard SoftwareEthernet IEEE 1588NTPHardware Assisted IEEE 15881588 PTP1588 PTPTCP/IP/UDPTCP/IP/UDPStandard MACStandard MACCustom FPGA or PControllerStandard PHY100 ms100 Ps - 10 PsHuman ControlPrecision PHYTER withH/W 1588 Timestamps Clock GPIOPHYTER100 ns - 50 nsProcess Control5 nsMotion ControlPrecision ControlFigure 1. Implementation Choices to Achieve Better Time SynchronizationEvery component that handles the PTP packets after they are received on the wire will increase thesynchronization error. Software adds the most error since both processor load and the delay associatedwith handling interrupts impact how quickly a synchronization request is processed. Fortunately, onlycertain PTP actions are time critical. The most time critical PTP actions are recording timestamps of PTPpackets, adjusting and maintaining the synchronized local clock, and using synchronized I/Os. By placingthese components in the Ethernet PHY as shown in Figure 2, the DP83640 precision PHYTER accessesPTP packets as soon as they are available from the wire. Therefore, the precision PHYTER is the keycomponent for reaching time synchronization of less than 10 nanoseconds. As an additional benefit, thissolution can be added to an existing product design by simply replacing the Ethernet PHY and addingIEEE 1588 PTP software, avoiding the complications of moving to a new processor family or developingan ancillary FPGA.2AN-1728 IEEE 1588 Precision Time Protocol Time SynchronizationPerformanceSNLA098A – October 2007 – Revised April 2013Submit Documentation FeedbackCopyright 2007–2013, Texas Instruments Incorporated
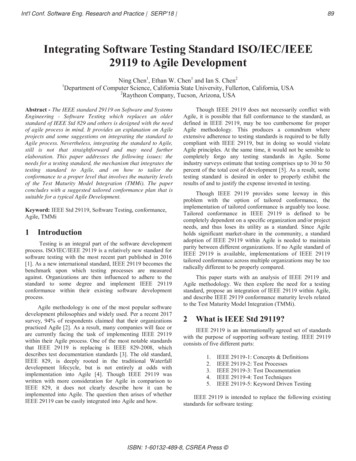
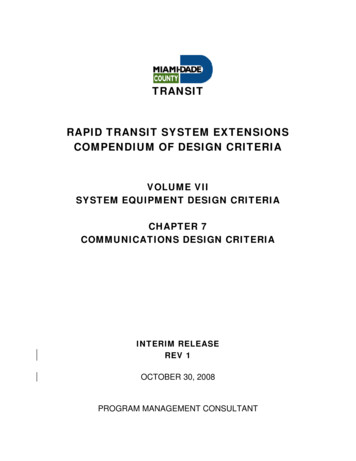
Testing Time Synchronization Theorywww.ti.comEthernet trollerHardwareMagneticsandRJ-45Figure 2. The Precision PHYTER IEEE 1588 Time Synchronization Advantage3Testing Time Synchronization TheoryIt is difficult to assess the level of time synchronization that a system is capable of achieving becausethere is more than one way to test the quality of the time synchronization. Since each approach providesdifferent information and has different considerations, this application report provides synchronization datataken under different test conditions. There are three approaches to testing time synchronization: softwaretesting, pulse per second signal comparison, and output clock comparison.Software testing relies on the results reported by the PTP stack to show the quality of the timesynchronization. This means that the software results are subject to the same limitations as the PTPalgorithm itself. The primary limitation of the PTP algorithm is that it cannot correct for differences in thelength of the transmit path and the receive path. Another consideration when analyzing software results isthat the reported error is always taken just before the time synchronization. Since the process is reportingan error that is essentially due to the drift between two clocks, the software error represents a worst casepicture of the average time synchronization.The most common way to analyze time synchronization comes from looking at the pulse per second(PPS) signal. Sending out a pulse at every second transition produces a PPS signal. For many oldersystems, the PPS signal is the only way to measure the success of time synchronization. The primarydisadvantage to this measurement is that this effectively samples the error every second. Since there isnot necessarily a correlation between the second transition and the clock synch update, it is difficult toachieve dependable results. Another issue with the PPS measurement is that the PPS signal is typicallygenerated from a digital output that will add additional error to the synchronization results. That additionalerror will only impact digital inputs and outputs, but not the synchronized clock itself and, thus, should notbe included in the synchronization measurement.The most accurate method to measure clock synchronization is set both the master and slave to generatea clock output at a known frequency and then compare those two clock signals. This provides the error atmany more times a second, providing a more accurate view of the time synchronization. As an additionalbenefit, the clock output can be handled through an analog output that will not add additionalsynchronization error.4Software Reported Synchronization Test Results4.1Software Reported Test SetupThe software test setup relies on an FPGA card that emulates an Ethernet MAC to allow the controlsoftware to interface with the Ethernet PHY hardware. The software connects to the MAC emulatorthrough a USB connection. The PTP packets and PHY controls are created by the MACs and sent to theEthernet PHYs. The software portion of the PTP protocol is handled by the computer while the hardwareportion of the PTP protocol remains in the DP83640 on the PHY board. This setup is illustrated inFigure 3.SNLA098A – October 2007 – Revised April 2013Submit Documentation FeedbackAN-1728 IEEE 1588 Precision Time Protocol Time SynchronizationPerformanceCopyright 2007–2013, Texas Instruments Incorporated3
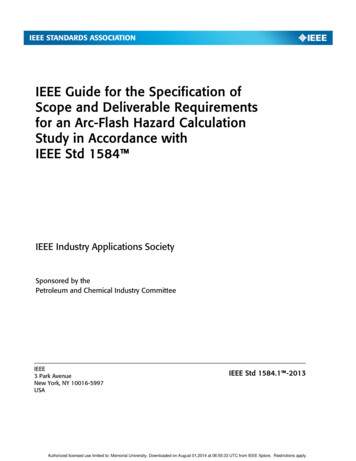
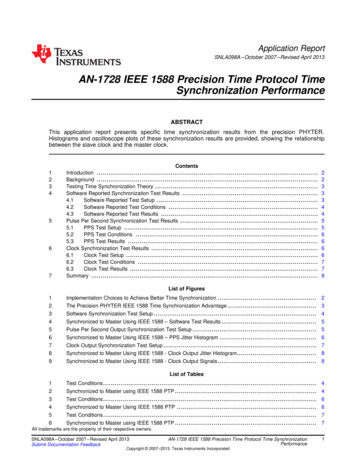
Software Reported Synchronization Test Resultswww.ti.comFigure 3. Software Synchronization Test Setup4.2Software Reported Test ConditionsTable 1 summarizes the conditions for the software test setup.Table 1. Test Conditions4.3Operating Voltage3.3 VTemperature25 CReference Frequency SourceOn-board 25 MHz crystalIEEE 1588 PTP Synchronization Interval1 secondSoftware Reported Test ResultsTable 2. Synchronized to Master using IEEE 1588 PTPSoftware Reported TestResultsMeanStandard DeviationNo of Samples1.59 ns6.5 ns500 samplesFigure 4 represents a typical plot of the clock synchronization error, as reported by the software, betweenthe master and slave nodes when they are time synchronized using the IEEE 1588 PTP protocol. Thecenter line shows the average offset between the two clocks. The top and bottom lines graph the standarddeviation around that average offset. The varying line shows the instantaneous offset that is calculatedbefore each synchronization adjustment to the local slave clock. In Figure 4, the effects of the PTPsynchronization algorithm can easily be seen in the stability and accuracy of the average offset and thetracking of the instantaneous offset per synchronization cycle.4AN-1728 IEEE 1588 Precision Time Protocol Time SynchronizationPerformanceSNLA098A – October 2007 – Revised April 2013Submit Documentation FeedbackCopyright 2007–2013, Texas Instruments Incorporated
Pulse Per Second Synchronization Test Resultswww.ti.comFigure 4. Synchronized to Master Using IEEE 1588 – Software Test Results5Pulse Per Second Synchronization Test Results5.1PPS Test SetupTesting the PPS signal time synchronization was achieved by analyzing the PPS signals from both themaster and slave devices with a Tektronix TDS784C oscilloscope. The test setup is represented inFigure 5.MII InterfaceMasterSystemMasterDP83640DeviceMII InterfaceNetwork PSOutputHistogram EnabledOscilloscopeFigure 5. Pulse Per Second Output Synchronization Test SetupSNLA098A – October 2007 – Revised April 2013Submit Documentation FeedbackAN-1728 IEEE 1588 Precision Time Protocol Time SynchronizationPerformanceCopyright 2007–2013, Texas Instruments Incorporated5
Clock Synchronization Test Results5.2www.ti.comPPS Test ConditionsTable 3 summarizes the conditions for the PPS test setup.Table 3. Test Conditions5.3Operating Voltage3.3 VTemperature25 CReference Frequency SourceOn-board 25 MHz crystalIEEE 1588 PTP Synchronization Interval1 secondPPS Test ResultsTable 4. Synchronized to Master Using IEEE 1588 PTPPPS SynchronizationMeanStandard DeviationNo of Samples-869 ps7.87 ns1000 samplesFigure 6 represents a typical histogram plot of the PPS output signal comparison between the master andslave nodes when they are time synchronized using the IEEE 1588 PTP protocol. In Figure 6, the clock toclock synchronization is within a 7.9 nanosecond standard deviation and a mean difference of only –869picoseconds. This performance represents a significant advantage over other commercially available timesynchronization components.Figure 6. Synchronized to Master Using IEEE 1588 – PPS Jitter Histogram6Clock Synchronization Test Results6.1Clock Test SetupTesting the PPS signal time synchronization was achieved by analyzing the clock output signals from boththe master and slave devices with a Tektronix TDS784C oscilloscope. Both devices were set to output a10 MHz clock signal for testing purposes. The test setup is represented in Figure 7.6AN-1728 IEEE 1588 Precision Time Protocol Time SynchronizationPerformanceSNLA098A – October 2007 – Revised April 2013Submit Documentation FeedbackCopyright 2007–2013, Texas Instruments Incorporated
Clock Synchronization Test Resultswww.ti.comMII InterfaceMII InterfaceNetwork am EnabledOscilloscopeFigure 7. Clock Output Synchronization Test Setup6.2Clock Test ConditionsTable 5 summarizes the conditions for the clock synchronization test setup.Table 5. Test Conditions6.3Operating Voltage3.3 VTemperature25 CReference Frequency SourceOn-board 25 MHz crystalClock Output Frequency10 MHzIEEE 1588 PTP Synchronization Interval1 secondClock Test ResultsTable 6. Synchronized to Master using IEEE 1588 PTPPPS SynchronizationMean1-σ Standard DeviationNo of Samples-226 ps2.655 ns1100 samplesFigure 8 represents a typical histogram plot of the time difference between the clock output signals of themaster and slave nodes when they are time synchronized using the IEEE 1588 PTP protocol. In Figure 8,the clock to clock synchronization is within a 2.7 nanosecond standard deviation and a mean difference ofonly –226 picoseconds. This level of synchronization can easily support even very demandingapplications.SNLA098A – October 2007 – Revised April 2013Submit Documentation FeedbackAN-1728 IEEE 1588 Precision Time Protocol Time SynchronizationPerformanceCopyright 2007–2013, Texas Instruments Incorporated7
Summarywww.ti.comFigure 8. Synchronized to Master Using IEEE 1588 - Clock Output Jitter HistogramAnother way to see the relationship between the master and slave clock outputs is to look at the two clockoutputs over time. The following scope plot taken from the same test setup shows this relationship. Theoscilloscope is set to infinite persistence, showing the peak to peak jitter of the slave signal. The masterclock output is shown on the top and the slave clock output is shown on the bottom. As can be seen fromFigure 9, the two clocks are both phase and frequency aligned. The peak to peak synchronization jittercan be seen as the 11 ns delta measurement in the upper right hand corner. This scope capture showshow remarkably stable and time synchronized two clocks can be with IEEE 1588 PTP and the precisionPHYTER solution.Figure 9. Synchronized to Master Using IEEE 1588 - Clock Output Signals7SummaryThere are many applications for time synchronized Ethernet that require closer synchronization than whatcan be achieved with software only implementations of time synchronization protocols. NationalSemiconductor’s DP83640 precision PHYTER provides an easy to implement method for adding highprecision time synchronization to Ethernet applications. The provided test results clearly show that theprecision PHYTER solution provides very precise and accurate time synchronization of less than 108AN-1728 IEEE 1588 Precision Time Protocol Time SynchronizationPerformanceSNLA098A – October 2007 – Revised April 2013Submit Documentation FeedbackCopyright 2007–2013, Texas Instruments Incorporated
Summarywww.ti.comnanoseconds standard deviation over a single link. This precision allows a hardware developer to developa very capable, Ethernet-based solution for any application with strict time synchronization requirements.The results from software analysis, PPS signal analysis, and synchronized clock output analysis provide avery good representation of the capabilities of the DP83640 device to support application developmentand system design.SNLA098A – October 2007 – Revised April 2013Submit Documentation FeedbackAN-1728 IEEE 1588 Precision Time Protocol Time SynchronizationPerformanceCopyright 2007–2013, Texas Instruments Incorporated9
IMPORTANT NOTICETexas Instruments Incorporated and its subsidiaries (TI) reserve the right to make corrections, enhancements, improvements and otherchanges to its semiconductor products and services per JESD46, latest issue, and to discontinue any product or service per JESD48, latestissue. Buyers should obtain the latest relevant information before placing orders and should verify that such information is current andcomplete. All semiconductor products (also referred to herein as “components”) are sold subject to TI’s terms and conditions of salesupplied at the time of order acknowledgment.TI warrants performance of its components to the specifications applicable at the time of sale, in accordance with the warranty in TI’s termsand conditions of sale of semiconductor products. Testing and other quality control techniques are used to the extent TI deems necessaryto support this warranty. Except where mandated by applicable law, testing of all parameters of each component is not necessarilyperformed.TI assumes no liability for applications assistance or the design of Buyers’ products. Buyers are responsible for their products andapplications using TI components. To minimize the risks associated with Buyers’ products and applications, Buyers should provideadequate design and operating safeguards.TI does not warrant or represent that any license, either express or implied, is granted under any patent right, copyright, mask work right, orother intellectual property right relating to any combination, machine, or process in which TI components or services are used. Informationpublished by TI regarding third-party products or services does not constitute a license to use such products or services or a warranty orendorsement thereof. Use of such information may require a license from a third party under the patents or other intellectual property of thethird party, or a license from TI under the patents or other intellectual property of TI.Reproduction of significant portions of TI information in TI data books or data sheets is permissible only if reproduction is without alterationand is accompanied by all associated warranties, conditions, limitations, and notices. TI is not responsible or liable for such altereddocumentation. Information of third parties may be subject to additional restrictions.Resale of TI components or services with statements different from or beyond the parameters stated by TI for that component or servicevoids all express and any implied warranties for the associated TI component or service and is an unfair and deceptive business practice.TI is not responsible or liable for any such statements.Buyer acknowledges and agrees that it is solely responsible for compliance with all legal, regulatory and safety-related requirementsconcerning its products, and any use of TI components in its applications, notwithstanding any applications-related information or supportthat may be provided by TI. Buyer represents and agrees that it has all the necessary expertise to create and implement safeguards whichanticipate dangerous consequences of failures, monitor failures and their consequences, lessen the likelihood of failures that might causeharm and take appropriate remedial actions. Buyer will fully indemnify TI and its representatives against any damages arising out of the useof any TI components in safety-critical applications.In some cases, TI components may be promoted specifically to facilitate safety-related applications. With such components, TI’s goal is tohelp enable customers to design and create their own end-product solutions that meet applicable functional safety standards andrequirements. Nonetheless, such components are subject to these terms.No TI components are authorized for use in FDA Class III (or similar life-critical medical equipment) unless authorized officers of the partieshave executed a special agreement specifically governing such use.Only those TI components which TI has specifically designated as military grade or “enhanced plastic” are designed and intended for use inmilitary/aerospace applications or environments. Buyer acknowledges and agrees that any military or aerospace use of TI componentswhich have not been so designated is solely at the Buyer's risk, and that Buyer is solely responsible for compliance with all legal andregulatory requirements in connection with such use.TI has specifically designated certain components as meeting ISO/TS16949 requirements, mainly for automotive use. In any case of use ofnon-designated products, TI will not be responsible for any failure to meet dioAutomotive and fier.ti.comCommunications and Telecomwww.ti.com/communicationsData Convertersdataconverter.ti.comComputers and Peripheralswww.ti.com/computersDLP Productswww.dlp.comConsumer ergy and Lightingwww.ti.com/energyClocks and wer Mgmtpower.ti.comSpace, Avionics and ollersmicrocontroller.ti.comVideo and Imagingwww.ti.com/videoRFIDwww.ti-rfid.comOMAP Applications Processorswww.ti.com/omapTI E2E Communitye2e.ti.comWireless Connectivitywww.ti.com/wirelessconnectivityMailing Address: Texas Instruments, Post Office Box 655303, Dallas, Texas 75265Copyright 2013, Texas Instruments Incorporated
Software testing relies on the results reported by the PTP stack to show the quality of the time synchronization. This means that the software results are subject to the same limitations as the PTP algorithm itself. The primary limitation of the PTP algorithm is that it cannot correct for differences in the