Transcription
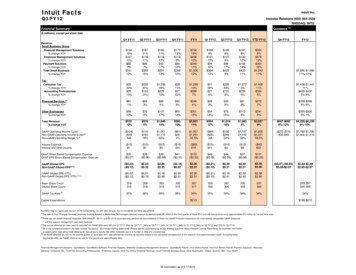
Intuit FactsIntuit Inc.Q3/FY12Investor Relations (650) 944-2536NASDAQ: INTUPreliminary: Last Updated Feb. 12, 2010Guidance [D]Financial Summary( millions), except per share dataQ1 FY11Q2 FY11Q3 FY11Q4 FY11FY11Q1 FY12Q2 FY12Q3 FY12YTD FY12 15415% 10711% 807% 34112% 18721% 11611% 857% 38915% 18211% 11512% 9317% 39113% 17712% 1195% 9012% 38610% 70015% 45810% 34811% 1,50612% 1689% 12113% 9419% 38413% 1996% 1279% 9917% 4259% 1978% 13012% 10614% 43311% 5648% 37812% 30016% 1,24211% 1,665- 1,69011%-12%TaxConsumer Tax% change YOYAccounting Professionals% change YOY 2932% 2515% 205(6%) 122(2%) 1,03618% 22510% 2811% 2722% 1,29913% 3997% 4139% 276% 29544% 1318% 1,0723% 2365% 1,40811% 3946% 1,436- 1,44111% 420- 4305%-8%Financial Services [A]% change YOY 811% 843% 895% 928% 3464% 899% 929% 912% 2727% 358- 3684%-6%Other Businesses% change YOY 5627% 785% 10717% 6014% 30115% 54(3%) 75(5%) 1136% 2410% 300- 3050%-1%Total Revenue% change YOY 53212% 8785% 1,84815% 59310% 3,85111% 59412% 1,01916% 1,9455% 3,5579% 647- 6629%-12% 4,205- 4,2209%-10%GAAP Operating Income (Loss)Non-GAAP Operating Income (Loss)[B]Non-GAAP Operating Margin %[B]( 104)( 53)NA 110 16419% 1,061 1,11560%( 61) 254% 1,007 1,25132.5%( 94)( 29)NA 192 24924% 1,107 1,15259% 1,205 1,37138.5%( 25)-( 15) 30- 40 1,180- 1,190 1,400- 1,410( 15) 7( 15) 7( 15) 5( 15)( 1)( 60) 19( 15) 11( 15) 3( 12) 9( 42) 23GAAP Share Based Compensation ExpenseGAAP EPS Share Based Compensation Expense 35( 0.07) 38( 0.08) 39( 0.08) 41( 0.10) 153( 0.33) 40( 0.09) 44( 0.09) 37( 0.08) 121( 0.26)GAAP Diluted EPSNon-GAAP Diluted EPS[B] [C]( 0.22)( 0.12) 0.23 0.32 2.20 2.33( 0.19) 0.02 2.00 2.51( 0.21)( 0.10) 0.39 0.51 2.42 2.51 2.58 2.90( 0.07)-( 0.05) 0.05- 0.07 2.44- 2.49 2.92- 2.97GAAP Diluted EPS (YTD)Non-GAAP Diluted EPS (YTD) [B] [C]( 0.22)( 0.12) 0.01 0.19 2.16 2.48 2.00 2.51 2.00 2.51( 0.21)( 0.10) 0.18 0.41 2.58 2.90 2.58 2.90Basic Share CountDiluted Share 303297306GAAP Tax Rate [E]37%28%35%26%34%35%34%34%34%Revenue:Small Business GroupFinancial Management Solutions% change YOYEmployee Management Solutions% change YOYPayment Solutions% change YOYTotal Small Business% change YOYInterest ExpenseInterest and Other IncomeCapital Expenditures 213Numbers may not agree with the sum of the components, nor with SEC filing(s), due to immaterial rounding adjustments.[A]The sale of Intuit Financial Services' corporate banking solution to Bottomline Technologies reduced revenue by approximately 5 million in the third quarter of fiscal 2012 and will reduce revenue by approximately 12 million for the full fiscal year.[B]These are non-GAAP financial measures. See tables B1, B2, E1 and E2 of the accompanying sections for reconciliations of these non-GAAP financial measures to the most directly comparable GAAP measuresand the reasons management uses each measure.[C]The annual effective tax rates used to calculate non-GAAP EPS were 36% for Q1 FY11, 35% for Q2 FY11, 34% for Q3 FY11, 34% for Q4 FY11, 34% for Q1 FY12, 34% for Q2 FY12, and 33% for Q3 FY12.[D]All of the numbers provided in the table entitled "Guidance," are forward-looking statements. Please see the accompanying section entitled "Cautions About Forward-Looking Statements" for important informationto assess when evaluating these statements. Actual future results may differ materially due to a number of risks and uncertainties.Our GAAP effective tax rate for the second quarter of fiscal year 2011 was affected by one-time tax benefits related to the retroactive reinstatement of the research and experimentation credit. Excluding those[E]discrete benefits, our GAAP effective tax rate for that period was approximately 36%.Financial Management Solutions - QuickBooks: QuickBooks Software, Financial Supplies, Websites; Employee Management Solutions - QuickBooks Payroll, Intuit Online Payroll, Intuit Full Service Payroll; Payment Solutions - MerchantServices; Consumer Tax - TurboTax; Accounting Professionals - ProSeries, Lacerte, Intuit Tax Online; Financial Services - Intuit Financial Services Group; Other Businesses - Global, Quicken, Mint, Intuit HealthAll information as of 5/17/2012Q4 FY12FY12293-297304-30834% 190- 210
Intuit FactsBusiness MetricsQ1 FY10Q2 FY10Q3 FY10Q4 FY10FY10Q1 FY11Q2 FY11Q3 FY11Q4 FY11FY11Q1 FY12Q2 FY12Q3 FY12Total Small Business Customers .1Financial Management Solutions [G]Total QuickBooks Units 81,1681,1681,1841,1941,200EMS Online Payment SolutionsMerchant Account Services customers [K] [L]Yr/Yr Charge Volume/Merchant increase(decrease) 21%3221%3301%3350%3580%Desktop unitsWeb unitsFree File AllianceTotal TurboTax federal 916.6Federal TurboTax retail share[M]Unit share FYTDDollar share %89%85%89%NMNM87%91%85%89%Accounting ProfessionalsProfessional Tax 27410,8874,316Units in thousands, except where notedSmall BusinessQuickBooks Online Subscribers[I]Enterprise Solutions SubscribersEmployee Management SolutionsTotal EMS Customers [J]Consumer TaxFederal TurboTax (millions)Financial ServicesNumber of Internet Banking End-UsersNumber of Bill Pay End-Users[N]9,9943,673Numbers may not agree with the sum of the components, nor with SEC filing(s), due to immaterial rounding adjustments.[F]If Small Business Customers are using more than one offering, we count them only once.[G]Sales to end users (sell-through) by Intuit and via retailers and distributors for which Intuit relies on reports from these merchants. These numbers include estimates, including estimates ofsales by merchants who do not report sales to Intuit. These numbers reflect total QuickBooks purchases for the period, including subscription purchases.[H]Total QuickBooks Units are paid only, and include QB Desktop, QB Online gross new subscribers and QB Enterprise new and renewal units.[I]Includes total QuickBooks Online subscriptions. Subscription units sold in any particular period are a subset of total QuickBooks software units sold in that period.[J]Includes Standard Payroll, Enhanced Payroll, Assisted Payroll, Online Payroll, Basic Payroll, QuickPayroll, and PayCycle.[K]Does not include customers from Electronic Clearing House.[L]Includes processing customers only.[M]Sources: NPD Group Retail Software Report through April 2012.[N]Number of Bill Pay end-users are those of Intuit Financial Services and exclude Quicken Bill Pay customers, and exclude end-users moved to Bottomline Technologies beginning in period Q3 FY12.All information as of 5/17/2012
Intuit FactsIntuit Inc.Investor Relations (650) 944-2536NASDAQ: INTUSegment Revenue (YTD)Q3 YTD FY12( millions)Q3 YTD FY11Svcs asProduct 166 32 119 316 207 19 542 213 343 0 141 1,239QB DesktopQB Online and EnterpriseWebsites, Support, Supplies, & Other Conn. SvcsFinancial Management SolutionsEmployee Management SolutionsPayment SolutionsTotal Small BusinessConsumer TaxAccounting ProfessionalsFinancial ServicesOther BusinessesTotal Segment RevenueServices[O] 2 114 132 247 171 281 700 1,195 51 272 100 2,318Total 167 146 251 564 378 300 1,242 1,408 394 272 241 3,557% of Total1%78%53%44%45%94%56%85%13%100%41%65%Svcs asProduct 170 27 108 305 193 24 522 254 315 0 155 1,247Services[O] 1 86 131 218 146 234 597 1,017 57 254 86 2,011FY11 154 197 45 396 876 241 57 59 1,629% RelatedRevenue29%58%17%35%69%65%22%25%50%Total 171 113 239 523 339 258 1,120 1,271 372 254 241 3,258% of Total0%76%55%42%43%91%53%80%15%100%36%62%Segment Operating IncomeFinancial Management SolutionsEmployee Management SolutionsPayment SolutionsTotal Small BusinessConsumer TaxAccounting ProfessionalsFinancial ServicesOther BusinessesTotal Segment Op IncomeFY12 72 81 26 179 845 194 22 49 1,290Q3% RelatedRevenue36%62%25%41%79%82%25%43%66%FY11 61 70 20 151 853 187 20 42 1,253% RelatedRevenue33%61%22%39%82%83%22%40%68%Financial ServicesFY11Prior FY12GuidanceCorp BankingDivestitureNew FY12GuidanceRevenue 346 370- 380( 12) 358- 3687%-10%- 3.5 pts4%-6%Growth RateNumbers may not agree with the sum of the components, nor with SEC filing(s), due to immaterial rounding adjustments.[O]Services revenue includes service and other revenue as reported in SEC filing(s).All information as of 5/17/2012FY12 181 228 73 481 931 261 66 58 1,797YTD% RelatedRevenue32%60%24%39%66%66%24%24%51%Full Year% RelatedFY11Revenue 22031% 27159% 6519% 55637% 84965% 22857% 8324% 6722% 1,78346%
TABLE A1INTUIT INC.GAAP CONSOLIDATED STATEMENTS OF OPERATIONS(In millions, except per share amounts)(Unaudited)Three Months EndedApril 30,April 30,20122011Net revenue:ProductService and otherTotal net revenueCosts and expenses:Cost of revenue:Cost of product revenueCost of service and other revenueAmortization of acquired technologySelling and marketingResearch and developmentGeneral and administrativeAmortization of other acquired intangible assetsTotal costs and expenses [A]Operating incomeInterest expenseInterest and other income, netIncome before income taxesIncome tax provision [B]Net income 734 688Nine Months EndedApril 30,April 30,20122011 1,185397788 1,043352691Basic net income per shareShares used in basic per share calculations 2.49295 2.27303 2.65297 2.23309Diluted net income per shareShares used in diluted per share calculations 2.42303 2.20313 2.58306 2.16319Dividends declared per common share 0.15 — 0.45 —See accompanying Notes.
INTUIT INC.NOTES TO TABLE A1[A] The following table summarizes the total share-based compensation expense that we recorded for the periods shown.Three Months EndedApril 30,April 30,20122011(in millions)Cost of revenueSelling and marketingResearch and developmentGeneral and administrativeTotal share-based compensation expense 114111137 212131239Nine Months EndedApril 30,April 30,20122011 4433736120 5333836112[B] We compute our provision for or benefit from income taxes by applying the estimated annual effective tax rate to incomeor loss from recurring operations and adding the effects of any discrete income tax items specific to the period. Oureffective tax rates did not differ significantly from the federal statutory rate of 35% for any period presented.
TABLE A2INTUIT INC.NON-GAAP CONSOLIDATED STATEMENTS OF OPERATIONS(In millions, except per share amounts)(Unaudited)Three Months EndedApril 30,April 30,20122011Net revenue:ProductService and otherTotal net revenueCosts and expenses:Cost of revenue:Cost of product revenueCost of service and other revenueSelling and marketingResearch and developmentGeneral and administrativeTotal costs and expensesOperating incomeInterest expenseInterest and other income, netIncome before income taxesIncome tax provisionNet income 5981,3471,94532165351156907941,151(12)41,143382761 Nine Months EndedApril 30,April 30,20122011 447888 9407792Basic net income per shareShares used in basic per share calculations 2.58295 2.41303 2.99297 2.56309Diluted net income per shareShares used in diluted per share calculations 2.51303 2.33313 2.90306 2.48319See “About Non-GAAP Financial Measures” immediately following Table E2 for information on these measures, the items excluded from themost directly comparable GAAP measures in arriving at non-GAAP financial measures, and the reasons management uses each measure andexcludes the specified amounts in arriving at each non-GAAP financial measure.
TABLE B1INTUIT INC.RECONCILIATION OF NON-GAAP STATEMENTS OF OPERATIONS DATATO GAAP CONSOLIDATED STATEMENTS OF OPERATIONS(In millions, except per share amounts)(Unaudited)Three Months EndedThree Months EndedApril 30, 2012April 30, 2011GAAPNet revenue:ProductService and otherTotal net revenueCosts and expenses:Cost of revenue:Cost of product revenueCost of service and other revenueAmortization of acquired technologySelling and marketingResearch and developmentGeneral and administrativeAmortization of other acquired intangibleassetsTotal costs and expensesOperating incomeInterest expenseInterest and other income, netIncome before income taxesIncome tax provisionNet income 5981,3471,945 32166436516710228381,107(12)91,104370 734NonGAAPAdjmts————(1)(4)(14)(11)(12) [a][b][a][a][a] [c](2) [b](44) 44—(5) [d]3912 [e]275981,3471,945GAAP ,151(12)117871,061(15)41,143382 76161,052364 688NonGAAPAdjmts ————(2)(4)(12)(13)(12) 32130—33915181[a][b][a][a][a](11) [b](54) 54—(1) [d]5311 [e]426021,2461,848—7331,115(15)51,105375 730Basic net income per shareShares used in basic per share calculations 2.49295 2.58295 2.27303 2.41303Diluted net income per shareShares used in diluted per share calculations 2.42303 2.51303 2.20313 2.33313See “About Non-GAAP Financial Measures” immediately following Table E2 for more information on these non-GAAP adjustments.[a] Adjustments to exclude share-based compensation expense from non-GAAP financial measures. See footnote A to Table A1.[b] Adjustments to exclude amortization of acquired technology and amortization of other acquired intangible assets from non-GAAPfinancial measures.[c] Adjustment to exclude professional fees for business combinations of approximately 1 million from non-GAAP financial measures.[d] Adjustment to exclude net gains on debt securities and other investments from non-GAAP financial measures.[e] Adjustments to reflect the tax effects of items [a] through [d].
TABLE B2INTUIT INC.RECONCILIATION OF NON-GAAP STATEMENTS OF OPERATIONS DATATO GAAP CONSOLIDATED STATEMENTS OF OPERATIONS(In millions, except per share amounts)(Unaudited)GAAPNet revenue:ProductService and otherTotal net revenueCosts and expenses: 1,2392,3193,558Cost of revenue:Cost of product revenue116Cost of service and other revenue456Amortization of acquired technology12Selling and marketing945Research and development502General and administrative289Amortization of other acquired intangibleassets33Total costs and expenses2,353Operating income1,205Interest expense(43)Interest and other income, net23Income before income taxes1,185Income tax provision397Net income 788Nine Months EndedNine Months EndedApril 30, 2012April 30, 2011Adjmts ————(4)(12)(43)(37)(37)[a][b][a][a][a] [c](33) [b](166) 166—(16) [d]15050 [e]100NonGAAPGAAP 1,2392,3193,558 —2,1871,371(43)332,1901,068(45)71,335447 888201,043352 691NonGAAPAdjmts ————(5)(13)(33)(38)(36) 3) [b](158) 158—(2) [d]15655 [e]101—2,0321,226(45)181,199407 792Basic net income per shareShares used in basic per share calculations 2.65297 2.99297 2.23309 2.56309Diluted net income per shareShares used in diluted per share calculations 2.58306 2.90306 2.16319 2.48319See “About Non-GAAP Financial Measures” immediately following Table E2 for more information on these non-GAAP adjustments.[a] Adjustments to exclude share-based compensation expense from non-GAAP financial measures. See footnote A to Table A1.[b] Adjustments to exclude amortization of acquired technology and amortization of other acquired intangible assets from non-GAAPfinancial measures.[c] Adjustment to exclude professional fees for business combinations of approximately 1 million from non-GAAP financial measures.[d] Adjustment to exclude net gains on debt securities and other investments from non-GAAP financial measures.[e] Adjustments to reflect the tax effects of items [a] through [c].
TABLE E1INTUIT INC.RECONCILIATION OF FORWARD-LOOKING GUIDANCE FOR NON-GAAP FINANCIAL MEASURESTO PROJECTED GAAP REVENUE, OPERATING INCOME (LOSS), AND EPS(In millions, except per share amounts)(Unaudited)Forward-Looking GuidanceGAAPRange of EstimateFromNon-GAAPRange of EstimateToAdjmtsFromToThree Months Ending July 31, 2012RevenueOperating income (loss)Diluted earnings per share 647 (25) (0.07) 662 (15) (0.05) —550.12 4,2051,1802.444,2201,1902.49—2200.48[a][b] 647300.05 662400.07 4,2051,4002.92 4,2201,4102.97Twelve Months Ending July 31, 2012RevenueOperating incomeDiluted earnings per share [c][d]See “About Non-GAAP Financial Measures” immediately following Table E2 for information on these measures, the itemsexcluded from the most directly comparable GAAP measures in arriving at non-GAAP financial measures, and the reasonsmanagement uses each measure and excludes the specified amounts in arriving at each non-GAAP financial measure.[a] Reflects estimated adjustments for share-based compensation expense of approximately 49 million; amortization ofacquired technology of approximately 4 million; and amortization of other acquired intangible assets of approximately 2million.[b] Reflects the estimated adjustments in item [a] and income taxes related to these adjustments.[c] Reflects estimated adjustments for share-based compensation expense of approximately 169 million; amortization ofacquired technology of approximately 16 million; and amortization of other acquired intangible assets of approximately 35 million.[d] Reflects the estimated adjustments in item [c], an adjustment of 16 million for net gains on debt securities and otherinvestments, and income taxes related to these adjustments.
TABLE E2INTUIT INC.RECONCILIATION OF HISTORICAL NON-GAAP FINANCIAL MEASURES TO MOST DIRECTLY COMPARABLE GAAP FINANCIAL MEASURES(In millions, except per share amounts)(Unaudited)Fiscal 2011Fiscal 2012Q1Q2Q3Q4GAAP operating income (loss)Amortization of acquired technologyAmortization of other acquired intangible assetsGoodwill and intangible asset impairment chargeProfessional fees for business combinationsShare-based compensation expenseNon-GAAP operating income (loss) (104)411—135 (53) 111511—(1)38 164 1,061411——39 1,115 (61)41130—41 25GAAP net income (loss)Amortization of acquired technologyAmortization of other acquired intangible assetsGoodwill and intangible asset impairment chargeProfessional fees for business combinationsShare-based compensation expenseNet gains on debt securities and other investmentsIncome tax effect of non-GAAP adjustmentsNon-GAAP net income (loss) (70)411—135(1)(19) (39) 73511—(1)38—(25) 101 688411——39(1)(11) 730GAAP diluted net income (loss) per shareNon-GAAP diluted net income (loss) per share (0.22) (0.12) 0.23 0.32 2.20 2.33FullYearFullYearQ1Q2Q3Q4 1,007174430—153 1,251 (94)421——40 (29) 192410——43 249 1,10742—137 1,151 —————— — 1,2051233—1120 1,371 (57)41130—41—(23) 6 634174430—153(2)(78) 798 (64)421——40(11)(19) (29) 118410——43—(19) 156 73442—137(5)(12) 761 ———————— — 7881233—1120(16)(50) 888 (0.19) 0.02 2.00 2.51 (0.21) (0.10) 0.39 0.51 2.42 2.51 — — 2.58 2.90Shares used in diluted per share calculation316318313312317300306303—306Non-GAAP tax .5%See “About Non-GAAP Financial Measures” immediately following this Table E2 for information on these measures, the items excluded from the most directly comparable GAAP measuresin arriving at non-GAAP financial measures, and the reasons management uses each measure and excludes the specified amounts in arriving at each non-GAAP financial measure.
INTUIT INC.ABOUT NON-GAAP FINANCIAL MEASURESThe accompanying financial information dated May 17, 2012 contains non-GAAP financial measures. Table B1, Table B2,Table E1 and Table E2 reconcile the non-GAAP financial measures in that financial information to the most directlycomparable financial measures prepared in accordance with Generally Accepted Accounting Principles (GAAP). These nonGAAP financial measures include non-GAAP operating income (loss), non-GAAP net income (loss) and non-GAAP netincome (loss) per share.Non-GAAP financial measures should not be considered as a substitute for, or superior to, measures of financial performanceprepared in accordance with GAAP. These non-GAAP financial measures do not reflect a comprehensive system ofaccounting, differ from GAAP measures with the same names and may differ from non-GAAP financial measures with thesame or similar names that are used by other companies.We compute non-GAAP financial measures using the same consistent method from quarter to quarter and year to year. Wemay consider whether other significant items that arise in the future should be excluded from our non-GAAP financialmeasures.We exclude the following items from all of our non-GAAP financial measures: Share-based compensation expenseAmortization of acquired technologyAmortization of other acquired intangible assetsGoodwill and intangible asset impairment chargesProfessional fees for business combinationsWe also exclude the following items from non-GAAP net income (loss) and diluted net income (loss) per share: Gains and losses on debt securities and other investmentsIncome tax effects of excluded items and discrete tax itemsDiscontinued operationsWe believe that these non-GAAP financial measures provide meaningful supplemental information regarding Intuit'soperating results primarily because they exclude amounts that we do not consider part of ongoing operating results whenplanning and forecasting and when assessing the performance of the organization, our individual operating segments or oursenior management. Segment managers are not held accountable for share-based compensation expenses, acquisition-relatedcharges, or the other excluded items and, accordingly, we exclude these amounts from our measures of segment performance.We believe that our non-GAAP financial measures also facilitate the comparison by management and investors of results forcurrent periods and guidance for future periods with results for past periods.The following are descriptions of the items we exclude from our non-GAAP financial measures.Share-based compensation expenses. These consist of non-cash expenses for stock options, restricted stock units and ourEmployee Stock Purchase Plan. When considering the impact of equity awards, we place greater emphasis on overallshareholder dilution rather than the accounting charges associated with those awards.Amortization of acquired technology and amortization of other acquired intangible assets. When we acquire an entity, weare required by GAAP to record the fair values of the intangible assets of the entity and amortize them over their useful lives.Amortization of acquired technology in cost of revenue includes amortization of software and other technology assets ofacquired entities. Amortization of other acquired intangible assets in operating expenses includes amortization of assets suchas customer lists, covenants not to compete and trade names.Goodwill and intangible asset impairment charges. We exclude from our non-GAAP financial measures non-cash charges toadjust the carrying values of goodwill and other acquired intangible assets to their estimated fair values.Professional fees for business combinations. We exclude from our non-GAAP financial measures the professional fees weincur to complete business combinations. These include investment banking, legal and accounting fees.
Gains and losses on debt securities and other investments. We exclude from our non-GAAP financial measures gains andlosses that we record when we sell or impair available-for-sale debt securities and other investments.Income tax effects of excluded items and certain discrete tax items. We exclude from our non-GAAP financial measures theincome tax effects of the items described above, as well as income tax effects related to business combinations. In addition,the effects of one-time income tax adjustments recorded in a specific quarter for GAAP purposes are reflected on a forecastedbasis in our non-GAAP financial measures. This is consistent with how we plan, forecast and evaluate our operating results.Operating results and gains and losses on the sale of discontinued operations. From time to time, we sell or otherwisedispose of selected operations as we adjust our portfolio of businesses to meet our strategic goals. In accordance with GAAP,we segregate the operating results of discontinued operations as well as gains and losses on the sale of these discontinuedoperations from continuing operations on our GAAP statements of operations but continue to include them in GAAP netincome or loss and net income or loss per share. We exclude these amounts from our non-GAAP financial measures.The reconciliations of the forward-looking non-GAAP financial measures to the most directly comparable GAAP financialmeasures in Table E1 include all information reasonably available to Intuit at the date of this financial information. Thesetables include adjustments that we can reasonably predict. Events that could cause the reconciliation to change includeacquisitions and divestitures of businesses, goodwill and other asset impairments, and sales of available-for-sale debtsecurities and other investments.
INTUIT INC.CAUTIONS ABOUT FORWARD-LOOKING STATEMENTSThis financial information contains forward-looking statements, including forecasts of Intuit's future expected financial results.Because these forward-looking statements involve risks and uncertainties, there are important factors that could cause ouractual results to differ materially from the expectations expressed in the forward-looking statements. These factors include,without limitation, the following: inherent difficulty in predicting consumer behavior; difficulties in receiving, processing, orfiling customer tax submissions; consumers may not respond as we expected to our advertising and promotional activities;product introductions and price competition from our competitors can have unpredictable negative effects on our revenue,profitability and market position; governmental encroachment in our tax businesses or other governmental activities or publicpolicy affecting the preparation and filing of tax returns could negatively affect our operating results and market position; wemay not be able to successfully innovate and introduce new offerings and business models to meet our growth and profitabilityobjectives, and current and future offerings may not adequately address customer needs and may not achieve broad marketacceptance, which could harm our operating results and financial condition; business interruption or failure of our informationtechnology and communication systems may impair the availability of our products and services, which may damage ourreputation and harm our future financial results; as we upgrade and consolidate our customer facing applications and supportinginformation technology infrastructure, any problems with these implementations could interfere with our ability to deliver ourofferings; any failure to properly use and protect personal customer information and data could harm our revenue, earnings andreputation; if we are unable to develop, manage and maintain critical third party business relationships, our business may beadversely affected; increased government regulation of our businesses may harm our operating results; if we fail to processtransactions effectively or fail to adequately protect against potential fraudulent activities, our revenue and earnings may beharmed; any significant offering quality problems or delays in our offerings could harm our revenue, earnings and reputation;our participation in the Free File Alliance may result in lost revenue opportunities and cannibalization of our traditional paidfranchise; the continuing global economic downturn may continue to impact consumer and small business spending, financialinstitutions and tax filings, which could negatively affect our revenue and profitability; year-over-year changes in the totalnumber of tax filings that are submitted to government agencies due to economic conditions or otherwise may result in lostrevenue opportunities; our revenue and earnings are highly seasonal and the timing of our revenue between quarters is difficultto predict, which may cause significant quarterly fluctuations in our financial results; our financial position may not makerepurchasing shares advisable or we may issue additional shares in an acquisition causing our number of outstanding shares togrow; our inability to adequately protect our intellectual property rights may weaken our competitive position and reduce ourrevenue and earnings; our acquisition and divestiture activities may disrupt our ongoing business, may involve increasedexpenses and may present risks not contemplated at the time of the transactions; our use of significant amounts of debt tofinance acquisitions or other activities could harm our financial condition and results of operation; and litigation involvingintellectual property, antitrust, shareholder and other matters may increase our costs. More details about these and other risksthat may impact our business are included in our Form 10-K for fiscal 2011 and in our other SEC filings. You can locate thesereports through our website at http://investors.intuit.com. Forward-looking statements are based on information as of May 17,2012, and we do not undertake any duty to update any forward-looking statement or other information in these materials.
Subscription units sold in any particular period are a subset of total QuickBooks software units sold in that period. [J] Includes Standard Payroll, Enhanced Payroll, Assisted Payroll, Online Payroll, Basic Payroll, QuickPayroll, and PayCycle.