Transcription
National Deaf Center on Postsecondary OutcomesDeaf People andEducational Attainmentin the United States:2017Carrie Lou GarberoglioStephanie CawthonAdam Sales 2017 National Deaf Center on Postsecondary OutcomesDeaf People and Educational Attainment in the United States: 2017 licensed under Creative Commons BY-NC-ND 4.01
This document was developed under a grant from the U.S. Department of Education, OSEP#HD326D160001. However, the contents do not necessarily represent the policy of the U.S.Department of Education, and you should not assume endorsement by the federal government.2 2017 National Deaf Center on Postsecondary OutcomesDeaf People and Educational Attainment in the United States: 2017 licensed under Creative Commons BY-NC-ND 4.0
INTRODUCTIONContinuing education and training after high school is becoming increasingly important for successfulindependent living and employment in the United States. Recognizing the great need for skilledemployees who can meet the competitive demands of the modern workforce, current legislationand public policy are designed to facilitate conditions that support continuing education and trainingfor all individuals. Legislation has also increased the accessibility of postsecondary education andtraining programs for deaf individuals, who are now enrolled in a wide variety of educational programsacross the United States. Current data on educational attainment for deaf people suggest areas ofoptimism, but also areas of concern.This report provides a comprehensive overview of the most current data on educational attainmenttrends and trajectories for deaf individuals in the United States, serving as a resource for communitymembers, educators, researchers, and policymakers. We used data from the 2015 AmericanCommunity Survey (ACS), a national survey conducted by the U.S. Census Bureau. We limited oursample to individuals ages 25—64 to capture educational attainment data for individuals more likelyto have completed postsecondary education and training. More information about this dataset andthe analyses are shared in the Methods section at the end of this report.Key findings are summarized below. In general, deaf people attain lower levels of education than hearing people. 51% of deaf people complete at least some college. Younger deaf people are increasingly more likely to graduate from high school. General educational attainment rates have increased since 2008. Deafdisabled individuals demonstrate lower educational attainment levels. Deaf women attend college at higher rates than deaf men. It is necessary to recognize how the intersectional identities of deaf people interact witheducational experiences and outcomes. Income and employment vary across fields of degree.In this report, we use the term deaf in an all-encompassing manner to includeindividuals who identify as Deaf, hard of hearing, hearing impaired, late deafened,and deafdisabled. 2017 National Deaf Center on Postsecondary OutcomesDeaf People and Educational Attainment in the United States: 2017 licensed under Creative Commons BY-NC-ND 4.03
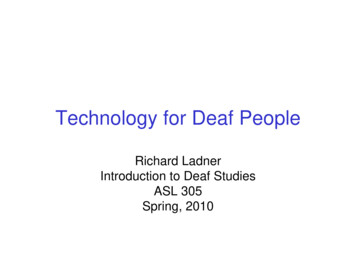
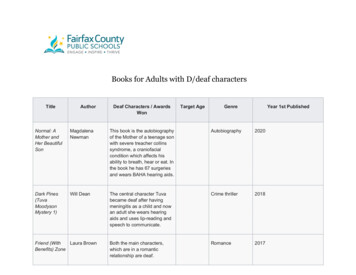
GENERAL EDUCATIONAL ATTAINMENT STATISTICSOverall, data show that deaf people attainedlower levels of education than their hearingpeers (see Figure 1). In 2015, 83% of deaf adultsin the United States had successfully completedhigh school, compared to 89% of hearingadults, a gap of 6%. The gap in educationalattainment between deaf and hearing peoplewas the widest, at 15%, among individuals whohad completed at least a bachelor’s degree.This is important because increasing levels ofeducational attainment narrows the employmentgap between deaf and hearing individuals(Garberoglio, Cawthon, & Bond, 2016). Only18% of deaf adults in the United States hadcompleted a bachelor’s degree or more,compared to 33% of hearing adults.Figure 1EDUCATIONAL ATTAINMENTDEAFINDIVIDUALS6% gap89%83%33%63%12% gap51%15% gap5% gap12%7%18%HEARINGINDIVIDUALSHIGH SCHOOLSOME COLLEGEThere is evidence that educational attainmentmay be improving for younger people. Adultsages 25–34 have the highest rates of highschool completion (see Figure 2). Deaf adultsdemonstrated a significant downward trend inhigh school completion across age, indicatingthat younger deaf people were more likely tocomplete high school. College completion is4BACHELOR’S BACHELOR’Smore variable between age groups for deafindividuals, with no clear demonstrated trendsin college completion across age groups.Educational attainment gaps between deaf andhearing people appear to be roughly consistentacross age groups. 2017 National Deaf Center on Postsecondary OutcomesDeaf People and Educational Attainment in the United States: 2017 licensed under Creative Commons BY-NC-ND 4.0
Figure 2EDUCATIONAL ATTAINMENT BY LS88%84%AGES 25–3482%AGES 35–4467%89%88%82%AGES 45–54AGES 55–6465%SOMECOLLEGE61%54%52%51%49%AGES 25–34AGES 35–4460%AGES 45–54AGES 55–6435%35%BACHELOR’S31%20%17%AGES 25–34 BACHELOR’S11%AGES 45–5413%8%4%AGES 25–3418%17%AGES 35–44AGES 35–4430%AGES 55–6412%6%AGES 45–5412%7%AGES 55–64 2017 National Deaf Center on Postsecondary OutcomesDeaf People and Educational Attainment in the United States: 2017 licensed under Creative Commons BY-NC-ND 4.05
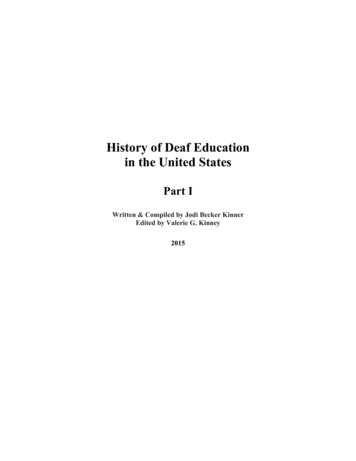
EDUCATIONAL ATTAINMENT AMONG DEAFDISABLED INDIVIDUALSA large percentage of deaf individuals have anadditional disability, each combination of whichresults in unique strengths and challenges.Educational attainment rates vary across typeof disability (see Figure 3). On average, deafindividuals with any type of additional disabilityreported lower educational attainment levels.The lowest educational attainment levelswere found amongst deaf individuals whowere reported to have difficulties with livingindependently.In our analyses, we were limited to the disabilitycategories that are used by the U.S. Census,which does not recognize group identitypreferences or complex differences within broaddisability categories. The U.S. Census focuseson functional abilities and does not attend tomore complex issues surrounding identity,which is a limitation of this dataset. However,at a minimum, it is necessary to recognizethat educational experiences continue to besignificantly more challenging for deafdisabledindividuals.Figure 3EDUCATIONAL ATTAINMENT BY DISABILITYHIGHSCHOOLSOMECOLLEGEBACHELOR’S BACHELOR’SDEAF NO ADDITIONAL DISABILITY88%56%23%8%DEAF ANY ADDITIONAL DISABILITY76%44%12%4%DEAF AMBULATORY DISABILITY74%41%9%4%DEAFBLIND72%40%11%4%DEAF COGNITIVE DISABILITY72%38%9%3%DEAF INDEPENDENT LIVING DIFFICULTY71%36%9%3%HIGH SCHOOL ITH NO FDISABLEDINDIVIDUALS 2017 National Deaf Center on Postsecondary OutcomesDeaf People and Educational Attainment in the United States: 2017 licensed under Creative Commons BY-NC-ND 4.0
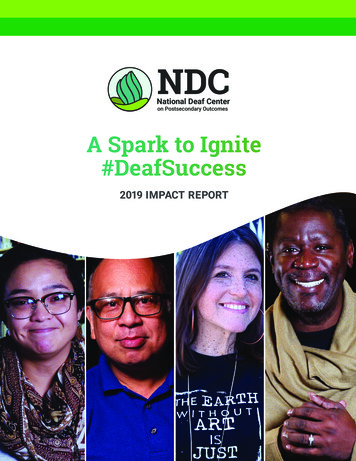
EDUCATIONAL ATTAINMENT BY RACE, ETHNICITY, AND GENDEREducational attainment varies across gender,race, and ethnicity (see Figures 4 and 5). Thereare gender gaps in educational attainment inboth groups; however, they occur at differentstages. Hearing women are more likely thanhearing men to graduate high school, whereasdeaf women and men graduate high school atapproximately the same rate. On the other hand,both deaf and hearing women are more likelythan men to go to college, even if they do notreceive a degree. However, a closer look at theeducational attainment gap between hearingand deaf people reveals that the gap is in mostcases wider for women than for men. In otherwords, compared to deaf women, deaf men arecompleting high school, enrolling in college, andearning a bachelor’s degree at rates closer tonational averages for their peers.Figure 4EDUCATIONAL ATTAINMENT BY OMECOLLEGE50%54%59%67%BACHELOR’S17%20%31%35%6% BACHELOR’S11%8%13% 2017 National Deaf Center on Postsecondary OutcomesDeaf People and Educational Attainment in the United States: 2017 licensed under Creative Commons BY-NC-ND 4.07
Educational attainment varies wildly acrossrace and ethnicity for hearing and deaf people.Among deaf and hearing people, white peoplewere most likely to have completed at leasta high school education and Asian peoplewere more likely to have taken college classesor completed a college degree. Educationalattainment disparities between deaf and hearingpeople of specific race and ethnicity groupsvaried between 1% and 27%. A closer look ateducational attainment gaps across race andethnicity reveals that the gap is larger for Asiansthan for all other race and ethnicity groups. Forinstance, 27% fewer deaf Asians than hearingAsians had completed at least a bachelor’sdegree. In other words, while an educationalattainment advantage was present for deafAsians, it was not as large as expected basedon the educational attainment trends for hearingAsians.Figure 5EDUCATIONAL ATTAINMENT BY RACE AND ETHNICITYDEAFINDIVIDUALSHEARINGINDIVIDUALSAFRICAN AMERICAN76%HIGH SCHOOLSOME COLLEGEBACHELOR’S88%42%57%11%22% BACHELOR’S 4%8%ASIAN76%HIGH SCHOOLSOME COLLEGE76%56%BACHELOR’S BACHELOR’S90%30%57%25%12%HISPANIC/LATINO65%HIGH SCHOOLSOME COLLEGEBACHELOR’S38%71%43%12%18% BACHELOR’S 4%6%MULTI-RACIAL8 2017 National Deaf Center on Postsecondary Outcomes69%71%Deaf People and Educational Attainment in the United States: 2017 licensed under Creative Commons BY-NC-ND 4.0HIGH SCHOOL41%SOME COLLEGEBACHELOR’S12%45%18%
HISPANIC/LATINO65%HIGH SCHOOL71%38%SOME COLLEGE43%12%BACHELOR’S18% BACHELOR’S 4%6%MULTI-RACIAL69%HIGH SCHOOL71%41%SOME COLLEGE45%12%BACHELOR’S18% BACHELOR’S 4%6%NATIVE AMERICAN81%HIGH SCHOOL53%SOME COLLEGE13%BACHELOR’S BACHELOR’S85%51%15%5%5%OTHERSOME COLLEGE63%56%BACHELOR’S BACHELOR’S86%67%HIGH SCHOOL17%35%6%12%PACIFIC ISLANDER84%HIGH SCHOOL52%SOME COLLEGEBACHELOR’S BACHELOR’S91%11%54%16%6%3%WHITE87%HIGH SCHOOL54%SOME COLLEGE20%BACHELOR’S BACHELOR’S94%7%69%37%14%Clearly, the complex intersections of race, ethnicity, and gender play a role in the educationalexperiences and outcomes of deaf people. 2017 National Deaf Center on Postsecondary OutcomesDeaf People and Educational Attainment in the United States: 2017 licensed under Creative Commons BY-NC-ND 4.09
FIELD OF DEGREEIndividuals in the United States receive bachelor’s degrees in fields ranging from biology to visualarts. The categories used in this report are based on the categories used by the U.S. Census. Deafindividuals completed their bachelor’s degrees in a variety of fields, at comparable rates to theirhearing peers (see Figure 6). The most popular field of degree for both hearing and deaf people wasbusiness and the second most popular was education.Figure 6PERCENTAGE OF GRADUATES BY FIELD OF ERINGHEARINGINDIVIDUALS8%6%LIBERAL ERPHYSICS6%3%3%5%PSYCHOLOGY5%9%SCIENCE RELATED10%7%SOCIAL SCIENCEVISUAL ARTS108%4%4% 2017 National Deaf Center on Postsecondary OutcomesDeaf People and Educational Attainment in the United States: 2017 licensed under Creative Commons BY-NC-ND 4.0
Individuals’ income and employment rates variedacross fields of degree (see Figures 7 and 8).The income gap between deaf and hearingpeople by field of degree ranged from nonefor those with degrees in communications to 18,000 for those with degrees in engineering.Deaf people with degrees in physics had medianearnings of 6,000 more than their hearingpeers.In general, individuals with bachelor’s degreesare employed at higher rates than thosewithout them, and deaf people are employed atlower rates than their hearing peers. For moreinformation about employment rates for deafindividuals in the United States, see Garberoglio,Cawthon, and Bond (2016). Employment ratesfor deaf individuals ranged from 64% for thosewith degrees in psychology to 80% for thosewith degrees in physics. For hearing individuals,those with degrees in education had the lowestemployment rates and those with degrees inengineering had the highest employment rates.The employment gap between deaf and hearingindividuals ranged from 4% for those withdegrees in physics to 17% for those with degreesin psychology.Figure 7MEDIAN INCOME BY FIELD OF 044,00047,000LIBERAL 00PHYSICS40,00043,000PSYCHOLOGY51,600SCIENCE RELATED60,00050,00056,000SOCIAL SCIENCEVISUAL ARTS30,50038,00011 2017 National Deaf Center on Postsecondary OutcomesDeaf People and Educational Attainment in the United States: 2017 licensed under Creative Commons BY-NC-ND 4.0
Figure 8EMPLOYMENT RATES BY FIELD OF %ENGINEERINGHEARINGINDIVIDUALSLIBERAL THER82%69%85%80%PHYSICSPSYCHOLOGYSCIENCE RELATEDSOCIAL SCIENCEVISUAL ARTS1284%64%81%72%86%70%83%68%82% 2017 National Deaf Center on Postsecondary OutcomesDeaf People and Educational Attainment in the United States: 2017 licensed under Creative Commons BY-NC-ND 4.0
CURRENT POSTSECONDARY ENROLLMENTIn 2015, 27% of deaf individuals ages 18–25 were currently enrolled in postsecondary education andtraining programs, compared to 39% of hearing individuals. Enrollment varied across gender, race, andethnicity (see Figure 9).Figure 9CURRENT ENROLLMENT BY RACE, GENDER, AND 46%32%MEN43%WOMEN45%AFRICAN /LATINOMEN67%47%30%44%45%51%13 2017 National Deaf Center on Postsecondary OutcomesDeaf People and Educational Attainment in the United States: 2017 licensed under Creative Commons BY-NC-ND 4.0
CHANGE OVER TIME IN EDUCATIONAL ATTAINMENTIn the United States, educational attainment rates have steadily increased over the years. This trend ispresent for both deaf and hearing individuals, as seen in Figure 10. High school completion increasedat a significantly higher rate for deaf adults (3%) than for hearing adults (1%) from 2008 to 2015.For bachelor’s degree attainment, the growth rates over time were comparable for deaf and hearingadults at 2% and 3%, respectively.Figure 10EDUCATIONAL ATTAINMENT OVER TIME, AGES 25–64HIGH SCHOOLCOMPLETIONDEAFHIGH 02011201220132014201580604020014 2017 National Deaf Center on Postsecondary OutcomesDeaf People and Educational Attainment in the United States: 2017 licensed under Creative Commons BY-NC-ND 4.0
METHODSThe data for this project were taken from thePublic Use Microdata Sample (PUMS) in the2015 American Community Survey (ACS)conducted by the U.S. Census. The PUMSprovide a confidential subset of the ACS for thepublic to analyze. The ACS is a legally mandatedquestionnaire that is typically used to determinehow federal funds are allocated from region toregion. As such, addresses of homes and groupquarters, rather than individuals, are sampled,meaning that these data are meant to generalizeto housing units, not individuals. Althoughthe PUMS provides data on both individualsand housing units, only individual-level datawere used for this project. More informationon the ACS can be found at www.census.gov/programs-surveys/acs/about.html.The sample of interest in these analyses waspeople ages 25–64. Recall that the U.S. Censuscollects data on functional limitations ratherthan disability or identity labels, so we usedthe variable “hearing difficulties” to track deafindividuals. The survey respondents who statedthat they had “hearing difficulties” were used torepresent the deaf population in these analyses.The final sample included more than 38,000deaf individuals. The comparison group, whatwe call hearing individuals, were those who didnot report having any “hearing difficulties.” Forthe most part, the data for the group of hearingindividuals are largely comparable to data forthe general population. But for comparisonpurposes, this analysis focuses on individualsin the general population who did not report anytype of “hearing difficulties,” which allows for anunderstanding of what educational experiencesmay be unique to the deaf population.The descriptive statistics in this report wereall corrected by the person-level surveyweights provided by the U.S. Census. Thesesurvey weights are intended to account for theintricacies involved in getting a sample that isrepresentative of the United States population.When numbers are compared to each other inthis report, we used a survey-corrected t-testto determine if difference in the numbers weredue to statistical noise. These statistical testsare purely descriptive in nature, and we do notintend to suggest that any of the associationsdescribed are causal in nature. As such, we didnot correct for any other variables in providingthese descriptive statistics.THIS REPORT MAY BE CITED AS:Garberoglio, C. L., Cawthon, S., & Sales, A. (2017). Deaf People and Educational Attainment in the United States: 2017.Washington, DC: U.S. Department of Education, Office of Special Education Programs, National Deaf Center onPostsecondary Outcomes.References:Garberoglio, C. L., Cawthon, S., & Bond, M. (2016). Deaf People and Employment in the United States: 2016. Washington,DC: U.S. Department of Education, Office of Special Education Programs, National Deaf Center on PostsecondaryOutcomes.15 2017 National Deaf Center on Postsecondary OutcomesDeaf People and Educational Attainment in the United States: 2017 licensed under Creative Commons BY-NC-ND 4.0
General educational attainment rates have increased since 2008. Deafdisabled individuals demonstrate lower educational attainment levels. Deaf women attend college at higher rates than deaf men. It is necessary to recognize how the intersectional identities of deaf people interact with educational experiences and outcomes.