Transcription
2017 Fiduciarymanagement feessurveyFebruary 2018
ContentsSurvey highlights4Introduction5Components of fees in a fiduciary management mandate7Fiduciary management fees8Investment management fees10Total fees11Expenses12How EY can help you13Appendix: How to read a box plot152017 Fiduciary management fees survey
Survey highlightsLarger range of fiduciary management feesThe spread of fiduciary management fees continues to rise, reflecting an increasing ability of the industry to provide solutions inline with different clients’ needs. A number of providers are now offering a range of solutions that vary in areas such as levels ofactive versus passive management, the allocations to alternative asset classes, and approaches to changing the asset allocationover time. This has had a direct impact on the level and structure of fees we have seen in our survey.Range of investment management feesThe fee differentials for investment management fees are surprisingly wide, even for asset classes such as passively managedequities, which suggests there are different abilities of fiduciary managers to negotiate fee discounts with underlying managers.Additionally, it means that trustees and sponsors need to look at all components of fees when assessing overall value for moneyfor a fiduciary management mandate.Relationship between fiduciary management fees and total costsThe relationship between fiduciary management fees and total costs is not so clear cut. Fiduciary management fees can rangefrom between 11% to 70% of total costs, further validating the need to consider total costs when comparing fees and costs, as alow fiduciary management fee in itself does not give any indication of total costs.2017 Fiduciary management fees survey
IntroductionBetter cost transparency aids assessment of valueOver time, we have seen an improvement in the transparency of fees and costs, and this survey aims to add more light to helptrustees and sponsors assess whether their fiduciary management arrangements provide value for money.With more demand for fiduciary management services, there continues to be evolution in the fiduciary managers’ offerings,which also impact the total costs. In addition to fiduciary management and investment management fees, we also asked thefiduciary managers to provide details of expenses that would be incurred; we believe it is important to understand totalinvestment costs.There is a lot of differentiation between the offerings of different fiduciary managers in terms of services provided, theunderlying investment beliefs and philosophies, and the portfolio construction process, to name a few. In order to create somecomparisons, for the purpose of our survey we gave the fiduciary managers a scenario, for four hypothetical pension schemeswith specific return targets, and left all remaining decisions (e.g., level of hedging and asset allocation) up to the fiduciarymanagers.Survey respondentsThe information in this survey is based on responses received from 15 fiduciary managers who collectively manage the majorityof assets in the UK fiduciary management industry (listed below). Of these 15 fiduciary managers, three provided two fiduciarysolutions, and therefore the survey is based on 18 different solutions. We would like to extend our gratitude to these firms fortheir participation.Aon HewittCardanoJLTMercerSchrodersBlackRockCharles StanleyKempenP-SolveSEICambridge AssociatesGoldman Sachs AssetManagementLGIMRussell InvestmentsWillis Towers WatsonThe information in this survey may be reproduced on the condition that EY and this document are acknowledged as the source ofthe material.2017 Fiduciary management fees survey
Introduction (cont’d)Hypothetical pension schemesThere are a number of providers of fiduciary management services, whose solutions can also differ depending on scheme sizeand objectives. In order to obtain comparable results across the providers, and for consistency with previous surveys, we basedthis survey on four hypothetical pension schemes: Small – 50m Medium – 250m Large – 750m Very large – 1.5bnIn all cases, the trustees require the full range of advisory, implementation and communication services (as described on theprevious page) from their fiduciary manager:In our previous surveys, we had specified an initial asset mix, and asked fiduciary managers to set out their fees assuming theasset allocation does not change. Increasingly, fiduciary managers have the freedom to allocate assets in line with their bestideas, provided they expect to generate the required return and operates in line with the pension scheme’s journey plan.Therefore, in this year’s survey, we specified the following characteristics for all four sample schemes: A liability duration of 20 years, with a 50:50 split between nominal and inflation-linked liabilities A target return of liabilities 2.5% pa2017 Fiduciary management fees survey
Components of fees in a fiduciarymanagement (FM) mandateComponents of feesThe fees in a fiduciary management mandate can be separated into three components:FM fees1. Fiduciary management (FM) feesThis represents the fee paid directly to the fiduciary manager for strategic advice; including modelling and setting theinvestment strategy, and implementation of the investment strategy; including manager selection, tactical assetallocation and implementing hedges. There may be a performance-related component to the fiduciary managementfees.IM fees2. Investment management (IM) feesTypically, fiduciary managers implement the chosen investment strategy via underlying investment managers. Thesefees make up a large part of overall costs, and are passed through to the client (i.e., the fiduciary manager does notmake profit on investment management fees).Expenses3. ExpensesThere can be other costs and expenses associated with a fiduciary management mandate. Whilst we have consideredexpenses in the context of total costs, we have not looked at individual expenses in detail within this survey.Typical services in an FM mandateFiduciary management is a service, and the fees reflect the level of services provided. In our experience, many schemes will havedifferent service needs and requirements, and therefore the fees do differ from client to client within the same fiduciarymanager. For instance, one pension scheme may define the asset allocation and delegate the decision to hire and fire investmentmanagers, whereas another could also delegate the asset allocation decision (giving the fiduciary manager further freedom overthe portfolio), which would have a higher fee associated with it.The following table shows the typical services which are commonly covered in a fiduciary mandate:Advisory services (FM advises trusteeswho ultimately make decision)Implementation services (trustees have delegated authority tothe FM to take actions on their behalf)Communication servicesDesign of a de-risking journey planImplementation of investment strategy (including liability hedging)MeetingsRegular recalibration of strategyExecution of journey plan de-riskingPerformance and risk reportingDynamic/tactical asset allocationTrustee trainingSelection/replacement of underlying investment managers2017 Fiduciary management fees survey
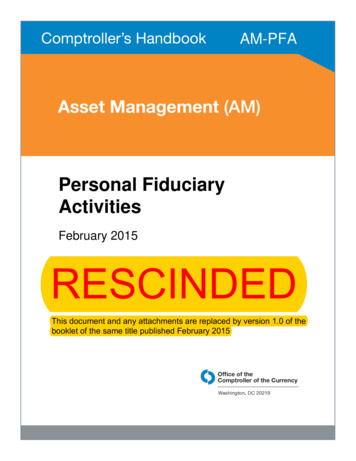
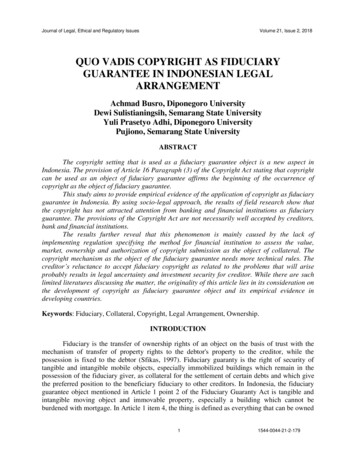
FM feesIM feesFiduciary management feesExpensesFiduciary management fees have typically been charged as a percentage of assets basis, however there are variations of feestructures available, including fixed nominal fees, which may increase annually in line with an index, such as inflation. Forcomparison purposes, we have shown fees as a percentage of assets within the results of our surveys.How have fiduciary management fees changed since 2013?Figure 1: Distribution of fiduciary management fees in 2013, 2015 and 20170.5%0.4%0.3%0.2%0.1%0.0% 50m 50m 50m 250m 250m2013 250m2015 750m 750m 750mN/A 1.5bn 1.5bn2017EY Insight:As in our previous surveys, the 2017 results show that fees reduce as scheme assets under management increase. This is anatural outcome of the cost of advisory services, which do not vary materially with size of assets, being spread over a largerasset base.There is a wider range of fees across all scheme sizes than in previous surveys, although the inter-quartile range has remainedbroadly consistent. This is largely the outcome of an increase in the number of solutions and providers in the market, designedto meet different clients’ needs; the fees are not dependent on the size of a scheme alone, but also the investment solution.2017 Fiduciary management fees survey
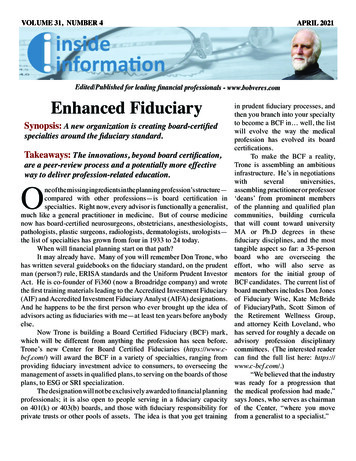
FM feesIM feesFiduciary management fee structuresThe structure of fees is coming into increasing scrutiny;transparency of fiduciary managers’ fees is more important toclients than ever before.ExpensesFigure 2 - % of schemes with performance-related fees fortheir fiduciary managerBundling of fees25%The typical fiduciary management fee structure separates FMfees from the fees of underlying investment managers. Thismeans that any changes to underlying manager fees,including savings negotiated by the fiduciary manager, passthrough to clients.A few providers offer a bundled fee structure whereby a clientwould pay a single fee covering both fees to the fiduciarymanager and underlying investment managers.75%% of clients with performance-related fees% of clients without performance-related feesPerformance-related feesEY Insight:There are divided opinions on compensation of fiduciarymanagers based on performance. A number of fiduciarymanagers are willing to offer performance-related feestructures, and our survey shows that around a quarter ofschemes that have appointed a fiduciary manager have aperformance-related fee structure in place.Bundled fee structures are more likely to raise questionsabout conflicts of interest; the incentive of a fiduciarymanager can move from finding the best investmentmanager to the cheapest investment manager. Alternatively,any investment manager fee savings negotiated may notpass through to clients.There is, however, variation in the details, including thebenchmark over which a performance is paid, and thequantum of the performance fee itself. The range of the “feeat risk” under a performance fee structure varies from around10% to 65%.A performance fee can create volatility of fees. Proponentsof performance argue that such fees would align theinterests of investors with those of clients; the extent towhich is true is down to the details of the construction of theoverall fee.Fee structures can have a material impact on incentives andit is important to understand these and ensure alignment ofinterests between the fiduciary manager and the trustees.2017 Fiduciary management fees survey
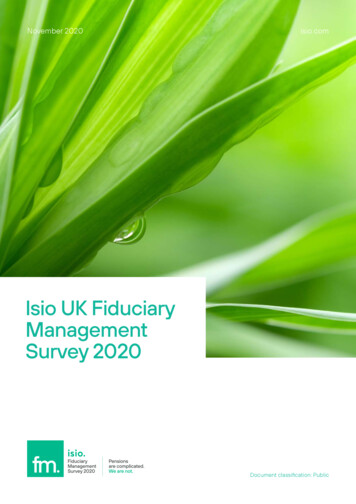
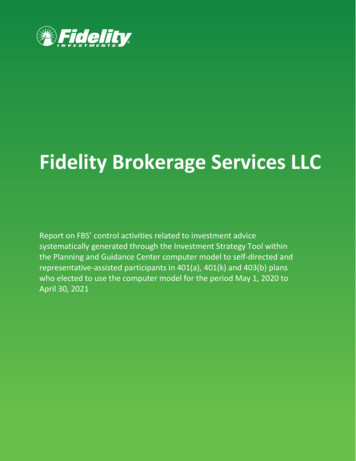
FM feesIM feesInvestment management feesExpensesInvestment management feesThe absolute level of fees is a function of the asset classes that are invested in, and the ability of a fiduciary manager tonegotiate fees with underlying investment managers. To a large extent, the underlying investment manager fees are the samefor all clients of a fiduciary manager. This is consistent with the rationale that a fiduciary manager should be able to use its scaleto negotiate underlying investment manager fees across its entire client base.However, our survey results show there is a wide range of underlying investment management fees. For some asset classes,such as actively managed equities, there can be heterogeneity in investment managers’ approaches resulting in a variation offees however, the dispersion of fees for passively managed equities, which would be expected to be more homogeneous, issurprising.Figure 3 – Distribution of investment management fees for equities and LDI for a 250m schemeGlobal equities(activelymanaged)Global equities(passivelymanaged)LDI portfolios0.0%0.2%0.4%0.6%0.8%1.0%1.2%1.4%EY Insight:The wide range of underlying investment management fees emphasises the importance to consider all elements of fees whenconsidering a fiduciary management mandate. The differential in investment management fees between providers can make asignificant impact on a pension scheme’s outcomes.2017 Fiduciary management fees survey
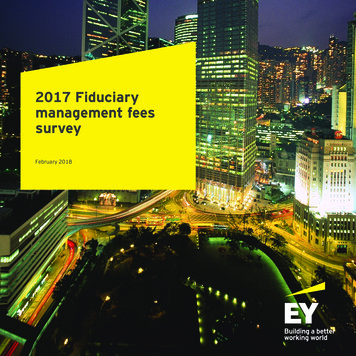
FM feesIM feesTotal feesExpensesFiduciary management fees plus investment management feesOur view is that it is important to consider the total costs when evaluating a fiduciary management fee proposal. This year’ssurvey shows that the total of fiduciary management and investment management fees has continued to fall as the industry hasgrown, although we recognise there is a change in the methodology for the 2017 survey.Figure 4 – Median of fiduciary management fees plus investment management % 50m 250m2013 750m2015 1.5bn2017Figure 5 – FM fees as a proportion of total costs for a 250m schemeEY Insight:A lower fiduciary management fee can be perceived torepresent “better” value for money. As can be seen from thechart on the left, the proportion of total costs representedby the fiduciary management fee ranges from around 11% to70%, so trustees may not appreciate more material costs ifthe focus is on fiduciary management fees alone. 250m0.0%20.0%40.0%60.0%80.0%It is important therefore to consider value from a range ofdifferent perspectives before concluding whether a given feestructure is attractive or not.2017 Fiduciary management fees survey
FM feesIM feesExpensesExpensesThe final component of costs within an investment mandate is expenses; expenses incurred by the fiduciary manager, as well asexpenses incurred by the underlying investment managers are all ultimately paid by the investor.Expenses are often overlooked when evaluating providers’ fee arrangements, sometimes due to less transparency, but oftensimply ignored. We believe investors should look at total costs, and hence aim to identify all fees and expenses which would beincurred as part of the mandate. There are various explicit and implicit expenses which ought to be considered as part of thistotal fee, including: Custody fees Fiduciary manager pooled fund expenses Administration fees Investment manager pooled fund expenses Performance measurement fees Transition management fees Fees for legal reviews of documentationThe chart below shows the distribution of the sum of fiduciary management fees, investment management fees and expenses.Figure 6 – Distribution of total fees including expenses1.4%1.2%1.0%0.8%0.6%0.4%0.2%0.0% 50m 250m 750m 1.5bnEY Insight:This year’s survey shows that schemes could incur as much as 0.2% pa in expenses in addition to FM and IM fees. Expenses cancreate a non-trivial drag on returns, and therefore should be considered as part of the evaluation of a fee proposal.2017 Fiduciary management fees survey
How EY can help youThis survey focuses on the fees and expenses for a fiduciary management mandate, which we believe can provide usefulbenchmarking for trustees and sponsors considering fiduciary management. However, it is important for pension schemes toassess the fees and costs in relation to the value that a fiduciary management mandate can offer their own scheme, particularlyaround management of investment and operational risks, and the resulting impact on risk and return.EY provides a wide range of investment governance services, including evaluation of Schemes’ current governance structures,and assisting with the selection and oversight of fiduciary managers.For further information, please visit our website, or contact one of the EY LLP team.www.ey.com/fiduciarymanagementIain BrownRikhav ShahPartner, Ernst & Young LLPSenior Manager, Ernst & Young LLPMatthew MignaultChristopher PowellDirector, Ernst & Young LLPManager, Ernst & Young LLP2017 Fiduciary management fees survey
Appendix: How to read a box plotWe have used several box plots throughout this document to illustrate the spread of survey responses. In particular, the boxplots show at a glance the range of the middle 50% of responses. The example below explains how to interpret the graphs.Example – Fiduciary management fees0.5%0.5%This is the maximum valueobserved0.4%The highest 25% of values areabove 0.29% pa0.4%0.3%This line represents the75th percentile and islabelled ‘Q3’Q3 0.29%0.3%0.2%0.2%0.1%0.1%Median 0.21%This line represents themedian, i.e., the 50thpercentileThis line represents the25th percentile and islabelled ‘Q1’Q1 0.14%The lowest 25% of values arebelow 0.14% paThis is the minimum valueobserved0.0%This is the size of thehypothetical pensionschemeThe middle 50% of values arebetween 0.14% pa and 0.29% pa,i.e., between Q1 and Q3 250mMedium 250m(n 18)2017 Fiduciary management fees survey
EY Assurance Tax Transactions AdvisoryAbout EYEY is a global leader in assurance, tax, transaction and advisoryservices. The insights and quality services we deliver help build trustand confidence in the capital markets and in economies the worldover. We develop outstanding leaders who team to deliver on ourpromises to all of our stakeholders. In so doing, we play a critical rolein building a better working world for our people, for our clients andfor our communities.EY refers to the global organization, and may refer to one or more, ofthe member firms of Ernst & Young Global Limited, each of which is aseparate legal entity. Ernst & Young Global Limited, a UK companylimited by guarantee, does not provide services to clients. For moreinformation about our organization, please visit ey.com.Ernst & Young LLPThe UK firm Ernst & Young LLP is a limited liability partnership registered in England andWales with registered number OC300001 and is a member firm of Ernst & Young GlobalLimited.Ernst & Young LLP, 1 More London Place, London, SE1 2AF. 2018 Ernst & Young LLP. Published in the UK.All Rights Reserved.ED NoneEYG no. 00611-184GblEY-000054472-01 (UK) 02/18. CSG London.In line with EY’s commitment to minimise its impact on the environment, thisdocument has been printed on paper with a high recycled content.Information in this publication is intended to provide only a general outline of the subjectscovered. It should neither be regarded as comprehensive nor sufficient for making decisions,nor should it be used in place of professional advice. Ernst & Young LLP accepts noresponsibility for any loss arising from any action taken or not taken by anyone using thismaterial.ey.com/uk
LGIM Russell Investments Willis Towers Watson . . As in our previous surveys, the 2017 results show that fees reduce as scheme assets under management increase. This is a . There are divided opinions on compensation of fiduciary managers based on performance. A number of fiduciary