Transcription
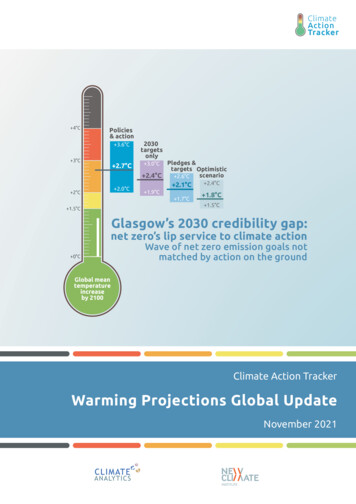
P4.2AN OPERATIONAL ASSESSMENT OF THE MODIS FALSE COLOR COMPOSITE WITH THEGREAT FALLS, MONTANA NATIONAL WEATHER SERVICEGina Loss1, David Bernhardt1, Kevin K. Fuell2, Geoffrey T. Stano31NOAA/NWS, Great Falls, MontanaUniversity of Alabama in Huntsville, Huntsville, Alabama3NASA/ENSCO, Inc., Huntsville, Alabama2ABSTRACTThe close and productive collaboration between theNational Weather Service (NWS) Weather ForecastOffice (WFO) in Great Falls, MT and the Short TermPrediction and Research Transition (SPoRT) Center atNASA/Marshall Space Flight Center has presented anopportunity for science and technology sharing. SPoRThas provided a false color composite product derivedfrom Moderate Resolution Imaging Spectroradiometer(MODIS) data, part of NASA’s Earth Observing System.This product is designed to distinguish snow and icecovered ground from bare ground and clouds.The Great Falls WFO has been a test bed of the MODISfalse color composite as an operational tool to monitorthe development and dissipation of snow cover.Preliminary applications have shown the product can beused to monitor snow cover in remote locations as wellas river and lake ice. This information leads to improvedassessments of flooding potential during post snowevent conditions where rapid melting and runoff areanticipated. Deriving similar products from futuregeostationary satellites may contribute to the NWSmission by enhancing situational awareness.The operational use of this product was transitioned tothe Great Falls WFO through a process of rologist, and post event analyses. An assessmentperiod from January to March 2008 was initiated toinvestigate the impact of the false color product on WFOGreat Falls’ operations. This paper will emphasize theimpact the false color product has in the WFO’shydrologic situational awareness and how thisinformation can be used to influence operationaldecisions.*Corresponding author address: Gina Loss, NationalWeather Service, 5324 Tri-Hill Frontage RdGreat Falls, MT 59404-4933; email:Gina.Loss@noaa.gov1.INTRODUCTIONThe National Weather Service Weather Forecast Officein Great Falls, Montana (TFX) has partnered withscientists from NASA’s Marshall Space Flight Center(MSFC) in Huntsville, Alabama. A small group ofscientists from NASA have formed the Short-termPrediction Research and Transition Center. SPoRTseeks to accelerate the infusion of NASA earth scienceobservations, data assimilation and modeling researchinto NWS forecast operations and decision-making(Goodman et al., 2004).The TFX location provides a unique opportunity forusing NASA’s polar orbiting instruments. The area ofinterest for TFX lies at about 47 N, a relatively highlatitude for the application of Geostationary OperationalEnvironmental Satellite (GOES) imagery. The weaknessis that the footprint of the GOES measurement isoblique and appreciably larger in the north-southdirection at higher latitudes than those directly under thesatellite at the equator. The problem is compounded bythe fact that the TFX area of interest is 25-35 longitudeaway from the center of both the GOES East and Westsatellites. Again, the result is a larger footprint, but thistime in the east-west direction. As a result, small scalefeatures are “blurred” to some degree once remapped tothe users display system; the increased area of thesatellite footprint is forced into a more appropriatelyproportioned map. The polar-orbiting instruments onNASA’s Earth Observing System (EOS) satellitesprovide a higher resolution image and a truer footprintthan current GOES satellites. In undertaking thisassessment, TFX and SPoRT began to research howEOS data may be utilized to better monitor the smallscale changes in snow and ice cover at high latitudesthat fall between the GOES satellites.The collaboration between NASA atmospheric scientistsand NWS meteorologists has provided forecastersseveral unique datasets to use during forecast andwarning operations (Darden et. al., 2002). The MODISfalse color composite is one of these unique data sets.The MODIS false color composite was first introduced tothe Great Falls WFO in 2004 and added to previousefforts by TFX to use remote sensing information as inMiller (2003). False color composite imagery has found
wide use among the forestry and fire weathercommunity in showing the extent of burn areas. Therural nature and low population density of Montanacreate similar difficulties in evaluating the breadth andretreat of snowfall and river ice. Remote sensingprovides the best opportunity to accurately and routinelydetermine the extent and transition of snow cover andriver ice in remote areas. However, using visibleimagery, it is often difficult to differentiate snow fromclouds. TFX has been evaluating the use of the MODISfalse color composite to monitor the development anddissipation of snow cover and river ice. The false colorcomposite has led to improved assessments of floodingpotential in Montana, particularly during post eventconditions where rapid melting and runoff areanticipated.2.BACKGROUNDThe MODIS false color product combines, or“composites”, one visible channel with two shortwaveinfrared channels to highlight features with infraredsignatures. This particular false color composite hasbeen developed to distinguish between snow andclouds, both of which appear white in standard visibleimagery. While snow may look like clouds in visibleimagery (i.e. what our eyes see), snow radiatesdifferently than clouds in other portions of the spectrum.Spectrally, snow is different from clouds at wavelengthsgreater than 1.4 µm (Figure 1). MODIS channels at 1.63and 2.13 µm can therefore be used to distinguishbetween snow and cloud cover. To make this distinctionmore obvious, a visible channel combined with the 1.63and 2.13 µm channels is used to produce the “falsecolor” image. The MODIS imagery is further enhancedusing a contrast stretch which redistributes the greyvalues of the image improving the image contrast andassuring a good color differentiation between variousfeatures of interest (CCRS, 2005).Figure 2 provides an example of the false colorcomposite (Figure 2.1) compared to standard visibleimagery (Figure 2.2) and a natural color composite(Figure 2.3). The false color image combines MODISdata such that features with large reflectance in thevisible, 1.63µm, and 2.13µm channels take on colorcharacteristics corresponding to red, green, and blue,respectively. Green indicates clear skies and no snowcover, white indicates water clouds, while pink indicatesclouds with ice. Finally, red indicates snow cover anddark red to brown indicates snow in forested areas.While cloud movement in standard visible imageryanimations does allow some distinction between snowcover and clouds, the false color product enhances thedistinction between snow and clouds in a single image.3.UTILITY IN FORECAST DECISION MAKINGWhile the MODIS false color imagery is used primarily inthe initial steps of the decision making process, it hasvalue throughout the forecast process.It oftencomplements the traditional products and methods formonitoring the change in snow and ice cover as in Halland Riggs (2007). For example, a conventional methodto differentiate clouds from snow cover is to animate theGOES visible imagery and compare the stationary whiteareas of snow to the moving white clouds.The MODIS false color imagery is produced by polarorbiting satellites at a 500 meter resolution. Thisprovides greater clarity than the 4 km GOES visibleimagery even though only 1 or 2 images are availableper day.The clarity of the MODIS false color imagery has helpedthe TFX WFO decrease the dependency on pointobservations of snow cover and significantly lessen theneed to use additional human resources to survey rurallocations during large snowfall events. This conforms toan NWS regional goal to increase personnel safety bydecreasing travel during potentially dangerous weathersituations. Further, there is a reduced need toindividually contact cooperative observers and weatherspotters via phone requesting additional snow coverinformation. Essentially, TFX has found the MODISfalse color imagery to be a convenient product thatsaves time and human resources.The greatest value of the product for TFX has been toevaluate the extent and change of snow cover. Thisprocess allows forecasters to assess the potential forlocal flooding due to rapid melting or ice jams. Inaddition to the conventional use of visible imagery, thereare various observation networks (cooperativeobservers, Snowpack Telemetry (SNOTEL), stateDepartment of Natural Resources and Conservation(DNRC), etc.) that provide snow depth and/oraccumulation observations. However, these are pointobservations that require some assumptions in order todevelop a 2-dimensional spatial analysis of snow cover.Often, human observers are called upon to makemeasurements of snow depth and snow waterequivalent. At times NWS personnel may go to ruralareas to survey snow cover extent. The MODIS falsecolor image eliminates some of the previouslynecessary assumptions and better fills data void areaswhile providing information on features not well capturedby lower resolution remote sensing instruments.To determine flooding potential from snowmelt, TFXuses the MODIS false color imagery by looking forsignificant changes in snow cover. The forecastersmonitor the change in extent of the red (snow cover)regions in the false color product.An improvedawareness of the flooding potential is achieved bycombining the MODIS false color imagery with snowdepth and snow water equivalent information fromSNOTEL sites and modeled products from the NOHRSC) (Figure 3.1).The high resolution of the MODIS false color imageryhas improved the ability of TFX forecasters to identifychanges in snow cover over short periods of time.Previously, localized flooding of small basins was
difficult to identify in a timely manner with lowerresolution products from GOES and NOHRSC. Whenhigh values of snow water equivalent are indicated inthe same area as large snow cover changes, TFX willexamine specific stream gages for changes in flow orwater level. TFX is able to more quickly inform stateand local emergency management officials and can bemore specific in its forecast area of concern by using thefalse color imagery throughout the decision makingprocess.Snow accumulations over the Great Plains and intermountain west can be large and remain on the groundfor extended periods of time. Conversely, the snowcover may melt in a matter of days with Chinook windevents. The MODIS false color imagery is usefulthroughout the winter season due to the cyclical natureof freeze/thaw events over eastern Montana.In 2004 a large snow event affected northeast Montana(Figure 3.2). Modeling and forecasts of the snowmeltsuggested potential flooding along the Milk, Poplar andMissouri Rivers and adjacent tributaries. The false colorimages over the course of the following month show agradual melting of the snow, first occurring to the southof the Missouri and Milk Rivers and then later north ofthe rivers (Figure 3.3). Observing this gradual trendindicated that the predicted flooding would be less thananticipated. Additional information on this event isavailable in Adolphson et al. (2005).4.JANUARY – MARCH, 2008 EVALUATIONDuring the late winter and early spring of 2008, TFXprovided detailed assessments of the MODIS false colorimagery product for monitoring changes in snow coveras it relates to potential flooding. Specifically, twoevents occurred; one from 13 February – 2 March andthe second from 4 – 12 March. A significant snow eventon 13 February covered much of Montana east of theContinental Divide. The snowfall accumulations variedfrom 2 to 5 inches. A clear view from MODIS on 14February shows the full spatial extent of snow cover(Figure 4.1). The primary concern was the predictedonset of warmer temperatures. This warm-up wouldmelt the recent snow, sending the water into icecovered streams resulting in potential flooding.Cloud cover is the major limiting factor of the MODISimagery; however, TFX was still able to glean valuableinformation. Despite the limited clear skies for severaldays, a noticeable, small-scale area of melting hadoccurred east of the Rocky Mountain Front by 16February (Figure 4.2) between Cut Bank and GreatFalls, a rural area with few snow depth observations.MODIS imagery showed that fresh snow fell in thissame area the next day (Figure 4.3). The mesoscalespatial detail of snow cover provided valuableinformation, allowing the hydrologist to assess how thearea of melting and subsequent replenishment of snowmay add to stream and river water levels. By 19February (Figure 4.4) a nearly complete view ofMontana showed that melting had mostly occurred incentral Montana and adjacent to the Rocky MountainFront. Cooler temperatures in eastern Montana resultedin a slower melting of snow cover in that area. Theability to observe the snow cover retreat decreased theconcern for flooding of ice-covered streams and resultedin only a mention of possible ice jamming on smallerstreams in the Hazardous Weather Outlook productissued by TFX rather than the issuance of any floodwatches or warnings. In addition, the false colorimagery clearly showed that Canyon Ferry Reservoir incentral Montana and Fort Peck Reservoir in easternMontana remained ice-covered, decreasing the concernfor ice jams in these and surrounding areas. It wouldtake nearly 2 weeks more (2 March, Figure 4.5) beforethe remaining snow cover in eastern Montana melted.During this time, stream flows showed no significantchange, as was expected given the slow change insnow cover observed in the false color imagery. Further,the imagery indicated reservoirs were only slowlyshowing signs of thermal ice rotting.The second event began on 4 March with snow falling ina wide area of central and southeastern Montana, butsnow water equivalent amounts were 0.10 inches orless. This posed little concern based on TFX’s pastexperiences of rapid melting with such events.However, the false color imagery suggested that the iceon the reservoirs and rivers was beginning toexperience thermal rotting (Figure 4.6). To confirm this,TFX used the MODIS natural color composite to look forwhite areas of ice on the water surfaces. From 8 – 10March the natural color imagery confirmed that ice stillexisted, but by 12 March a reduction in the ice wasevident. At the same time the elevated valleys insouthwest Montana, as well as the southern slopes inthe mountainous regions, had decreasing snow coverobserved in the false color imagery (Figure 4.7). TFXnoted that some indications of ice movement onnorthern rivers and tributaries could be seen. However,this did not become a large concern as coldtemperatures remained for several more weeks,preventing any rapid or early melting of snow and riverice.5.SUMMARYThe MODIS false color composite, provided to the GreatFalls, MT WFO by the SPoRT Center has enhanced thesituational awareness capabilities of the forecasters.The MODIS false color composite takes advantage ofthe different emission wavelengths of snow and cloudcover creating a product that clearly identifies snowcover in red, while clouds remain white. This cleardifference, combined with a resolution of 500 mprovides the Great Falls WFO forecasters a vital tool inmonitoring the spatial extent of snow cover as well asice cover in rivers and reservoirs.The MODIS false color composite can be limited bycloud cover obscuring surface features and does notprovide a predictive element of how snow cover will
change. Additionally, while the product shows the extentof the snow cover, it does not provide any informationon the water equivalent of the snow. The imagery’s truevalue is providing forecasters with information in ruraland remote regions, at better resolution than currenttools, thereby reducing manpower needs and improvingthe efficiency of the forecast process. All these featuresallow the forecasters to monitor the changes in snowand ice cover extent that lead to improved forecasts offlooding potential from snowmelt. Further, observationsusing the MODIS false color composite imagery canimprove forecast confidence in reducing the threat offlooding if the snowmelt is observed to be gradual.6.REFERENCESFigure 1. Typical reflectance for naturally occurringfeatures.Adolphson, J., C. Bogel, T. Fransen, G. Forrester, T.Jamba, M. Rawles, T. Salem, D. Secora, B. Temeyer,G. Loss, T. Gurss, and M. Tunnicliff, 2005: Minorflooding on the Milk River after an extreme winter innortheast Montana. 19th Conf. Hydrology, San Diego,CA, Amer. Met. Soc. P4.3.CCRS, 2005: Glossary of remote sensing terms.Retrieved 17 Dec 2008 fromhttp://www.ccrs.nrcan.gc.ca/glossary/index e.php?id 96Darden, C., B. Carroll, S. Goodman, G. Jedlovec, B.Lapenta, 2002: Bridging the gap between research andoperations in the National Weather eteorologicalcommunity.NOAATechnicalMemorandum, PB2003-100700, NWS Southern Region,Fort Worth, TX.Figure 2.1. Example of the MODIS false color image.Reds indicate snow on the ground, white indicates cloudcover, and greens indicate clear ground.Goodman, S. J., W. M. Lapenta, G. J. Jedlovec, J. C.Dodge, and J. T. Bradshaw, 2004: The NASA Shortterm Prediction Research and Transition (SPoRT)Center: A collaborative model for accelerating researchinto operations. 20th Conf. on Interactive ProcessingSystems (IIPS) for Meteorology, Oceanography, andHydrology, Seattle, WA, Amer. Met. Soc., P1.34.Hall, D. K., and G. A. Riggs, 2007: Accuracyassessment of the MODIS snow products. Hydrol.Process., 21, 1534-1547.Jedlovec, G. J., and P. J. Meyer, 2005: MODIScomposite imagery for snow detection – trainingmodule. r, S., 2003: High / low cloud and snow discriminator– Focus tutorial. NRL Monterey, Marine MeteorologyDivision. http://nrlmry.navy.mil/sat training/high low cloud/modis.html.Figure 2.2. MODIS visible image corresponding to thesame view shown in Figure 2.1.
Figure 2.3. MODIS natural color composite image thatshows colors as they would appear to the human eyecorresponding to the same time in Figures 2.1 and 2.2.Figure 3.1. February 19, 2004 – NOHRSC ModeledSnow Water Equivalent.Figure 3.2. MODIS false color composite for Montanaon February 19, 2004. The main item of interest is thelarge amount of snow cover in northeast and easternMontana.Figure 3.3. Same as Figure 3.2, but taken on March 25,2004 after most of the snowmelt.Figure 4.1. MODIS false color composite showingwidespread snow cover across Montana for the eventbeginning on February 14, 2008.Figure 4.2. Same as Figure 4.1, but for February 16,2008.
Figure 4.3. Same as Figure 4.1, but for February 17,2008.Figure 4.6. A second event began on March 4, 2008.Snowfall was light, but ice was built up on the rivers andreservoirs. By March 8, 2008, shown here, the ice wasbeginning to clear.Figure 4.4. Same as Figure 4.1, but for February 19,2008 as snow cover begins to melt.Figure 4.7. Same as Figure 4.6, but for March 12, 2008.Snow cover in eastern Montana has melted and thewaterways showed ice movement, but nothingsignificant.Figure 4.5. Same as Figure 4.1, but for March 2, 2008.Remaining snow cover has nearly all melted at thispoint.
P4.2 AN OPERATIONAL ASSESSMENT OF THE MODIS FALSE COLOR COMPOSITE WITH THE GREAT FALLS, MONTANA NATIONAL WEATHER SERVICE Gina Loss1, David Bernhardt1, Kevin K. Fuell2, Geoffrey T. Stano3 1NOAA/NWS, Great Falls, Montana 2University of Alabama in Huntsville, Huntsville, Alabama 3NASA/ENSCO, Inc., Huntsville, Alabama ABSTRACT