Transcription
Donald Trump and the Lie[This version: October 8, 2021]Kevin Arceneaux† & Rory Truex‡AbstractThe legitimacy of democratically elected governments rests in part on widespreadacceptance of the outcome of elections, especially among those who lost. This“losers’ consent” allows the winners to govern and, when the incumbent is thelosing party, it allows for a peaceful transition of power. What happens in ademocratic system when one side not only refuses to concede, but actively perpetuates lies about the outcome? This paper studies the consequences of a Donald Trump’s “big lie” using a daily tracking survey, yielding 40-days of polls andover 20,000 responses from American voters. We find that the lie is pervasive andsticky– the number of Republicans and independents saying that they believe theelection was fraudulent is substantial, and this proportion did not change appreciably over time or shift after important political developments. In reaction tothe lie, and the threat it brought to the transition of power, there was a significant rise in support for violent political activism among Democrats, which onlywaned after the insurrection of January 6th. Even if these findings merely reflectexpressive responding, we nonetheless find significant and potentially long-termconsequences to the lie. A conjoint experiment shows that Republican votersreward politicians that perpetuate the lie, giving Republican candidates an incentive to continue to do so in the next electoral cycle.Keywords: 2020 US Presidential Election Democratic Legitimacy WinnersLosers Gap Losers’ Consent†Professor of Political Science, Center for Political Research (CEVIPOF), Sciences Po.kevin.arceneaux@sciencespo.fr‡Assistant Professor of Politics and International Affairs, Princeton University.rtruex@princeton.edu. Assistant Professor of Politics and International Affairs, PrincetonUniversity. rtruex@princeton.edu. Our gratitude goes to the University Center for HumanValues and Data Driven Social Science Initiative at Princeton University for funding support. Additional financial support was provided by Temple University. We are grateful forhelpful feedback from David Broockman, Nathan Kalmoe, Yphtach Lelkes, Tali Mendelberg,and Markus Prior.
1The legitimacy of democratically elected governments rests in part on widespread acceptance of the outcome of elections, especially among those who lost. This “losers’ consent”allows the winners to govern and, when the incumbent is the losing party, it allows for apeaceful transition of power (Anderson et al., 2005). Evidence from “consolidating” democracies shows that when politicians and their supporters refuse to accept defeat, it decreasessupport for the political system and increases the likelihood of attempts to overthrow the government through violent means (Przeworski, 1991, 2005). Consequently, the willingness forincumbent politicians to accept defeat is a crucial test for democratic stability (Huntington,1991).Politicians and voters alike do not like to be on the losing side (Anderson et al., 2005;Sances and Stewart, 2015). Voters are sometimes willing to indulge a form of outcome biasin which they judge the integrity of an election based on whether their party’s candidate wonor lost (Baron and Hershey, 1988; Cantú and Garcı́a-Ponce, 2015). As a result, the losingcandidate of an election has an incentive to assert that fraud and irregularities explain theoutcome, rather than conceding that a plurality or majority of voters have rejected him orher. In countries with weak commitments to democracy, it is not uncommon for incumbentsto make dubious charges of fraud when elections do not turn out as they wanted (Schedler,2001), and their supporters often believe them (Cantú and Garcı́a-Ponce, 2015). Our point ofdeparture is to consider these dynamics in the United States, one of the world’s long-standing“consolidated” democracies.4The goal of this paper is to study how lies shape voters’ perceptions about electionintegrity, support for violence, and ultimately, democratic stability. Most of our knowledge4While there is no widespread agreement on when a democratic system becomes “consolidated” and whether this is even a necessary condition for democratic stability (Schedler,2001), this concept is nonetheless often invoked as an indicator of democratic stability. The“two-turnover-test” holds that democracy is more or less established after two uncontroversial alternations in power among political parties (Moehler and Lindberg, 2009). Underthis definition, the United States should certainly be considered a consolidated democracyin advance of the 2020 election.
2about lies and politics comes from the study of authoritarian countries. In these systems,citizens are obligated to live “within the lie” and behave “as if” they believe (Havel, 2018;Wedeen, 2015). Many come to internalize those lies, though some do not, and it is difficultto discern who really believes what (Kuran, 1991; Shen and Truex, 2020). Dictators createan atmosphere in which their regime is continually portrayed as powerful, infallible, and theonly viable option (Huang, 2015). Authoritarian regimes often propagate so-called “big lies,”those that are so grand that people believe no one would have the gall to make them up.It is unclear whether such an approach would be effective in a liberal democratic systemlike the United States. On the one hand, the presence of robust political competition and afree press often works to limit the ability of politicians to manipulate public opinion (Chongand Druckman, 2007; Zaller, 1992). A cornerstone assumption in American free speechjurisprudence is that in a “marketplace of ideas,” truth wins out over falsehood (Brazeal,2011). On the other, as partisan polarization transmogrifies into partisan sectarianism in theUnited States, it provides fertile ground for lies pedaled by politicians to take root and gounchecked by their partisans (Finkel et al., 2020; Druckman, Peterson and Slothuus, 2013;Van Bavel and Pereira, 2018).The 2020 presidential election offers an unparalleled opportunity to study whether a “biglie” spread by mainstream political actors can shape public perceptions in an establisheddemocracy. The ritual of losing gracefully is a hallmark of stable, consolidated democracies,including the United States. Breaking with long-held tradition, former President Donald J.Trump refused to accept that he had lost the election to Joe Biden. Even after the courtsrejected over 60 lawsuits filed by his campaign, he continued to repeat debunked conspiracytheories about how the election had been stolen from him. In a shocking turn of events, amob of Trump’s supporters laid siege to the Capitol building while Congress members metto officially certify the election for Biden. Their rampage interrupted the proceedings andended with the deaths of a police officer and several rioters. Although a transfer of powerto President Biden eventually happened as constitutionally prescribed, it did so under heavy
3guard from soldiers. Not long ago, this set of events happening in the United States wouldhave been unthinkable (Almond and Verba, 1963).In order to shed light on the dynamics of public opinion before and after the 2020 presidential election, we instituted the Election Legitimacy Tracking Survey (ELTS), a nationallydescriptive online survey implemented by an established survey research firm, Qualtrics panels, between October 27, 2020 and January 29, 2021 (n 20, 000). We conducted dailysurveys of 500 respondents for a month around the election and then biweekly surveys untilnine days after President Biden was inaugurated. This rolling cross section design allows usto see how public opinion about the election unfolded in real time. The project is unusualin that we did not know what the primary “treatment” (the election outcome) would be inadvance, only that the election itself would likely feature some degree of contestation afterthe fact. We put the survey in the field in October knowing that the 2020 election would becritical for the future of American democracy, and our goal was to set up a data collectionprocess to document trends in public opinion as richly as possible.Four key findings emerge from the data. First, we find that a non-trivial number ofAmericans, particularly those who identify as Republican, say that they accept the lie thatDonald Trump was the rightful victor of the 2020 election. Roughly one in four Americanssay that they do not believe the election result was legitimate or identify Joe Biden as thewinner. For Republicans, these proportions hover around 50%. Acceptance of the electionoutcome is lowest for Americans who are older, less educated, and of lower social status.While there has been a “winners-losers gap” in confidence regarding the vote count inAmerican elections at least since 2000, the majority of voters on the losing side still said thatthey were “very confident” that the vote count was accurate (Alvarez, Hall and Llewellyn,2008; Sances and Stewart, 2015; Sinclair, Smith and Tucker, 2018). The 2000 election offersanother benchmark since its outcome was legitimately in doubt. Despite the acrimony overcounting ballots, after George W. Bush was declared the winner and Al Gore conceded theelection, only 18% of Americans said they believed Bush stole the election (Carroll, 2001).
4It is possible this result reflects some degree of “expressive responding,” wherein many ofTrump’s supporters do not really believe the lie but said that they did on our survey asa way to signal their support (Schaffner and Luks, 2018). Even if this were the case, theperpetuation of the lie could still shape how Republican elites behave. We return to thispoint below.Second, we observe that the lie is “sticky”– acceptance of the election outcome did notchange appreciably over time or move significantly in response to the many dramatic politicalevents that unfolded after the election. Attitudes towards the election in late January wereroughly the same as they were in mid-November.In some of the survey waves, we showed respondents that denied the Biden victory a seriesquestions of the form, “Would you believe Biden won if.” followed by different hypotheticalscenarios. Of the voters that denied the outcome, only 28.7% said they would believe Bidenwon if Republican leaders like Mitch McConnell were to say that Biden won more votes.About 31.0% would believe Biden won if the Electoral College were to award him a majorityof votes, and 42.9% would believe Biden won if there were a Supreme Court decision tothat effect. But as those events actually unfolded, we did not observe equivalent increases inacceptance of the election.Third, in line with evidence from less consolidated democracies (Przeworski, 1991, 2005),we find circumstantial evidence that perpetuating the lie that the election was stolen increasedmany Americans’ expressed willingness to engage in violent activism aimed at attacking thestate. This pattern was most prominent for Democrats, whose willingness to accept violencepeaked in early December, when Trump was perhaps most brazen in his attempts to thwartthe Electoral College vote. The insurrection of January 6th dampened support for violenceamong Democrats and nonpartisan voters, though levels remained higher than prior to thepre-election baseline.Fourth, we find evidence that the lie has the potential to shape the Republican partyand American politics for years to come. Starting in January 2021, we began including a
5simple paired conjoint design in the survey (Hainmueller, Hopkins and Yamamoto, 2014;Hainmueller, Hangartner and Yamamoto, 2015; Teele, Kalla and Rosenbluth, 2018), presenting Republican voters with hypothetical primary candidates for an upcoming congressionalrace. We find that candidates who maintain Donald Trump won the 2020 election have adistinct electoral advantage, about 6 percentage points, versus candidates that do not. Basedon these findings, we expect many Republican candidates will have an incentive to perpetuatethe lie in the next election cycle, or at the very least, refuse to refute it.Even though the United States is the focus of our analysis, our findings have implicationsfor other established democracies. Many democracies are experiencing an increase in polarization and the loosening of universal commitment to democratic norms (Przeworski, 2019).We do not believe that the United States is exceptional with respect to the possibility thata major political party or actor could profitably forward “big lies.” Our findings also offeradditional support to the theoretical position that culture alone cannot sustain democraticnorms (Dahl, 1989; Przeworski, 2005). Even established democracies are fragile, and thestrategic decisions made by elites can have potentially dire consequences.DataThe Election Legitimacy Tracking Survey (ELTS) was conducted online through the Qualtricssurvey platform, an established and respected online survey research firm that recruits participants and verifies their names, addresses, and dates of birth, before inviting them to jointheir sampling panel. It incentives participation in surveys by compensating respondentswith money or money-equivalents (e.g., Amazon points), and it conducts validity checks ofresponses to produce a high-quality sample. Importantly, the data quality and representativeness of Qualtrics samples have been independently verified by scholars to be in line withprobability samples like the General Social Survey and the American National Election Studies (Boas, Christenson and Glick, 2020). We restricted the population to American citizens
6that are registered to vote.5The project employs a rolling cross-section design. We received a sample of 500 newrespondents every day beginning October 27th, 2020 through November 20th, 2020. AfterNovember 20th we switched to collecting samples on Tuesday and Friday of each week,with some pauses in the data collection for holidays. In total we collected 20,000 responsesover 40 daily samples through January 29th, 2021. For each daily sample, we calculatedpoststratification weights to align the sample with known characteristics of the population.Our weighting scheme was implemented using entropy balancing and included informationon gender, age, race, partisanship, education, and region (Hainmueller, 2012). This processresulted in weighted daily samples that all had the same composition on these five coredemographic characteristics and also matched the composition of the American electorate.The Supporting Information contains more discussion of the sample recruitment processand how it compares to relevant population statistics. Figures SI1 and SI2 in the SupportingInformation show the composition of the sample over time for demographic covariates of interest. We see stability in the sample composition over time, with some small differences fromday to day due to sampling variability. The sample matches the population of registered voters with respect to turnout, gender, and partisanship, but skews younger and more educatedthan the population. Black voters are slightly over-represented. Departures like these arecommon in survey research, and the poststratification weights result in daily samples that aretied to population proportion, weighting respondents from underrepresented groups slightlymore heavily. The core substantive findings of the paper are not sensitive to this weightingdecision. The core questionnaire was kept largely the same throughout the project. Respondents first answered standard demographic questions and provided information on theirpartisan affiliations and voting history. The next module included questions on the legitimacyof the election. The remainder of the survey included several standard question batteries to5To ensure some balance in the data, we instituted two quotas in the collection process ongender and partisanship.
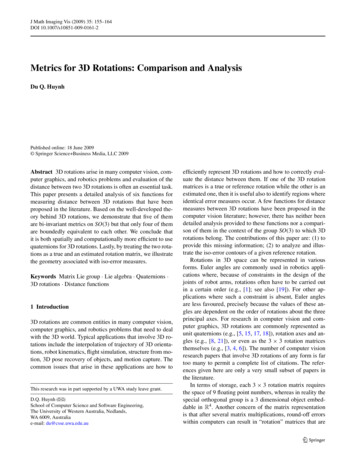
7measure support for political violence (Moskalenko and McCauley, 2009); the need for chaos(Petersen, Osmundsen and Arceneaux, 2018); anxiety and depression (Zigmond and Snaith,1983); self-esteem (Schmitt and Allik, 2005); and support for democratic norms (Inglehart,2003). These batteries were presented in random order and the question order was also randomized within each battery. The final module was a short Word Association Test that askedrespondents the first words that come to mind for several cues, including Donald Trump andJoe Biden. The wordings for key questions used in this paper are included in the SupportingInformationResultsPerceptions of LegitimacyFigure 1 shows perceptions of the election outcome over time. The top panel shows theproportion of registered voters that identified Biden as the winner of the 2020 presidentialelection, and the bottom panel shows the proportion that viewed the election as legitimate.These proportions have stayed relatively fixed over time. Only three out of four registeredAmerican voters believe Joe Biden legitimately won the election. For reference, we also notethe major events that occurred throughout the post-election period.Not surprisingly, there is a sharp partisan divergence in perceptions of the election. Figure 2 presents the same outcomes as Figure 1, this time breaking out the results by partyidentification. Shortly after the initial election results came in on the evening of November 3rd, most Democrats identified Joe Biden as the winner and perceived the outcome aslegitimate. This proportion rose to close to 100% after the election results were called bymost media outlets on November 7th. Republican voters as a group increasingly identifiedBiden as the winner as the results came in, but this proportion plateaued at around 40% andremained relatively stable even after the results became certified by the Electoral College andthen Congress. Voters that identify as independent or members of other parties increasingly
8accepted the legitimacy of a Biden win as the results came in from different states, but again,this proportion plateaued. Nine days after Joe Biden was sworn in as President, roughly 25%of unaffiliated voters did not view the election as legitimate.In order to probe whether particular events could effectively challenge the “big lie,” fromNovember 16th to December 15th we asked respondents who identified Trump as the winnera “Yes” or “No” question of the form, “Would you believe that Joe Biden won the electionif.”, followed by a hypothetical political event. Overall, 1245 respondents, the majority ofthem Republican (76%), saw this question over the 11 waves of the survey it was included.The results are presented in Table 1.
91.000.750.500.2501 2201 2601 2901 2601 2901 1901 22I01 1201 0812 22C12 1812 15E12 11B12 08L12 04M12 01D11 240.00.11 06.11 09.11 12.11 15.11 18.Proportion Identifying Biden as WinnerOutcome: Believes Biden Won1.000.750.500.2501 19I01 1201 0812 22C12 1812 15E12 11B12 08L12 04M12 01D11 240.00.11 06.11 09.11 12.11 15.11 18.Proportion Accepting Result as LegitimateOutcome: Election Result LegitimateFigure 1: Perceptions of 2020 election outcome. The top panel shows the proportion of respondentsthat answered “Joe Biden” to the question, “Who do you think won the 2020 presidential election?”The bottom panel shows the proportion that responded “Yes” to the question, “Do you accept theelection results as legitimate?” Starting on November 8th, the legitimacy question was preceded by thesentence, “Major news networks have announced that Joe Biden is the winner of the 2020 presidentialelection.” Letters mark significant political events: D Election Day, Nov 3; M Race called by newsnetworks, Nov 7; L Trump invites Michigan legislators to White House, Nov 24 ; B Barr says noevidence of fraud, Dec 2; E Electoral College certifies Biden, Dec 15; C Capitol insurrection, Jan7; I Inauguration Day, Jan 20. Line segments represent 95% confidence intervals. All data drawnfrom Election Legitimacy Tracking Survey (ELTS).
10Outcome: Believes Biden BECI01 0801 1001 1201 1501 1901 2201 2601 29DM12 0112 0312 0412 0812 1112 1512 1812 22I.11 06.11 09.11 12.11 15.11 18.11 24C01 0801 1001 1201 1501 1901 2201 2601 29E12 0112 0312 0412 0812 1112 1512 1812 22B.11 06.11 09.11 12.11 15.11 18.11 24L01 0801 1001 1201 1501 1901 2201 2601 29DM12 0112 0312 0412 0812 1112 1512 1812 220.00.11 06.11 09.11 12.11 15.11 18.11 24Proportion Identifying Biden as can1.000.750.500.25LBECIDMLBECI01 0801 1001 1201 1501 1901 2201 2601 29DM12 0112 0312 0412 0812 1112 1512 1812 22I.11 06.11 09.11 12.11 15.11 18.11 24C01 0801 1001 1201 1501 1901 2201 2601 29E12 0112 0312 0412 0812 1112 1512 1812 22B.11 06.11 09.11 12.11 15.11 18.11 24L01 0801 1001 1201 1501 1901 2201 2601 29DM12 0112 0312 0412 0812 1112 1512 1812 220.00.11 06.11 09.11 12.11 15.11 18.11 24Proportion Accepting Result as LegitimateOutcome: Election Result LegitimateFigure 2: Perceptions of 2020 election outcome by partisanship. The top panel shows the proportionof respondents that answered “Joe Biden” to the question, “Who do you think won the 2020 presidential election?” The bottom panel shows the proportion that responded “Yes” to the question, “Doyou accept the election results as legitimate?” Starting on November 8th, the legitimacy question waspreceded by the sentence, “Major news networks have announced that Joe Biden is the winner of the2020 presidential election.” Letters mark significant political events: D Election Day, Nov 3; M Race called by news networks, Nov 7; L Trump invites Michigan legislators to White House, Nov24 ; B Barr says no evidence of fraud, Dec 2; E Electoral College certifies Biden, Dec 15; C Capitol insurrection, Jan 7; I Inauguration Day, Jan 20. Line segments represent 95% confidenceintervals. All data drawn from Election Legitimacy Tracking Survey (ELTS).
11Table 1: What Would It Take to Believe Joe Biden WonWould you believe Joe Biden won the election if.% Responding “Yes”a. Republican leaders, such as Senate Majority Leader Mitch McConnell, say that Joe Biden won more votes than Donald Trump.28.7b. The Supreme Court rules that Joe Biden won more votes thanDonald Trump.42.9c. The Electoral College awards a majority of votes to Joe Biden.30.9d. The U.S. Congress awards a majority of votes to Joe Biden.26.6e. Donald Trump concedes the election to Joe Biden.45.2f. Joe Biden is sworn in as President by the Chief Justice of theSupreme Court on January 20, 2021.37.5n 1245Note: Table shows the responses to a question that was shown to respondents who did not identifyJoe Biden as the winner of the election even after the race had been called. The question wasonly included in the survey from November 16th to December 15th. All data drawn from ElectionLegitimacy Tracking Survey (ELTS).The data indicate a general reluctance to shift perceptions of the outcome even withnew political developments. Of the voters that denied the outcome, 28.7% said they wouldbelieve Biden won if Republican leaders like Mitch McConnell were to say that Biden wonmore votes. About 31.0% would believe Biden won if the Electoral College were to awardhim a majority of votes, and 42.9% would believe Biden won if there were a Supreme Courtdecision to that effect. About 45.2% of people who identified Trump as the winner wouldbelieve Biden won if Trump were to concede. About 33% of respondents who did not viewthe Biden win as legitimate identified no event that would make them think he actually won.It is worth noting that as these events actually unfolded, we did not observe equivalentincreases in the acceptance of the outcome. In the one month period from November 16thto December 15th, we surveyed 1558 Republican voters, 941 (60.4%) of which refused toidentify Biden as the election winner. Based on this estimate, as well as the data from the
12hypothetical scenarios shown in Table 1, we would have expected about 585 of those voters tohave come around by Inauguration Day, yielding an overall acceptance rate of the Biden winamong Republican voters at around 76%. The actual proportion continues to hover around40%, which suggests a certain stickiness to the lie. Voters who bought into Trump’s stolenelection narrative do not appear to readily update their perceptions of events, even when toldby Republican elites to do so, and after Biden formally became president.Outcome: Election Result LegitimateRepublicanIndependent/Other30 4950 64Age Group18 al StatusHSEducation65 0.20.00.2 0.20.00.2Coefficient EstimateFigure 3: Perceptions of 2020 election outcome by partisanship and demographics. The figure showsthe coefficient estimates from a linear probability model where the binary legitimate variable wasregressed on demographic covariates of interest. Starting on November 8th, the legitimacy questionwas preceded by the sentence, “Major news networks have announced that Joe Biden is the winnerof the 2020 presidential election”– the estimates in this figure reflect data collected after that date.Line segments represent 95% confidence intervals. All data drawn from Electoral Legitimacy TrackingSurvey (ELTS).Figure 3 explores who is most likely to reject the election result. The figure presentsthe results of a simple linear probability model, regressing the binary legitimate variable ondemographic covariates of interest. The left panel presents results for Republican voters, andthe right panel presents results for voters that identified no partisan affiliation.
13We observe that voters who are older, less educated, and categorize themselves as havinglower social status are less likely to perceive the Biden win as legitimate. These relationshipshold for both Republican and independent voters, though they are more pronounced amongRepublican respondents. Independent voters are also much more likely overall to accept theelection outcome.Support for Radical and Violent Political Action against the StateAs the United States has become increasingly polarized, Americans have become more accepting of political violence (Kalmoe and Mason, 2021). Building on this work, we explorewhether the perpetuation of the lie potentially mobilized support for violent political action.The ELTS core questionnaire included the Radicalism Intention Scale (RIS), which assessesa respondent’s readiness to participate in violent or illegal political action against the legal authorities as a way to achieve their political goals (Moskalenko and McCauley, 2009).6The questions measure willingness to participate in a violent protest, attack police forces,encourage others to participate in illegal protests, and go to war on behalf of ones socialgroup, among other behaviors (see the Supporting Information for exact question wordings).Disputes over election legitimacy in consolidating democracies sometimes lead partisans ofthe losing side to attempt to overthrow the government through violent means (Przeworski,1991, 2005), and we included the RIS on the survey since it focuses on one’s willingness totarget state agents. Respondents were asked their level of agreement on a scale of one to five,and their answers were averaged over the five questions in the battery. Higher scores indicategreater agreement and willingness to participate in violence (x̄ 2.67, SD 1.21).6The RIS is related to but distinct from measures of partisan violence, such as Kalmoeand Mason’s (Kalmoe and Mason, 2021). The RIS is specifically about the willingnessto be mobilized to use violence against authorities as a way to fight for one’s politicalgroup, whereas measures of partisan violence focus on the more general acceptance that isis justifiable to use violence against opposing partisans.
14Outcome: Radicalism Intention BECIDMLBECI01 0801 1201 1501 1901 2201 2601 29DM11 3012 0412 0812 1112 1512 1812 22I10 28.10 31.11 06.11 12.11 18.11 24C01 0801 1201 1501 1901 2201 2601 29E11 3012 0412 0812 1112 1512 1812 22B10 28.10 31.11 06.11 12.11 18.11 24L01 0801 1201 1501 1901 2201 2601 29DM10 28.10 31.11 06.11 12.11 18.11 241.511 3012 0412 0812 1112 1512 1812 22Radicalism Intention Scale3.5Figure 4: Support for radical and violent political action by partisanship. Letters mark significantpolitical events: D Election Day, Nov 3; M Race called by news networks, Nov 7; L Trumpinvites Michigan legislators to White House, Nov 24 ; B Barr says no evidence of fraud, Dec 2; E Electoral College certifies Biden, Dec 15; C Capitol insurrection, Jan 7; I Inauguration Day,Jan 20. Line segments represent 95% confidence intervals. All data drawn from Election LegitimacyTracking Survey (ELTS).Figure 4 shows the evolution of support for radical and violent political action over time,again disaggregating the data by partisanship.7 We observe higher levels of support forradical action among partisans, and a quite noticeable increase in support for radical actionagainst the state among Democrats in the immediate aftermath of the election. This supportpeaked just before the Electoral College members cast their votes on December 14th, perhapsin response to Trump’s public efforts to pressure local officials and legislators to dismiss votesfrom key states. Put differently, Trump’s perpetuation of the lie, coupled with his attemptsto actually overturn the election result, appear to have pushed Democratic voters into amore radical mindset. This mindset subsided substantially after the election result wassecured by the Electoral College vote and the events of January 6th, but support for violenceamong Democrats remained significantly higher than pre-election levels even after Biden wasinaugurate
simple paired conjoint design in the survey (Hainmueller, Hopkins and Yamamoto,2014; Hainmueller, Hangartner and Yamamoto,2015;Teele, Kalla and Rosenbluth,2018), present-ing Republican voters with hypothetical primary candidates for an upcoming congressional race. We nd that candidates who maintain Donald Trump won the 2020 election have a


![EXHIBIT 24 [Filed Under Seal] - Washington Post](/img/32/cohen-v-trump-in-support-of-motion-for-class-certification-4.jpg)