Transcription
Espino et al. BMC Musculoskeletal Disorders 2014, 5RESEARCH ARTICLEOpen AccessViscoelastic properties of bovine knee jointarticular cartilage: dependency on thicknessand loading frequencyDaniel M Espino*, Duncan ET Shepherd and David WL HukinsAbstractBackground: The knee is an incongruent joint predisposed to developing osteoarthritis, with certain regions beingmore at risk of cartilage degeneration even in non-osteoarthrosed joints.At present it is unknown if knee regions prone to cartilage degeneration have similar storage and/or loss stiffness,and frequency-dependent trends, to other knee joint cartilage. The aim of this study was to determine the range offrequency-dependent, viscoelastic stiffness of articular cartilage across the bovine knee joint. Such changes weredetermined at frequencies associated with normal and rapid heel-strike rise times.Methods: Cartilage on bone, obtained from bovine knee joints, was tested using dynamic mechanical analysis (DMA).DMA was performed at a range of frequencies between 1 and 88 Hz (i.e. relevant to normal and rapid heel-strike risetimes). Viscoelastic stiffness of cartilage from the tibial plateau, femoral condyles and patellar groove were compared.Results: For all samples the storage stiffness increased, but the loss stiffness remained constant, with frequency. Theywere also dependent on cartilage thickness. Both the loss stiffness and the storage stiffness decreased with cartilagethickness. Femoral condyles had the thinnest cartilage but had the highest storage and loss stiffness. Tibial plateaucartilage not covered by the meniscus had the thickest cartilage and lowest storage and loss stiffness.Conclusion: Differences in regional thickness of knee joint cartilage correspond to altered frequency-dependent,viscoelastic stiffness.Keywords: Articular cartilage, Dynamic mechanical analysis, Stiffness, Thickness, ViscoelasticityBackgroundIn this study, Dynamic Mechanical Analysis (DMA) hasbeen used to determine viscoelastic stiffness of bovineknee joint articular cartilage. A frequency sweep wasused to measure viscoelastic stiffness from normal up torapid loading rates. Measurements were taken from distinct knee joint regions. This has provided a range ofviscoelastic stiffness for healthy knee joints over normaland rapid loading frequencies.Rapid heel-strike rise times during gait have been implicated in the early onset of osteoarthritis (OA) [1,2].Heel-strike rise time is typically 100 to 150 ms [3]. Asubset of the population with heel-strike rise times from5 to 25 ms have been identified as being predisposed to* Correspondence: d.m.espino@bham.ac.ukSchool of Mechanical Engineering, University of Birmingham, BirminghamB15 2TT, UKOA [2]. The timing of these heel-strikes correspond toloading frequencies of 3–5 Hz for normal and up to90 Hz for rapid heel-strike rise times [4].Increased loading frequency alone might predisposecartilage to becoming damaged. This was suggested because of changes in cartilage viscoelastic properties withfrequency such that, at higher frequencies, more energywas available to damage cartilage [4]. This damage isdistinct from that caused purely by excess loading [5,6].Undamaged articular cartilage contributes to smoothjoint motion, aided by a surface roughness of around80 – 170 nm [7]. However, OA is associated with damagedcartilage and impaired/painful joint motion [8].Viscoelastic properties of a material are characterisedby its storage and loss moduli [9,10]. The storage modulus characterises the ability to store energy which is thenavailable for elastic recoil. The loss modulus characterises 2014 Espino et al.; licensee BioMed Central Ltd. This is an Open Access article distributed under the terms of the CreativeCommons Attribution License (http://creativecommons.org/licenses/by/2.0), which permits unrestricted use, distribution, andreproduction in any medium, provided the original work is properly credited.
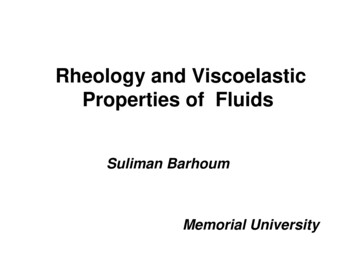
Espino et al. BMC Musculoskeletal Disorders 2014, 5the ability of the material to dissipate energy. Storage andloss moduli are calculated from the storage and loss stiffness, respectively, using a shape factor [4]. If the area ofcartilage loaded is constant (e.g. constant indenter area),the only shape factor variable is the cartilage thickness.The mechanical properties of cartilage vary acrossthe knee [11] and may be a result of diverse localisedloading [12]. However, it is unknown how storage andloss stiffness of cartilage vary across the knee andwhether all knee joint cartilage follows the frequencydependent viscoelastic trends found by Fulcher et al.[4] from normal up to rapid loading. Therefore, it isalso unknown if regions across the knee known toshow signs of cartilage damage have a similar storageand/or loss stiffness to regions that show no signs ofdamage. There are two clear reasons why the knee isof particular interest. Firstly, it is an incongruent jointpredisposed to developing OA [12,13]. Secondly, itoften shows signs of damage at specific regions evenin otherwise healthy joints [14].The aim of this study was to determine the rangeof frequency dependent viscoelastic stiffness of articularcartilage across the knee joint. Bovine cartilage was usedbecause it is an accepted model for human cartilage,with similar thickness [15]. DMA was used to measurestorage and loss stiffness, with cartilage thickness subsequently measured. The ratio of storage to loss stiffness,i.e. propensity to failure, was also derived. Variation ofthese parameters was assessed against both frequency ofloading and cartilage thickness.MethodsSpecimensSix bovine knee joints, approximately between 18 and30 months old, were obtained from a supplier (Johnston’sButcher, Kings Heath, Birmingham, UK). Upon arrivalin the laboratory, samples were dissected into femoralcondyles, patellar groove and medial and lateral tibialplateau. Individual samples were then wrapped in tissuepaper saturated in Ringer’s solution and stored at 40 Cin plastic bags. Prior to testing, samples were thawed andindividual test specimens were obtained. Such freezethaw treatment does not alter the dynamic mechanicalproperties of cartilage [16]. Test specimens included theunderlying subchondral bone which prevents tissueswelling [17]; further details are available elsewhere [4,18].Typically over 1 cm of underlying bone was maintained.India ink (Loxley Art Materials, Sheffield, UK) was used toidentify any pre-existing surface lesions [19]. Regionsshowing pre-existing lesions were not tested. However, asjoints were not osteoarthritic, large scale damage was notevident. Therefore, it was always feasible to identify a region of interest for testing. In some cases, however, thismeant testing near a lesion site. Specimens were dissectedPage 2 of 9so as to load an approximately flat cartilage surface, described further elsewhere [4].DMA frequency sweepThe experimental protocol has been defined previously[4]. Briefly, samples were secured in a custom made rigwith acrylic polymer cement (WHW Plastics, Hull, UK)bathed in Ringer’s solution at room temperature. WinTestDMA software (Bose Corporation, ElectroForce SystemsGroup, Minnesota, USA) was used to control a materialstesting machine (Bose ElectroForce 3200). A sinusoidallyvarying compressive force between 16 N and 36 N was applied, i.e. nominal peak stress of 1.7 MPa, estimatedphysiological for cartilage [20]. Forces were applied using acylindrical indenter (diameter of 5.2 mm), with a chamfered end to prevent cartilage damage at the edge of thecontact area. The cartilage surface ( 20 mm 20 mm) waslarger than the indenter surface area. The resulting displacements were consistent with our previous studies[4,18]. The loading was applied over a range of frequencies(1, 8, 10, 12, 29, 49, 71, and 88 Hz). Two preload conditions were applied before the frequency sweep, at 25 and50 Hz (1500 and 3000 cycles respectively, i.e. 2 minutes ofpreconditioning cycles with a 60 s rest period). Note, thatthe DMA protocol involved a dynamic load amplitudewhich resulted in a dynamic displacement amplitude thatwas used to calculate dynamic stiffness. This requiresthe cartilage to have achieved a dynamic “steady-state”,which for ex vivo cartilage occurs after around 1200 to4500 preconditioning cycles [4,21,22]. Further explanation, and applicability, of the method is provided elsewhere [4,18]. Samples were fully immersed in Ringer’ssolution during tests.The cartilage thickness was measured after the finaltest using a previously described technique [4,23].Briefly, a sharp needle is pushed through the cartilagelayer and up to the bone using a testing machine. This isan established technique used to measure ex vivo cartilage thickness [15,23]; extended discussion on its applicability is provided elsewhere [18]. A total of 99 DMAfrequency sweep tests were performed on the samplesobtained (see specimens section, above).CalculationsThe storage (k’) and loss (k”) stiffness and thickness wereobtained. As the indenter diameter (5.2 mm) is constant,the only variables are the measured sample thicknessand dynamic stiffness. A curve was fitted to the graphsof storage stiffness against frequency of the form:k 0 ¼ A loge ðf Þ þ Bð1Þwhere A defines the gradient of k’ plotted against thenatural logarithm of f, the loading frequency (Hz), and B
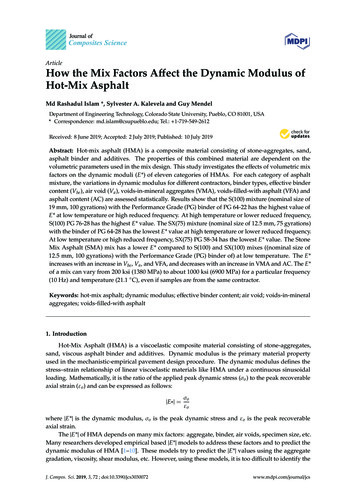
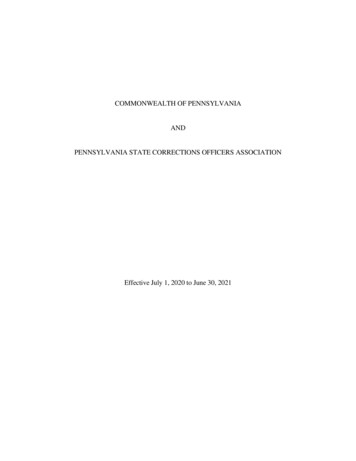
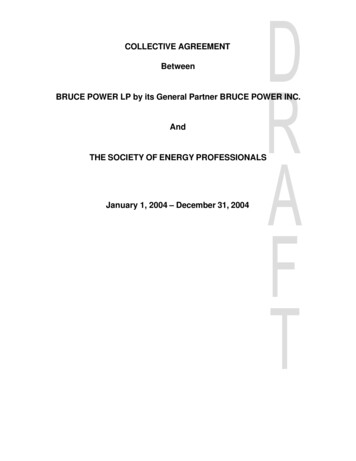
Espino et al. BMC Musculoskeletal Disorders 2014, 5is the intercept. A similar curve fit has been used forrepresenting storage modulus previously [4].The ratio of storage to loss stiffness (k’/k” ratio) is ameasure of energy stored in a system that enables itselastic recoil to the energy dissipated by the system. Thegreater the k’/k” ratio, the greater the proportion of energy available in the system for recoil and/or failure.Further explanation of dynamic stiffness is availableelsewhere, including its relation to dynamic modulusand phase angle [4,10,18,24].StatisticsStatistical comparisons of data were made between cartilage test samples from different regions within the kneejoint. Cartilage test samples were identified as being either femoral or tibial. Femoral cartilage was further classified as being either from the femoral condyles or thepatellar groove. Tibial plateau cartilage was classified aseither meniscus covered or not covered by the meniscus.Medial and lateral samples were compared to determinewhether medial-lateral differences were negligible, thereby,enabling results to be combined. A one-way analysis ofvariance (ANOVA) was undertaken using Tukey’s methodfor multiple comparisons to investigate significant differences (p 0.05), in thickness and/or dynamic mechanicalstiffness and moduli, between the different regions [25].Tables in the results section use A, B, C, D, E to indicate‘statistical’ groups which are significantly different. Also, aknee joint region may form part of more than one ‘statistical’ group. Thus, where two knee joint regions do notshare a letter they are significantly different (p 0.05) butif they do share a letter they are not significantly different(p 0.05) from each other.Frequency dependent measurements of storage andloss stiffness, and their ratio, were compared at all frequencies. For conciseness, comparisons at 1 Hz are presented in the results. Note, the two constants, A and B,are used to characterise the frequency dependent storagestiffness of samples (equation 1); i.e. their comparisonsare not made at an individual frequency. Dynamic moduli were compared across different knee regions to assess whether regional variations were due to inherentlydifferent material properties of cartilage.Cartilage thickness was compared across knee jointcartilage. Lines of best fit between cartilage thicknessand storage and loss stiffness, and their ratio, were plotted to determine whether correlations were significant(p 0.05). Regression equations were obtained for significant correlations.Page 3 of 9was limited to the tibial plateau. The lateral tibial plateaucartilage, that is covered by the meniscus, had a significantly greater loss stiffness than the corresponding medialcartilage (Table 1). For subsequent analyses, data obtainedfrom lateral and medial samples were combined.ThicknessFrom the samples tested, cartilage thickness ranged from0.5 to 3.3 mm. Tibial plateau cartilage not covered bythe meniscus was significantly thicker than all otherknee joint cartilage (2.19 0.67 mm, p 0.05; Table 2).In descending order, it was followed by patellar groove andmeniscus covered tibial plateau cartilage. The thinnest cartilage was found at the femoral condyles (0.89 0.26 mm;Table 2).Loss stiffnessThe loss stiffness of articular cartilage (on bone) was frequency independent (Figure 1). The loss stiffness of kneejoint cartilage ranged from 16 – 640 N/mm. Femoralcondyle cartilage has a significantly greater loss stiffness than all other knee joint cartilage (106 28 N/mm,p 0.05; Table 2). It was followed by patellar groove andmeniscus-covered tibial plateau cartilage. Tibial plateaucartilage not covered by the meniscus had a significantlylower loss stiffness than all other cartilage (37 23 N/mm,p 0.05; Table 2).There was a significant non-linear decrease in the lossstiffness with thickness across knee joint cartilage (p 0.05;Figure 2). A second order polynomial curve fitted to theexperimental data (equation 2; R2 69%) wask 00 ¼ 172:8 102:7t þ 17:64t 2ð2Þwhere t is the cartilage thickness in mm, and k” is theloss stiffness in N/mm.Storage stiffnessThe storage stiffness ranged from 90 to 1930 N/mm. At1 Hz, tibial plateau cartilage not covered by the meniscus, had a significantly lower storage stiffness than allother cartilage (304 189, p 0.05; Table 2). Femoralcondyle cartilage had significantly higher storage stiffness values than all other cartilage (923 233, p 0.05;Table 2; Figure 1). The storage stiffness decreased significantly with thickness (p 0.05; Figure 3), with databeing fitted using a second order polynomial equation(equation 3; R2 63%).k 0 ¼ 1384 764:1t þ 121:7t 2ð3ÞResultsLateral and medial cartilageAt 1 Hz the only significant difference in viscoelasticstiffness between comparable lateral and medial cartilagewhere k’ is the storage stiffness in N/mm.For all samples storage stiffness increased with frequency (Figure 1). This relationship was described using
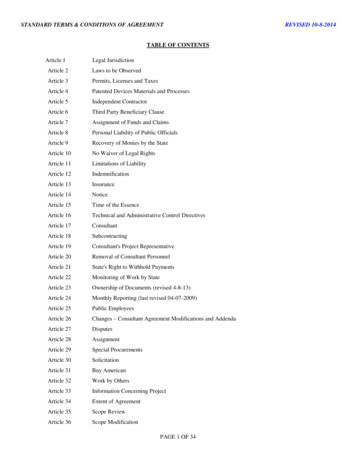
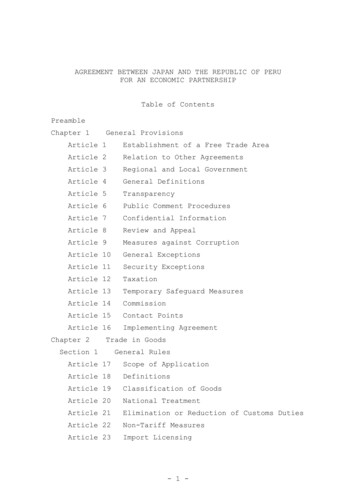
Espino et al. BMC Musculoskeletal Disorders 2014, 5Page 4 of 9Table 1 Mean and standard deviation of parameters measured at 1 Hz and thickness of cartilagenLateralFemoral condyleThickness (mm)k’ (N/mm)k” 949A26695A,B2410.0A1.5CAAAMedialFemoral condyle120.890.29897203118297.91.8LateralPatellar edialPatellar grooveLateralTibial plateau8meniscus 36A0.5249D16029E148.1A228A14MedialTibial plateaumeniscus covered13LateralTibial plateau not meniscus covered15MedialCTibial plateau not meniscus coveredA,B162.03C,D0.78360D,E204458.31.8The lettersA, B, C, D, E are used to indicate significant differences between the different regions; where a region does not share a letter they are significantlydifferent (p 0.05).n:number of samples tested from each region.two constants, A and B (see Calculations section). Constant A ranged from 2 to 120 N/mm. Tibial plateau cartilage not covered by the meniscus, was significantly lowerthan all other cartilage (21 18, p 0.05; Table 3). Femoralcondyle cartilage had significantly higher values for A thanall other cartilage (67 29, p 0.05; Table 3). Constant Adecreased significantly with thickness (p 0.05), this relationship can be described using a second order polynomialequation (equation 4; R2 51%; Figure 4).A ¼ 115:5 77:81t þ 14:68t 2ð4ÞThe intercept B ranged from 90 to 1340 N/mm. Tibialplateau cartilage not covered by the meniscus had significantly lower B values than all other cartilage (303 182, p 0.05; Table 3). Femoral condyle cartilage hadsignificantly higher values for A than all other cartilage(922 231, p 0.05; Table 3). Constant B decreased significantly with thickness (p 0.05), with data being fittedusing a second order polynomial equation (equation 5;R2 63%, Figure 5).ð5ÞB ¼ 1393 781:2t þ 126:9t 2Ratio of k’/k”From the samples tested, the k’/k” ratio (i.e. ratio of storageto loss stiffness ratio) for cartilage ranged from 1–14. Thisratio increased with frequency as k’, but not k”, increasedwith frequency (see Loss and Storage stiffness sections,above). No significant differences in the k’/k” ratio were determined for different cartilage samples (p 0.05; Table 2).For example, tibial plateau cartilage not covered by the meniscus had the lowest value for the k’/k” ratio (8.2 1.8).However, its k’/k” ratio was not significantly lower than thek’/k” ratio for patellar groove cartilage (9.2 2.5) which hadthe highest ratio.Dynamic moduliTibial plateau cartilage, not covered by the meniscus,had significantly lower storage and loss moduli thanthe thinnest knee joint cartilage of the femoral condyles(Tables 4 and 5). These findings are consistent with findings for dynamic stiffness (see storage stiffness and lossstiffness, above).At 1 Hz, femoral condyle cartilage had the largest storage modulus (37.3 8.2 N/mm2; Table 2). It was followedTable 2 Storage (k’) and loss (k”) stiffness, and their ratio, at 1 Hz and cartilage thicknessnThickness (mm)meanASDk’ (N/mm)meank” (N/mm)meanA23310621569BFemoral condyles240.890.26923Patellar 02.0239.2A2.5BATibial plateau meniscus covered311.100.3865322380298.42.0Tibial plateau not meniscus covered272.19C0.67304C18937C238.2A1.8The lettersA, B, C are used to indicate significant differences between the different regions; where a region does not share a letter they are significantlydifferent (p 0.05).n:number of samples tested from each region.
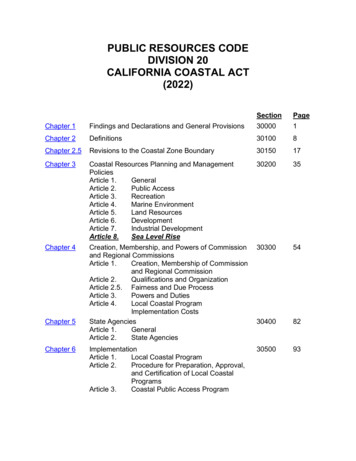
Espino et al. BMC Musculoskeletal Disorders 2014, 5Figure 1 Frequency dependency of storage (k’) and loss (k”)stiffness for two cartilage samples. The two samples shown werefrom the lateral tibial plateau, not under the meniscus (LTPnM), andlateral femoral condyle (LFC). The former was 2.1 mm and the latter0.9 mm thick. A trend-line, of the form of equation 1, is included forthe storage stiffness of both samples. Note, in the equations in thegraph x refers to the frequency (f in equation 1) and y to the storagestiffness (k’ in equation 1).by patellar groove and meniscus-covered tibial plateau cartilage. Tibial plateau cartilage not covered bythe meniscus had a significantly lower storage modulus (27.6 12 N/mm2) than femoral condyle cartilage(p 0.05; Table 4). Storage moduli at 90 Hz were significantly greater than those at 1 Hz (p 0.05), consistent witha frequency dependent increase in storage stiffness (seestorage stiffness, above). Results at 90 Hz were consistentwith findings at 1 Hz and for stiffness, with mean storagemoduli ranging from 52.3 9.2 N/mm2 (femoral condyles)to 32.3 16.2 N/mm2 (tibial plateau cartilage not coveredby the meniscus; Table 4). Thus, storage modulus of thethinnest cartilage increased with frequency by 40%, compared to a 17% increase for the thickest cartilage.Femoral condyle cartilage had the largest loss modulus(4.3 1.0 N/mm2; Table 5). It was followed by patellarPage 5 of 9Figure 3 Thickness dependent storage stiffness of knee jointcartilage at 1 Hz. A second order polynomial curve (see equation 3)was fitted to the experimental data (R2 63%; p 0.05) as shown (solidline). The 95% confidence intervals are also included (dashed line).groove and meniscus-covered tibial plateau cartilage.Tibial plateau cartilage not covered by the meniscus hada significantly lower loss modulus than femoral condylecartilage (3.3 1.2 N/mm2, p 0.05; Table 5). Values arereported for 1 Hz, however, note that the loss moduluswas not frequency dependent.DiscussionMain findingsThis study has used dynamic mechanical analysis tocharacterise the storage and loss stiffness (i.e. viscoelasticstiffness) of articular cartilage, on bone, across bovineknee joints. The ratio of storage to loss stiffness was alsoderived. The dependency on both frequency and cartilage thickness was assessed for all parameters. Key findings from this study include: femoral condyles had the thinnest cartilage but hadthe highest storage and loss stiffness; tibial plateau cartilage not covered by the meniscuswas the thickest cartilage across the knee with thelowest storage and loss stiffness;Table 3 Variation in storage stiffness coefficients withknee joint locationA (N/mm)meanFigure 2 Thickness dependent loss stiffness of knee jointcartilage at 1 Hz. A second order polynomial curve (see equation 2)was fitted to the experimental data (R2 69%; p 0.05) as shown (solidline). The 95% confidence intervals are also included (dashed line).Femoral condylesA67Patellar groove38BSDB (N/mm)meanSD29922A23124584B225Tibial plateau meniscus coveredB4521B656223Tibial plateau not meniscus covered21C18303C182The lettersA, B, C are used to indicate significant differences between thedifferent regions; where a region does not share a letter they are significantlydifferent (p 0.05).
Espino et al. BMC Musculoskeletal Disorders 2014, 5Figure 4 Thickness dependency of A (see equation 1) for kneejoint cartilage. A second order polynomial curve (see equation 4)was fitted to the experimental data (R2 51%; p 0.05) as shown(solid line). The 95% confidence intervals are also included(dashed line). the storage and loss stiffness were dependent oncartilage thickness; no differences in propensity to fail (i.e. k’/k” ratio)were found across the knee joint; changes in moduli confirm that stiffness trends resultfrom inherent changes in the material properties of thetissue rather than simply size.Storage and loss stiffnessIn this study we found the storage, but not loss, stiffnessto be frequency dependent. These findings are consistentwith previous reports of moduli between frequencies of1 – 90 Hz for cartilage on-bone [4]. This was expectedbecause the storage and loss moduli are calculated fromFigure 5 Thickness dependency of B (see equation 1) for kneejoint cartilage. A second order polynomial curve (equation 5) wasfitted to the experimental data (R2 63%; p 0.05) as shown (solidline). The 95% confidence intervals are also included (dashed line).Page 6 of 9the storage stiffness and a shape factor, where the shapefactor is a constant for an individual sample. The lossmodulus has been reported as being frequency dependentwhen removed from its underlying bone [9]. However, thephysical behaviour of cartilage when on and off-bone differs [17] because of the restrictions provided by the underlying bone to cartilage [26]. For example, hysteresis candecrease when cartilage is on-bone, but increase when offbone, with increased loading velocity [27].Storage and loss stiffness both decreased with cartilagethickness. Therefore, femoral condyle cartilage and tibialplateau cartilage not covered by the meniscus appear torepresent extremes across the knee. Cartilage from thepatellar groove and from the tibial plateau covered bythe meniscus fell somewhere in between. Moreover, boththe gradient and intercept increased with reduced cartilage thickness. Therefore, thinner cartilage had a greaterstorage stiffness increase with frequency than thickercartilage.Knee joint & implications for the onset of OATibial plateau cartilage not covered by the meniscus wasthe thickest cartilage in our knee joints tested and wasmost likely to show signs of damage. Damage to this cartilage is common, and has even been reported in otherwise healthy adolescent human knee joints [14]. It hasalso been shown that this cartilage is thicker than otherknee cartilage by weakening of its underlying structure[14]. For example, a comparison of collagen fibers of tibial plateau cartilage, showed that cartilage not coveredby the meniscus were of more uniform diameter andmore likely to be arranged in parallel bundles than cartilage under the meniscus [14]. Collagen provides themain tensile reinforcement in connective tissues [10,28].Thus, changes in collagen uniformity and alignmentare expected to compromise its ability to provide suchreinforcement during dynamic loading. This is consistent with our finding that the cartilage not covered bythe meniscus had the lowest dynamic stiffness.It has been argued that tibial plateau cartilage notunder the meniscus is exposed to intermittent shockloading with low ambulatory stress [12]. This combination of loading has been proposed to lead to degeneration of cartilage for all joints [29,30]. Our results showthat this degenerated, thicker, cartilage also has reduceddynamic stiffness and a reduced frequency-dependentincrease in storage stiffness. As mentioned above, increased cartilage thickness is a consequence of damagedultrastructure. However, tibial plateau cartilage not underthe meniscus also has greater water content (87%) thanmeniscus covered cartilage (71%) [14]. Therefore, differences in dynamic stiffness, and its frequency dependency,are expected to be the result of changes to gel-collageninteraction. How, structurally, cartilage dissipates and
Espino et al. BMC Musculoskeletal Disorders 2014, 5Page 7 of 9Table 4 Storage (E’) modulus, at 1 Hz and 90 Hz and cartilage thicknessn1 Hz (E’, N/mm2)Thickness (mm)90 Hz (E’, 2Patellar groove17B1.320.2635.9Tibial plateau meniscus covered311.10A,B0.3831.7A,BFemoral condylesTibial plateau not meniscus C13.612.0C32.316.2The lettersA, B, C are used to indicate significant differences between the different regions; where a region does not share a letter they are significantlydifferent (p 0.05).n:number of samples tested from each region.stores energy is likely to be related to the stress transfermechanism during gel-collagen interaction [31].In the knee joint, higher than baseline bone joint areaand volume of cartilage has been associated with the lossof cartilage over the subsequent two-years [32]. Antonyet al. [32] suggested that the most likely cause of increased cartilage volume was swelling. This is consistentwith increased water content and cartilage thickeningduring the early stages of OA [33]. Our results show thatincreased thickness is accompanied by reduced storageand loss stiffness. The k’/k” ratio had a similar range ofvalues to a previous study [18], but did not vary withthickness. Therefore, no differences in propensity to failare reported due to differences in storage to dissipationof energy. However, if thicker cartilage is weaker thanthinner cartilage, then for a given k’/k” ratio it may experience greater damage. This is consistent with tibialplateau cartilage not covered by the meniscus beingdamaged across the knee [14].Relevance to heel-strikeA subset of the population with high heel-strike risetimes during gait may be implicated in the onset of OA[1]. This subset of the population has been identified ashaving heel-strike rise times ranging from 5–25 ms[2,3,34]. These rise times are sufficiently rapid to generate impulsive loading during heel-strike. They compareto ‘healthy’ heel-strike rise times of approximately 100–150 ms [3,4].Table 5 Loss (E”) modulus at 1 Hz and cartilage thicknessnThickness (mm) E” (N/mm2)meanASDmeanASDFemoral condyles240.890.264.31.0Patellar 673.3BTibial plateau meniscus covered31Tibial plateau not meniscus covered 27A,B1.2The lettersA, B, C are used to indicate significant differences between thedifferent regions; where a region does not share a letter they are significantlydifferent (p 0.05).n:number of samples tested from each region.Our experiments include frequencies of up to 92 Hzwhich leads to a maximum rise time of 5.4 ms, comparable to impulsive heel-strike rise times [4]. Althoughheel-strikes repetitively occur at this rate only after anindividual gait cycle, this does provide a maximum frequency at which to measure mechanical stiffness. Moreover, it highlights how cartilage dynamic mechanicalproperties change with heel-strike rise times.Experimentally, this led to an increase in storage toloss stiffness with frequency, and is in agreement withprevious findings of an increased ratio of storage to lossmodulus [4] and stiffness [18] with frequency. Thus,there is an increase in the proportion of energy stored toenergy dissipated which is due purely to the increase infrequency. If the energy stored becomes too great, thenexcess energy would potentially be dissipated throughcracking the tissue; i.e. cartilage failure. This mechanismwould be consistent with cartilage failure occurringthrough increased energy during impact loading [35].If energy storage and dissipation is altered with loading frequency, then the transfer of energy during contactfrom bone to cartilage and cartilage to bone could alsobe altered. The altered energy transfer, with loading frequency, to the underlying bone may have implicationsfor bone remodelling.LimitationsIn this study lateral and medial results were pooled toenable comparisons between regions. This meant thata limited number of lateral-medial differences wereignored. The only difference identified was limited tolateral tibial plateau cartilage, that is covered by themeniscus, having a significantly greater loss stiffnessthan the corresponding medial cartilage. However, f
the DMA protocol involved a dynamic load amplitude which resulted in a dynamic displacement amplitude that was used to calculate dynamic stiffness. This requires the cartilage to have achieved a dynamic "steady-state", which for ex vivo cartilage occurs after around 1200 to 4500 preconditioning cycles [4,21,22]. Further explan-