Transcription
PHYSICAL REVIEW B 96, 085129 (2017)Electronic structures and spin states of BaFe2 As2 and SrFe2 As2 probed by x-ray emissionspectroscopy at Fe and As K -absorption edgesHitoshi Yamaoka,1,* Yoshiya Yamamoto,2 Jung-Fu Lin,3,4 Junjie J. Wu,3,4 Xiancheng Wang,5 Changqing Jin,5Masahiro Yoshida,2,† Seiichiro Onari,6 Shigeyuki Ishida,7 Yoshinori Tsuchiya,7 Nao Takeshita,7 Nozomu Hiraoka,8Hirofumi Ishii,8 Ku-Ding Tsuei,8 Paul Chow,9 Yuming Xiao,9 and Jun’ichiro Mizuki21RIKEN SPring-8 Center, 1-1-1 Kouto, Mikazuki, Sayo, Hyogo 679-5148, JapanGraduate School of Science and Technology, Kwansei Gakuin University, Sanda, Hyogo 669-1337, Japan3Department of Geological Sciences, The University of Texas at Austin, Austin, Texas 78712, USA4Center for High Pressure Science and Technology Advanced Research (HPSTAR), Shanghai 201203, China5Institute of Physics, Chinese Academy of Sciences, School of Physics, University of Chinese Academy of Sciences, Beijing 100190, China6Department of Physics, Okayama University, Okayama 700-8530, Japan7National Institute of Advanced Industrial Science and Technology (AIST), Tsukuba, Ibaraki 305-8562, Japan8National Synchrotron Radiation Research Center, Hsinchu 30076, Taiwan9HPCAT, Geophysical Laboratory, Carnegie Institution of Washington, Argonne, Illinois 60439, USA(Received 25 June 2017; revised manuscript received 24 July 2017; published 22 August 2017)2Electronic structures of electron- and hole-doped BaFe2 As2 and nondoped SrFe2 As2 have been studiedsystematically by x-ray emission spectroscopy at Fe and As K-absorption edges. The electron and hole dopingcauses slight increase of the integrated absolute difference (IAD) values of the Fe Kβ x-ray emission spectrawhich correlate to the local magnetic moment. Pressure decreases the IAD values and local magnetic moment,and induces the lower-spin states in these compounds. The pre-edge peak intensity of the XAS spectra at theFe K-absorption edge increases with pressure in both compounds. This indicates an increase of the Fe 3d–As4p hybridization. It was found that pressure induced a discontinuous increase of the prepeak intensity of thePFY-XAS spectra at the As K-absorption edge at low pressures in the BaFe2 As2 systems. Our results may suggestthat the Fe 3d–As 4p hybridization plays a key role in suppressing the AFM order by the doping or pressureand fluctuation of the local magnetic moment and the electron-electron correlation may also play a role on thephysical properties of the iron superconductors.DOI: 10.1103/PhysRevB.96.085129I. INTRODUCTIONHigh-temperature superconductivity in F-doped LaFeAsOwas found in 2008 (Ref. [1]) and many iron-based superconductors with different crystal structures have beensynthesized [2,3]. Most iron-superconductor families haveFeAs or FeSe planes as the common layers, which correlate tothe superconductivity. The Fe-As-Fe angle or pnictogen heightis an important parameter crystallographically. It correlatesto the superconducting transition temperature (Tc ) [4–7].Although superconductivity and magnetism had been considered to compete against each other, non-BCS-type high-Tcsuperconductors show a close relation between magnetism andsuperconductivity. Theoretically it is suggested that the pairinginteraction is mediated by exchange of the antiferromagnetic(AFM) spin fluctuations, where the pairing is due to thehopping of electrons between the electron and hole pockets,or by the orbital fluctuations [3,8,9].Thus in iron-based superconductors AFM correlation isone of the most important concerns because the region ofthe AFM order often merges into the superconducting domein the phase diagram. It is known that in the nondopedparent compounds the ordered magnetic moment is muchsmaller than the local moment. This suggests that the local*Corresponding author: yamaoka@spring8.or.jpPresent address: Institute of Solid State Physics, The University ofTokyo, 5-1-5 Kashiwanoha, Kashiwa, Chiba 277-8581, Japan.†2469-9950/2017/96(8)/085129(12)magnetic moment strongly fluctuates and the residual momentremains ordered [10]. Therefore, the magnetic fluctuationmay play an important role on the physical properties of theiron superconductors. Recent theoretical calculations usinga spin-fermion model with ferromagnetic Hund’s couplingshowed that the itinerant carriers with well-nested Fermisurfaces were found to induce a spatial and temporal quantumfluctuation, leading to the observed small ordered moment[10]. The underlying mechanism was an intrapocket nestingassociated long-range coupling rather than the ferromagneticdouble-exchange effect.The ternary 122-type AFe2 As2 (A Eu, Ca, Sr, andBa) compounds exhibit a temperature-induced tetragonal-toorthorhombic structural transition strongly coupled with aparamagnetic-to-antiferromagnetic transition with decreasingtemperature. AFe2 As2 does not show superconductivity atambient pressure. In BaFe2 As2 electron doping, hole doping,and pressure suppress the AFM order and induce superconductivity. The pressure-induced structural transition fromthe tetragonal (T) to the collapsed tetragonal (cT) phase isa universal characteristic of AFe2 As2 compounds [11–17].Some theoretical studies focused mainly on the interlayerAs-As distance under pressure [18–20]. It was suggested thatthe spin state of Fe is one of the key parameters that controlsAs-As bonding and, consequently, the lattice parameters [19].In BaFe2 As2 a small amount of the electron doping of Co atomsto the Fe sites does not change the lattice parameters much [21].However, the hole doping of K atoms to the Ba sites causesthe lattice parameter of a to decrease and that of c to increase085129-1 2017 American Physical Society
HITOSHI YAMAOKA et al.PHYSICAL REVIEW B 96, 085129 (2017)monotonically [22,23]. In BaFe2 As2 the As-Fe-As bond angleis about 111 which is larger than the ideal tetrahedral bondangle of 109.47 . The ideal tetrahedral bond angle correspondsto the K-doping content of x 0.3–0.5 in Ba1 x Kx Fe2 As2 ,where high Tc was observed. The pressure-temperature phasediagram of BaFe2 As2 has been studied by x-ray diffraction andsynchrotron Mössbauer spectroscopy (SRS) under pressure[24]. The results suggested that Fe 2 exhibits mesoscopic spinmoments right before the structural transition decreases intemperature and the local moments involving the fluctuationalthough the nematic phase was not detectable due to theproblem of the time scale of SRS. Interaction of the electronspins, thus, plays a role in the origin of superconductivity inpnictides. However, the spin states of the doped systems ofAFe2 As2 have still not been explored systematically.An x-ray absorption spectroscopy (XAS) study was performed at the Fe-K edge for the hole-doped system ofBa(Fe1 y Coy )2 As2 [25]. The XAS spectra did not show aremarkable change through the temperature-induced phasetransitions, but pressure lead to slight energy shift of the mainedge not the pre-edge. However, XAS at the As K edge showedthe strong sensitivity of the As electronic structure uponelectron doping with Co or pressure change in BaFe2 As2 atroom temperature [26]. These results indicated the prominentrole of the As-4p orbitals in the electronic properties of theFe pnictide superconductors. These studies motivate us toperform a systematic x-ray spectroscopy study by extendingthe systems to not only the hole-doped BaFe2 As2 , but alsothe electron-doped BaFe2 As2 and SrFe2 As2 at the Fe andAs K-absorption edges. A systematic study of the electronicstructures of the doped BaFe2 As2 and SrFe2 As2 has beenreported by XAS at L2,3 absorption edge [27,28]. Although theshift in the energy position of the L3 edge observed maximumpeak, the study indicated that the doping plays a lesser rolefor pnictide superconductivity and magnetism. We note thatthe XAS study at the Fe and As K-absorption edges wasadvantageous because we now know the spin state and the d-phybridization, respectively.A pressure-temperature phase diagram of the crystal structure of SrFe2 As2 is similar to that of BaFe2 As2 [29,30].The detailed XRD study indicated that the paramagnetic toantiferromagnetic and tetragonal to orthorhombic structuraltransitions were coupled at 205 K at ambient pressure, andtwo transitions were concurrently suppressed to much lowertemperatures near a quantum critical pressure of approximately4.8 GPa where the antiferromagnetic state transforms into abulk superconducting state [31]. This suggested that both thelattice distortions and magnetism strongly correlated to theappearance of the superconductivity under pressure. The T cT structural transition was observed around 10 GPa atroom temperature [15,32]. The nuclear resonant inelastic x-rayscattering showed that the partial density of states of SrFe2 As2changed dramatically at approximately 8 GPa. This could beassociated with the T cT isostructural transition [32].In BaFe2 As2 and SrFe2 As2 no superconductivity has beenobserved; however, the chemical substitution or pressureinduced the superconductivity. The electronic structure including the spin state as well as the crystal structure mayplay an important role in the emergence of superconductivity.In this paper we report a systematic study of the chemicalcomposition dependence of the electronic structures and spinstates of electron- and hole-doped BaFe2 As2 : Ba1 x Kx Fe2 As2and Ba(Fe1 y Coy )2 As2 . Pressure could tune superconductingstates without introducing local disorder in comparison tochemical doping. We also study pressure-induced change inthe electronic structure of BaFe2 As2 and SrFe2 As2 . We employthe Fe and As Kβ x-ray emission spectroscopy (XES) asa bulk-sensitive probe of the electronic structure. The XESmethod allows us to study the electronic structure underpressure, where the photoelectron spectroscopy cannot beapplicable. It is known that the Fe Kβ spectrum consistsof two components of a strong Kβ1,3 component and aweak satellite of Kβ component, corresponding to mainlylow-spin and high-spin state, respectively [33,34]. Change inthe intensity of the Fe Kβ spectra, so-called integrated absolutedifference (IAD) value, is a measure of spin state as well as themagnetic moment [19,35–37]. The x-ray absorption spectrawith partial fluorescence yield mode (PFY-XAS) [38–40] werealso measured. The pre-edge, prepeak, and shoulder structuresat the absorption edge of the PFY-XAS spectra reflect thehybridization strength of Fe 3d and As 4p. In Fe-basedsuperconductors it has been considered that Fe d electronsplay an important role through the orbital fluctuations for theemergence of the superconductivity. We emphasize that it isan advantage that we could know the electronic state of Fe delectrons from the pre-edge peak of the XAS spectra at theFe-K absorption edge.II. EXPERIMENTS AND METHODSHigh-quality single crystals and polycrystals ofBa1 x Kx Fe2 As2 , Ba(Fe1 y Coy )2 As2 , and SrFe2 As2 wereprepared. The results of the XRD in Figs. 2(d) and 2(e) andthe PFY-XAS spectra in Figs. 6–8 at the As K-absorptionedge were the data for the polycrystals and the other resultswere for the single crystals. Polycrystalline samples ofBa1 x Kx Fe2 As2 were annealed 24 or 48 h at 790–850 C andthose of Ba(Fe1 y Coy )2 As2 were annealed at 880–900 C.X-ray diffraction study was performed for the polycrystallinesamples of the Ba122 systems using a laboratory x-ray source.The SrFe2 As2 single crystals were grown using the self-fluxmethod [41].Measurements of the PFY-XAS and XES were performedat the Taiwan beamline BL12XU, SPring-8 [42,43] and at 16ID-D beamline of the APS, ANL. At BL12XU of the SPring-8the undulator beam was monochromatized by a cryogenicallycooled double crystal Si(111) monochromator. A Johann-typespectrometer equipped with spherically bent analyzer crystals(radius of 1 m) of Si(531) for Fe Kβ emission and Si(844)for As Kβ emission. A Si solid state detector (Amptech) wasused to analyze the Fe emission of the 3p 1s deexcitation atthe Fe and As K-absorption edges. We used the Kβ emissionof As, instead of the Kα emission [26], because the As 3pelectrons may be more correlative to the outer shell electronscompared to the 2p electrons. At the emitted photon energyof 7.6 keV the overall energy resolution was estimated tobe 0.9 eV. Here, it is noted that one can discuss the relativechange in the energy on the order of 0.1 eV, which is one orderof magnitude as small as the energy spread of the analyzer.The intensities of the measured spectra were normalized085129-2
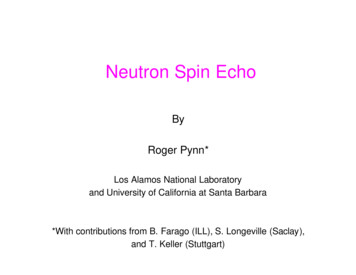
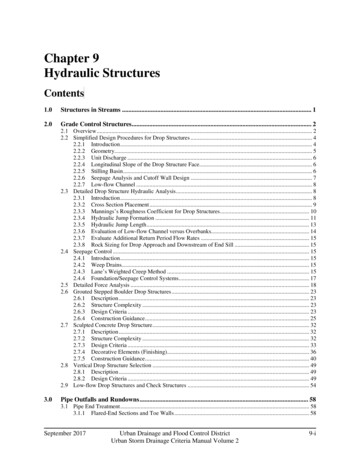
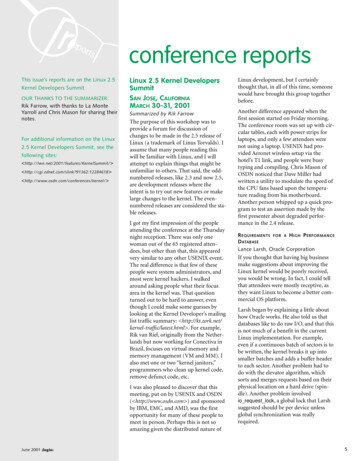
ELECTRONIC STRUCTURES AND SPIN STATES OF BaFe . . .using the incident beam that was monitored just before thesample.For the high-pressure experiments in the x-ray emissionspectroscopy at SPring-8 the x-ray beam was focused to 20–30(horizontal) 30–40 (vertical) μm2 at the sample positionusing a toroidal and a Kirkpatrick-Baez mirror. High-pressureconditions were achieved at room temperature using a diamondanvil cell coupled with a gas membrane. A Be-gasket 3 mm indiameter and approximately 100 μm thick was preindentedto approximately 35–40 μm thickness around the center.The diameter of the sample chamber in the gasket wasapproximately 100–120 μm and the diamond anvil culet sizewas 300 μm. Pressure medium of Daphne oil was used forthe DAC. We used the Be gasket in-plane geometry with ascattering angle of 90 , where both incoming and outgoingx-ray beams passed through the Be gasket. Pressure wasmonitored by the ruby fluorescence method [44–46]. Weperformed high-pressure experiments to find the pressurerange where superconductivity appears and further pressurebeyond.Measurements of the PFY-XAS at the Fe K-absorption edgeand Fe-Kβ XES for SrFe2 As2 were performed at 16-ID-D,APS. An incident x-ray beam with a beam size of 30 (vertical) 50 (horizontal) μm2 in diameter (FWHM) was used forthe experiments. The incident x ray was focused onto thesample through one of the diamond anvils, and the Fe Kβemission spectra were collected by a silicon detector throughthe Be gasket and a Si(444) analyzer in the 1 m Rowland circlevertical geometry with a step size equivalent to about 0.3 eV.We used a 4 in. Si (333) analyzer to measure the PFY-XASspectra at Fe Kα1 peak. Pressure medium of Ne was used forthe DAC.The IAD analysis of the Kβ XES spectra is performed inthe following way: (i) match the center of mass between thesample and reference spectra exactly, (ii) take the differencebetween them, and (iii) integrate the absolute value of thedifference. The intensity is normalized by the area of the Kβspectrum. The error of the IAD values and the pre-edge peakintensity mainly comes from the statistics of the total countsand fit errors. We increased statistics, especially for the Kβemission spectra because of the small change in the intensity.Figure 1 shows the phase diagrams of BaFe2 As2 andSrFe2 As2 with the points measured. In the doped BaFe2 As2we study the doping, chemical composition, and pressuredependences of the electronic structure. In SrFe2 As2 pressuredependence of the electronic structure at 17 and 300 K weremeasured.III. RESULTSA. BaFe2 As21. Fe Kβ XESChemical composition dependence of the Kβ XES spectraof Ba(Fe1 y Coy )2 As2 and Ba1 x Kx Fe2 As2 at 12 K is shownin Fig. 2(a) with a reference spectrum of FeCrAs; the changein the spectra seems to be small. While in BaFe2 As2 pressurechanges the spectra slightly at low temperatures as shownin Fig. 2(b). Chemical composition dependence of the IADvalues are estimated for a reference spectrum of FeCrAs, whichPHYSICAL REVIEW B 96, 085129 (2017)FIG. 1. (a) Phase diagram of Ba(Fe1 y Coy )2 As2 andBa1 x Kx Fe2 As2 with the points where the XES and XASmeasurements around the Fe K-absorption edges [21,22]. (b) Thesame phase diagram as (a) with the measured points at the AsK-absorption edge. (c) A P -T phase diagram of SrFe2 As2 with themeasured points around the Fe K-absorption edge [30,31].is known to have a low-spin state without magnetic moment[36], as shown in Fig. 2(c). Additionally, we show the chemicalcomposition dependence of the lattice constants measured forthe sample here (closed symbols) with the data taken fromthe literature (open symbols) [21,23] in Fig. 2(d). The ratioof the lattice constants a to c is plotted in Fig. 2(e). Presentdata of the lattice constants and the ratio show good agreementwith the previous data. The ratio seems not to show anomalousfeatures. It is noted that the change in the lattice constant in theCo substitution is very small, a 0.002 Å, c 0.06 Å,while in the K substitution a 0.115 Å, c 0.8 Å in themeasured substitution range. Both the electron and hole dopingto BaFe2 As2 show a trend of increase in the IAD values.Temperature dependence of the Kβ XES spectra ofBaFe2 As2 at 0 GPa, BaFe2 As2 at 3 GPa, Ba(Fe0.92 Co0.08 )2 As2at 0 GPa, and Ba0.45 K0.55 Fe2 As2 at 0 GPa are shown inFigs. 3(a)–3(d). The y 0.08 and x 0.55 samples correspond to the compositions where Tc takes a maximum.Temperature dependence of the IAD values are summarized in Fig. 3(e). At ambient pressure the IAD values ofBa(Fe0.92 Co0.08 )2 As2 and Ba0.45 K0.55 Fe2 As2 decrease slightlywith decreasing the temperature.The pressure decreases the IAD value in BaFe2 As2 at300 K as shown in Fig. 3(e). This result is consistent withthe previous ones where pressure induced the spin statefrom higher- to lower-spin states [43,47]. In BaFe2 As2 the085129-3
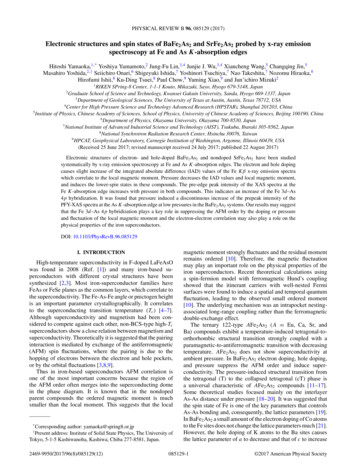
HITOSHI YAMAOKA et al.PHYSICAL REVIEW B 96, 085129 (2017)FIG. 2. (a) Kβ x-ray emission spectra of Ba(Fe1 y Coy )2 As2 andBa1 x Kx Fe2 As2 with a reference spectrum of FeCrAs. (b) Those ofBaFe2 As2 at 0 and 3 GPa. (c) The IAD values (left vertical axis)of Ba(Fe1 y Coy )2 As2 and Ba1 x Kx Fe2 As2 with the phase diagram.Closed circle and closed square correspond to the measurement at 0and 3 GPa, respectively. Note that the horizontal scale of y is multiplied by a factor of 10. (d) The lattice constants of Ba(Fe1 y Coy )2 As2and Ba1 x Kx Fe2 As2 , where closed and open symbols correspondto the data taken in these experiments and from the literature,respectively [21,23]. (e) The ratio of the lattice constants a to c, whereclosed and open symbols are present and previous data, respectively.temperature-induced change in the IAD values are not clearlyobserved at 3 GPa, where the superconductivity observed.2. PFY-XAS at Fe K -absorption edgeChemical composition and pressure dependences of thePFY-XAS spectra are shown in Figs. 4(a) and 4(b), respectively. A fit example of the PFY-XAS spectrum of BaFe2 As2FIG. 3. Temperature dependence of the XES spectra of(a) BaFe2 As2 at 0 GPa, (b) BaFe2 As2 at 3 GPa,(c) Ba(Fe0.92 Co0.08 )2 As2 at 0 GPa, and (d) Ba0.45 K0.55 Fe2 As2at 0 GPa with the difference for a reference spectrum of FeCrAs(lower panels in each figure). Temperature dependence of the IADvalues are shown in (e).at 12 K is shown in Fig. 4(c), assuming two components of thepre-edge peak [48] and other components with an arctanlikebackground for simplicity. The pre-edge peak intensity andthe ratio of the two components are shown in Fig. 4(d).The intensity of the pre-edge peak of the doped samplesat x 0.5 and y 0.12 is larger than that of nondopedBaFe2 As2 . However, the chemical composition dependenceof the pre-edge peak intensity and the ratio is not clear. Onthe other hand, pressure increases the intensity of the pre-edgepeak largely, suggesting the increase of the p-d hybridization.085129-4
ELECTRONIC STRUCTURES AND SPIN STATES OF BaFe . . .FIG. 4. (a) Chemical composition dependence of the PFY-XASspectra at 12 K and 0 GPa. (b) PFY-XAS spectra of BaFe2 As2at 0 and 3 GPa and those of Ba(Fe0.92 Co0.08 )2 As2 at 0 GPa andBa0.45 K0.55 Fe2 As2 at 0 GPa. (c) A fit example of the PFY-XAS spectrum of BaFe2 As2 at 12 K. (d) Chemical composition dependencesof the pre-edge peak intensity and the intensity ratio of P1 to P2. Aschematic figure of two superconducting and AFM regions are alsoshown, where the full vertical scale corresponds to 150 K [21,23].Temperature dependence of the PFY-XAS spectra at FeK-absorption edge of BaFe2 As2 at 0 GPa, BaFe2 As2 at 3 GPa,Ba(Fe0.92 Co0.08 )2 As2 at 0 GPa, and Ba0.45 K0.55 Fe2 As2 at 0GPa are shown in Figs. 5(a)–5(d), respectively. Temperaturedependence of the intensity of the pre-edge peak and the ratioare shown in Figs. 4(e) and 4(f). No significant temperaturedependence of the PFY-XAS spectra is observed. Our resultsagree with those for BaFe2 As2 and Ba(Fe0.935 Co0.065 )2 As2previously measured by Balédent et al. [25].PHYSICAL REVIEW B 96, 085129 (2017)FIG. 5. (a)–(d) Temperature dependence of the PFY-XASspectra of (a) BaFe2 As2 at 0 GPa, (b) BaFe2 As2 at 3 GPa,(c) Ba(Fe0.92 Co0.08 )2 As2 at 0 GPa, and (d) Ba0.45 K0.55 Fe2 As2 at 0GPa. (e) Temperature dependence of the pre-edge peak intensity.(f) Temperature dependence of the pre-edge peak intensity ratio ofP1 to P2.Temperature dependences of the PFY-XAS spectra ofBaFe2 As2 , Ba(Fe0.92 Co0.08 )2 As2 , and Ba0.6 K0.4 Fe2 As2 areshown in Fig. 7. Temperature-induced change in the electronicstructure is small for all compounds here. Additionally, theenergy of the absorption edge in Fig. 7(d) does not show asignificant temperature dependence.We also measured the pressure dependence of thePFY-XAS spectra of BaFe2 As2 , Ba(Fe0.92 Co0.08 )2 As2 , and3. PFY-XAS at As K -absorption edgeWe performed As Kβ x-ray emission spectroscopy andmeasured the PFY-XAS spectra at the As K-absorption edgebecause the above Kβ x-ray emission spectra as well as thePFY-XAS spectra at the Fe K-absorption edge only show verysmall chemical composition and temperature dependences.Figure 6(a) shows the chemical composition dependence of thePFY-XAS spectra of Ba(Fe1 y Coy )2 As2 and Ba1 x Kx Fe2 As2at the As K-absorption edge. The shift of the absorption edgeenergy is shown in Fig. 6(b) in Ba1 x Kx Fe2 As2 . The K dopingto Ba site drastically induces the increase of the intensity ofthe prepeak around 11866 eV, lowering the absorption edgeenergy, and narrowing the width of the main peak around11874 eV. This shift of the edge energy corresponds tolowering the charge state of As and electron transfer to As(i.e., hole transfer to Fe). In contrast, only little changes inthe intensity of the prepeak are observed in the case of the Cosubstitution to Fe site.FIG. 6. (a) Chemical composition dependence of the PFY-XASspectra of Ba(Fe1 y Coy )2 As2 and Ba1 x Kx Fe2 As2 at the As Kabsorption edge. (b) Chemical composition dependence of theabsorption edge energy. A schematic figure of two superconductingand AFM regions are also shown, where the full vertical scalecorresponds to 150 K [21,23].085129-5
HITOSHI YAMAOKA et al.PHYSICAL REVIEW B 96, 085129 (2017)FIG. 7. Temperature dependence of the PFY-XAS spectra of(a) BaFe2 As2 , (b) Ba(Fe0.92 Co0.08 y)2 As2 , and (c) Ba0.6 K0.4 Fe2 As2 atthe As K-absorption edge. Temperature dependence of the absorptionedge energy is also shown in (d).Ba0.6 K0.4 Fe2 As2 at 300 K as shown in Fig. 8. The intensityof the prepeak shows a discontinuous increase at 0.6 GPafor BaFe2 As2 , at 0.6 GPa for Ba(Fe0.92 Co0.08 )2 As2 , and at1.9 GPa for Ba0.6 K0.4 Fe2 As2 . While it increases monotonicallyin Ba(Fe0.92 Co0.08 )2 As2 with pressure, the shift of the As KFIG. 9. Pressure dependence of the Kβ XES spectra of SrFe2 As2(a) at 17 K and (b) at 300 K, with the difference for the spectrum at17 K and 11.8 GPa (lower panels of each figure). (c) Comparison ofthe Kβ XES spectra at 17 K and 0.81 GPa and at 300 K and 1.37 GPa.(d) Pressure dependence of the IAD values at 17 and 300 K. Aschematic figure of superconducting and AFM regions (blue-coloredarea) are also shown, where the full vertical scale corresponds to200 K [30]. A pale-red and a deep-red colored areas of the SCregions correspond to the filamentary and bulk superconductivity,respectively.edge energy does not show significant pressure dependencefor BaFe2 As2 and Ba0.6 K0.4 Fe2 As2 .B. SrFe2 As21. Fe Kβ XESThe Kβ XES spectra were measured for a sister compoundof SrFe2 As2 . Figures 9(a) and 9(b) show pressure dependenceof the Kβ XES spectra of SrFe2 As2 at 17 K and at 300 K,respectively. The difference of the intensity for the spectrumat 17 K and 11.8 GPa is also shown. Figure 9(c) shows acomparison of the spectra at 17 and 300 K at low pressures.This suggests the same trend as observed in BaFe2 As2 , thechange in the spin state to lower-spin state at low temperatures.The IAD values as a function of pressure are shown in Fig. 9(d).They show a monotonic decrease at both 17 and 300 K. TheIAD values at 17 K are always lower than those at 300 K. Theresults of SrFe2 As2 are similar to those of BaFe2 As2 .FIG. 8. Pressure dependence of the PFY-XAS spectra of(a) BaFe2 As2 , (b) Ba(Fe0.92 Co0.08 )2 As2 , and (c) Ba0.6 K0.4 Fe2 As2 atthe As K-absorption edge and 300 K. Pressure dependence of theabsorption edge energy of these compounds is also shown in (d) withthe result of SrFe2 As2 .2. PFY-XAS at Fe K -absorption edgePressure dependence of the pre-edge part of the PFY-XASspectra of SrFe2 As2 is measured at 17 K and 300 K, as shownin Figs. 10(a) and 10(b). We did not measure the spectra at the085129-6
ELECTRONIC STRUCTURES AND SPIN STATES OF BaFe . . .PHYSICAL REVIEW B 96, 085129 (2017)FIG. 10. Pressure dependence of the pre-edge part of the PFYXAS spectra of SrFe2 As2 (a) at 17 K and (b) at 300 K. (c) A fitexample of the pre-edge part of the PFY-XAS spectra at 300 K and16.1 GPa. (d) Pressure dependence of the pre-edge peak intensity(P1 P2) at 17 and 300 K. A schematic figure of superconductingand AFM regions are also shown in (d), where the full vertical scalecorresponds to 200 K [30].FIG. 11. (a) Pressure dependence of the PFY-XAS spectra ofSrFe2 As2 at As K-absorption edge and 300 K. (b) Expanded viewaround the absorption edge. (c) Pressure dependence of the absorptionedge energy of SrFe2 As2 (closed circles). A schematic figure ofsuperconducting and AFM regions are also shown, where the fullvertical scale corresponds to 200 K [30].incident energy above the absorption edge and the intensityis normalized by the area of 7115–7117 eV. A fit example isshown in Fig. 10(c). Pressure dependence of the pre-edge peakintensity at 17 and 300 K is shown in Fig. 10(d). The pressuredependence of the total intensity of the pre-edge peak at 300 Kshows a trend to increase with pressure.As-As distance decreased rapidly with pressure and changedslowly in the cT phase, while the K doping BaFe2 As2 servedthe same role of applying negative pressure along the c axis.3. PFY-XAS at As K -absorption edgeIn the doped samples of BaFe2 As2 the temperature alsodecreases the IAD values and magnetic moment gradually.Such temperature dependence of the IAD values has beenobserved in the other 122-type iron-superconductor systemsof Ca1 x REx Fe2 As2 (RE Pr and Nd) (Ref. [37]) andCa0.67 Sr0.33 Fe2 As2 (Ref. [16]) and explained later by the theorybased on first-principles calculations with scaled magneticinteraction [49].In the nondoped parent compounds the ordered magneticmoment is much smaller than the local moment [50,51]. Ithas been suggested theoretically that spatial and temporalquantum fluctuation of the local magnetic moment reduced theordered moment significantly [10,52]. The theory suggestedthat the nesting contributes the fluctuation of the local magneticmoment. The local magnetic moment is caused by the electronelectron correlation through the Coulomb interaction. In thisscenario the Co doping may cause the increase of the localmagnetic moment because the doping reduces the nestingcondition [53]. In iron-based superconductors it is known thatthe IAD values are proportional to the local magnetic moments[36,37]. In our results both the Co and K doping show a trend toincrease the IAD values, i.e., the magnetic moment, supportingthe above scenario.We show the pressure dependence of the PFY-XAS spectraof SrFe2 As2 at the As K-absorption edge and 300 K inFig. 11. The spectra shift to higher energy with pressure, almostkeeping the shape, and the energy of the absorption energyshifts monotonically with pressure as shown in Fig. 11(d). Thisindicates the increase of the charge state of As and the electrontransfer from As to other atoms with pressure. Seemingly, thereare sudden increases of the electron transfer around the pressures of 3 and 5 GPa where the filamentary superconductivityand bulk superconductivity start, respectively.IV. DISCUSSIONIn these Fe122 superconductors there are common features:the decrease of the temperature induces the structural phasetransition from tetragonal with C4 symmetry to orthorhombicphase with C2 symmetry. Parent compounds of BaFe2 As2and SrFe2 As2 do not show the superconductivity, while bothdoping and pressure induces the superconductivity at lowtemperatures. At room temperature the pressure causes the T cT isostructural transition and at low temperatures it breaksthe C2 symmetry of the orthorhombic phase with pressure. TheA. IAD values, local magnetic moment, andelectron-electron correlation085129-7
HITOSHI YAMAOKA et al.PHYSICAL REVIEW B 96, 085129 (2017)Another theory suggested that the spin state of Fe controlsthe As-As bonding and the lattice parameters in CaFe2 As2[19,54]. The theory indicated that the local magnetic momentof Fe decreases with pressure, weakening the strength of theAs-Fe bond, increasing the As-As interactions, and causingsignificant reduction in the c axis. This phenomenon has beenobserved as the T cT phase transition experimentally,which has often occurred in the Fe-122 superconductorsas described above. Pressure decreases the interlayer As-Asdistance, reaching close to the As-As covalent bond state atthe cT phase. The theory indicated that the increase of theAs-As bond strength in the cT phase weakens the correlationand decreases the local moment [19]. Experimentally pressurealso suppresses the long-range AFM order as well as the localmagnetic moment through the increase of
1 xK xFe 2As 2 were annealed 24 or 48 h at 790-850 C and those of Ba(Fe 1 yCo y) 2As 2 were annealed at 880-900 C. X-ray diffraction study was performed for the polycrystalline samples of the Ba122 systems using a laboratory x-ray source. The SrFe 2As 2 single crystals were grown using the self-flux method [41].