Transcription
scandinavian sport studies forum issnvolume ten, 2019, 139–162 söderström, brusvik & lund 2019www.sportstudies.org2000-088xFactors underlyingcompetitive successin youth footballA study of the Swedish national U15football talent systemTor Söderström1, Peter Brusvik1 & Stefan Lund 2Department of Education, Umeå University, Sweden; 2Department ofEducation and Teachers’ Practice, Linnaeus University, SwedenAuthor contact tor.soderstrom@umu.se 1AbstractThis study of Sweden’s 24 football districts analyses whether contextual factors(number of players, number of elite teams, and number of elite players on eachdistrict team) influence the district teams’ relative age effect (RAE) and the wayin which contextual factors and RAE correlate with the U15 teams’ competitivesuccess. The analysis is based on register data on district players (4,516 girls and4,501 boys, all 15 years old) who attended an annual elite football camp: birthdate, the total number of players aged 15, club membership, senior elite clubs,proportion of elite players on the district teams, and match outcomes. Based onthe birthdates of the players born between 1986 and 1997, a relative age index wasconstructed for each district. The results showed a relative age effect (RAE) forthe selected district players (boys and girls) compared to the general 15-year-oldfootball population; however, birthdate only affected the competitive success ofthe boys’ district teams. The analysis points out that contextual factors such asthe number of football players and the presence of elite clubs are important toconsider in order to understand how RAE is produced and its relationship tothe success of winning matches for boys’ district teams.Keywords: talent identification, football, relative age, RAE, performance,gender, youth, elite139
TOR SÖDERSTRÖM, PETER BRUSVIK & STEFAN LUNDIntroductionOne variable that has been associated with sport participation, talentidentification, and talent selection is the relative age effect, RAE (Côté,MacDonald, Baker, & Abernethy, 2006). In team sports such as football(soccer), research has shown that both professional league players andyoung players selected for talent groups are predominantly born earlyin the competitive year (e.g., Cobley, Baker, Wattie & McKenna, 2009;Gibbs, Jarvis & Dufur, 2012; Guiterrez Diaz Del Campo, Pastor Vicedo,Gonzales Villora & Contreras Jordan, 2010; Musch & Grondin, 2001;Romann & Fuchslocher, 2011; Schorer, Wattie & Baker, 2013; SierraDiaz, Gonzalez-Villora, Pastor-Vicedo & Sierra-Olivares, 2017). Becauserelatively older players have advantages that are sustained throughout theirathletic career and skill development (e.g., better training opportunitiesand better educated/more experienced coaches), they are more likely toexperience success in their sport (Baker, Schorer, Cobley, Schimmer &Wattie, 2009; Hollings, Hume & Hopkins, 2012, Hancock, Adler &Côté, 2013). The close relationship between RAE and talent identificationin youth football could help explain the uneven birthdate distributionin senior professional football (Takacs & Romann, 2016). For example,a study in Argentina showed that RAE is associated with male players’chances of reaching the A-league (Gonzalez Bertomeu, 2016). However,several studies have shown that RAE becomes weaker as players becomeolder (Helsen, Van Winckel & Williams, 2005), a trend that is true for bothboys (Jimenez & Pain, 2008; van den Honert, 2012) and girls (Delorme,Boiché, & Raspaud, 2010a; Grossman & Lames, 2013).RAE could be a consequence of the conditions in specific regionssuch as the pool of participants in relation to the available spots on ateam (Musch & Grondin, 2001) or the opportunities associated withan elite environment (Guiterrez Diaz Del Campo et al., 2010). Whileacknowledging that this line of research has advanced our knowledge,we argue that some factors and contexts have been overlooked. Althoughresearch on RAE has been extensive, the research on RAE in girls’ sportsis limited (Smith, Weir, Till, Romann, & Cobley, S. 2018), especiallyin football (Sierra-Diaz et al., 2017). Therefore, many researchers havecalled for more RAE research that focuses on female athletes (e.g.,Musch & Grondin, 2001; Smith et al., 2018). Although many studiesacknowledge that the RAE exists in different sports and ages (e.g., Takacs& Romann, 2016), in school sport specialisation programmes (Saether,140scandinavian sport studies forum volume ten 2 019
FACTORS UNDERLYING COMPETITIVE SUCCESS IN YOUTH FOOTBALLPeterson & Matin, 2017), in achieving expertise (e.g., Côté et al., 2006),or in relation to physical advantages (e.g., Gil et al., 2014), few studieshave investigated the link between RAE and sport performance – i.e.,whether teams with higher RAE win more matches than teams withlower RAE. The few studies that have investigated a link between teamswith higher RAE and increased competitive edge are rather inconclusiveas they reveal relationships as well as non-relationships (e.g., Augste &Lames 2011; Grossman & Lames, 2013; Kirkendall, 2014). Similarly, fewstudies have explored how RAE covaries with regional contextual factorsand affects a team’s competitive performance either in winning matchesor tournaments.Drawing on data from a project that investigates the national U15talent development program for girls and boys playing on district teamsin Sweden, we examine: a) how contextual factors (i.e., number ofplayers, number of elite teams, and number of elite players on each districtteam) influence RAE for girls and boys participating in the special talentprogramme that the Swedish Football Association carries out to bothidentify talent and enable player development in the 24 football districtsin Sweden; and b) the way in which these contextual factors and RAEcorrelate with the U15 girls and boys team’s success in winning matches.Literature reviewSeveral analyses have been developed to help researchers understandhow RAE is produced and how RAE affects the way coaches identify themost talented football players. In the following, we discuss four mainareas where RAE operates.First, many researchers suggest that coaches identify individuals bornearly in the competitive year as potentially elite performers becausethese players are more physically and mentally mature than individualsborn later in the competitive year (e.g., Smith, Weir, Till, Romann &Cobley, 2018). That is, these studies posit that individuals born early inthe competitive year have acquired maturational advantages, resultingin a greater chance of being selected for talent groups or similar elitedevelopment systems than those born later in the year (e.g., Augste& Lames, 2011; Guiterrez Diaz Del Campo, Pastor Vicedo, GonzalesVillora & Contreras Jordan, 2010; Helsen, van Winckel & Williams,2005; Helsen et al., 2005; Hollings, Hume & Hopkins, 2014). Althoughscandinavian sport studies forum volume ten 2019141
TOR SÖDERSTRÖM, PETER BRUSVIK & STEFAN LUNDthere seems to be strong evidence of a link between RAE (i.e., physicaladvantages) and how talent is selected for a team, existing research showsboth weak and strong associations. Depending on the sample used (e.g.,younger or older players or selected talent or team players), studies haveshown that relatively younger football players in an age cohort performworse on physiological tests (Gil et al., 2014; Votteler & Höner, 2014)and that more mature U15 players had higher match running performance(Buchheit & Mendez-Villanueva, 2014). Fragaso, Massuca, and Fererira(2015) found that physical fitness in U15 male football players correlatesto biological maturation. On the other hand, studies have also foundthat there are no differences regarding physical components (Carling,le Gall, Reilly & Williams, 2009; Deprez, Vaeyens, Coutts, Lenoir &Phillipaerts, 2012) or anaerobic performance based on date of birth(Deprez et al., 2013; Skorski, Skorski, Faude & Hammes, 2016). Onepossible explanation for these results is that those relatively youngermight have been selected due to early maturation (see Skorski et al.,2016). Similarly, the few studies that have investigated whether teamswith higher RAE win more matches than teams with lower RAE havefound both weak and strong associations. Kirkendall’s study (2014) ofgirl and boy U11-U16 football players, which focused on match outcomeand the players’ birth month, found no relationship between RAE andmatch outcomes. On the other hand, a study of 41 German U17 firstleague player squads found that the final league rank of the U17 teams(i.e., their success of winning matches) was related to RAE (Augste &Lames 2011; Grossman & Lames, 2013). Clearly, this issue has not beensettled.Second, when comparing football players with the general population,research has found a significant RAE effect (e.g., Grossman & Lames,2013; Sedano, Vaeyens & Redondo, 2015). A study of first-, second-, andthird-division female Spanish players, comparing them to the generalSpanish population, showed that the players in the first and seconddivisions, but not the third, were overrepresented by players born in thefirst quarter of the year (Sedano, Vaeyens & Redondo, 2015). However,the use of general population as a comparison in these studies may haveintroduced measurement errors due to deviations from the actual footballpopulation (Sierra-Diaz et al., 2017). Delorme, Boiché, and Raspaud(2010a), however, found that the total female football population(players from 8 to 17 years old) in France had an overrepresentation ofplayers born in the first and second quarters of the year compared with142scandinavian sport studies forum volume ten 2 019
FACTORS UNDERLYING COMPETITIVE SUCCESS IN YOUTH FOOTBALLthe national birth statistics. The study further showed that the dropoutof players (10, 14, and 17 years old) is related to RAE. Similarly, a studyof all male French football players showed that for all ages there was anoverrepresentation in the first and second quarters of the year comparedto national birth statistics (Delorme, Boiché & Raspaud, 2010b; 2010c).Third, research has also found that RAE is a consequence of contextualconditions in a region such as the pool of participants (Musch &Grondin, 2001), available spots on a team (Schorer et al., 2015), and theexistence of elite teams in a region (Guiterrez Diaz Del Campo et al.,2010). Musch and Grondin (2001) showed that a larger pool of players,because of competition, results in stronger RAE on a team (cf. view onenvironmental constraints by Wattie, Schorer & Baker, 2015). Similarly,Finnegan, Richardson, Littlewood and McArdle’s (2017), in a study ofhow the Irish national football association’s elite development programmeselects players, found that RAE was stronger for players (aged 14-17)living in more densely populated areas. Other researchers have come tosimilar conclusions concerning successful talent development (Larsen,Alfermann, Henriksen & Christensen, 2013) and the effects of totalpopulation on sporting success in a country (De Bosscher, De Knop,Van Bottenburg & Shibli, 2006). Another contextual condition that isimportant for understanding RAE is the impact of an elite environment.Findings from comparisons between non-elite and elite youth teamsshowed that the elite samples had higher RAE (e.g., Guiterrez DiazDel Campo et al., 2010; Musch & Grondin, 2001; Sedano et al., 2015;Grossman & Lames, 2013). Studies have also found that the relationshipbetween RAE and teams’ final rankings disappears if elite and amateurclubs are analysed separately (Grossman & Lames, 2013). In their studyof football in Denmark, Rossing, Nielsen, Elbe and Karbing (2016)found that the location of elite clubs likely influences the probability ofyouths developing into elite players. Similarly, De Bosscher et al. (2006)highlight that on a national level elite sport culture – e.g., an emphasison high-performance sport as well as high levels of training and trainingopportunities – influences sport success in a country.Fourth, although studies have revealed that RAE is apparent in youthfootball in many parts of the world, research on RAE in girls’ sports islimited (Smith et al., 2018), especially in football (Sierra-Diaz et al., 2017).Results from research carried out on girls’ RAE is not as unanimous asfor boys’ RAE (e.g., Guiterrez Diaz del Campo et al., 2010; Helsen etal., 2005; Romann & Fuchslocher 2011, Schorer et al., 2015; Sierra-Diazscandinavian sport studies forum volume ten 2019143
TOR SÖDERSTRÖM, PETER BRUSVIK & STEFAN LUNDet al, 2017). For example, a study of female players from U15 and U17 inAustralia (van den Honert, 2012) and U17 in the US (Vincent & Glamser,2006) showed that there was no RAE. Moreover, a study showed thatRAE did not exist at the U17 World Championships for girls from Asia,Oceania, and South America (Romann & Fuchslocher, 2013). The lackof RAE effects in these studies could be explained by the fact that inthese countries female football players have less competition for placescompared to their male counterparts (Romann & Fuchslocher, 2013; vanden Honert, 2012) or by the fact that girls physically mature earlier thanboys, a circumstance that reduces age performance differences (Vincent& Glamser, 2006). On the other hand, a study of Swedish playersparticipating in the Football Association’s competitions for the U15district team found that it is four times as likely for girl and boy playersborn during the first quarter to be selected for Sweden’s U16 nationalteam compared to those born in the last quarter (Peterson, 2011).The literature review shows that research on birthdate and maturationaladvantages is contradictory. There is relatively strong evidence thatcontextual factors such as the pool of participants in a specific district,access to elite environments, and the number of elite players in a regionare related to increased RAE effects. Furthermore, the connectionbetween RAE and different contextual factors and performance (winningmatches) is still largely unexplored, especially in comparative studies ofgirls and boys who participate in a national talent development system.In light of this literature review, our study of boys and girls U15 districtteams (players born 1986–1997) will contribute to the discussion oncontextual factors that influence how talent is identified and whether thisselection process influences the competitive success of district teams.MethodThis study uses register data provided by the Swedish FootballAssociation. The data, collected from Sweden’s 24 football districts,includes information about all boys and girls who played organizedfootball between 2001 and 2012 (i.e., all players born between 1986 and1997).1 These 24 districts are divided according to geographical region.1144Given that changes in the talent development system (a new national playerdevelopment programme) were introduced by the Swedish Football Association in2013, we refer to the situation during the period 2001-2012.scandinavian sport studies forum volume ten 2 019
FACTORS UNDERLYING COMPETITIVE SUCCESS IN YOUTH FOOTBALLBecause the most populated areas in Sweden are in the south, there aremore football players in districts located in southern areas. Every yeareach of the 24 districts identifies 16 boys and 16 girls from local clubsin the region with the potential to develop into elite football players.These district teams (i.e., regional teams), which consist of 15-year-olds,play against each other at an annual elite training camp. The players onthe district teams serve as the recruiting base for building not only thenational U15 teams (Peterson, 2011) but also future senior elite teams.The districts use a successive selection process, which starts when theplayer is 13 years old and includes training and education camps that aregenerally open to anyone who wants to participate. These camps (about1-3 days) are carried out a couple of times each year. All districts have abase structure that includes a district captain responsible for the team. Inmost of the districts, there is also a goalkeeper captain. In addition, thereare zone instructors or local talent developers who are responsible for thetraining sessions and have a role in the player selection process. Whenthe players are 14 years old, the zone instructors and district associationmanagers choose the players they believe to be the most talented. Fromthese 14-year-old boys and girls (30-40 from small districts to over 100from large districts), players are selected and invited by the district tofuture training camps. From this selected group, the pool of players isultimately reduced to the 16 players who will form the U15 district teamand participate in the national annual elite training camp the summerthey will be 15 years old.Participants and procedureThe study was based on girls and boys who attended the elite camp atage 15 and was approved by the regional ethics review board (2018/68-31).Between 2001 and 2012, 4,608 boys and 4,608 girls played on districtteams (384 girls and boys each year). The data set included birth, district,and club of each player. Due to incorrect registration by the districts, notall players’ birthdates and club participation were classified. Birthdatedata for each player were found for 4,516 girls (92 missing) and 4,501boys (107 missing), and club data for each player were found for 4,556girls (52 missing) and 4,486 boys (122 missing).The districts were, in relation to number of players at age 15, dividedinto four categories: small (girls n 145 and boys n 222) , medium (girlsn 184-280 and boys n 282-370), large, (girls n 314-377 and boys n 459-scandinavian sport studies forum volume ten 2019145
TOR SÖDERSTRÖM, PETER BRUSVIK & STEFAN LUND469) and extra-large (girls n 682 and boys n 883) (Table 1). However,the number of players in each category differs between girls and boys inrelation to average number of players (the football population); that is, alarge district for girls is not necessarily a large district for boys.The districts’ birthdate distributionBased on birthdate distribution for players born between 1986 and 1997,a RAE index was calculated for each district. The index was calculatedbased on the number of players born in each quarter in relation to thetotal (16) players on the team (Calculation (([Q1]*4) ([Q2]*3) ([Q3]*2) ([Q4]*1))/[Total]). The indexes for all years were added anddivided by 12 (years), resulting in a RAE index for each district between2001 and 2012: 4 reflects the fact that all 16 players on the team (100%of the players) were born in the first quarter (January-March) while 1reflects the fact that 100% of the players were born in the last quarter(October-December).District performanceThe elite camp included matches between district teams, and the results(3 points for a win, 1 for a draw, and 0 for a loss) of these matches servedas a proxy for district performance. Between 2001 and 2012, 33 matchesfor boys and 36 matches for girls were registered for each district (theboys played only two matches between 2003 and 2005 instead of three),which gave a total score for each district.Elite environment in the districtsTo capture the influence of the senior elite team in a district, an elite teamdistrict index for women and men was calculated based on the sum of thenumber of elite teams in the two highest divisions for each year between2001 and 2012 divided by 12 (years). Data on senior elite teams in thetwo highest division were provided by the Swedish Football Association.The players were categorized as belonging to an elite club if at the age of15 they played on a club in one of the two highest divisions. However,for girls, the second division consisted of two series, a north and southdivision (in 2013 the organisation was changed to two national series).Birthdate distribution of the football and Swedish populationThe study included data for the total football population in each district– i.e., birthdates for all 15-year-old football players (162,185 boys and146scandinavian sport studies forum volume ten 2 019
FACTORS UNDERLYING COMPETITIVE SUCCESS IN YOUTH FOOTBALL87,086 girls born between 1986 and 1997) in Sweden from 2001 to 2012.These birthdates for all 15-year-old football players were provided by theSwedish Football Association. A RAE index for the football populationwas calculated each year for each district based on the same calculationas for the district teams. Further, the study also included national birthstatistics for 675,080 boys and 640,326 girls born between 1986 and 1997provided by Statistics Sweden (SCB).Statistical analysisChi-square tests were used to compare groups (girls and boys) withrespect to date of birth quarter (observed and expected distributions,degrees of freedom 3 for comparisons of birth quarters). Spearman’srank correlation coefficient (two-tailed) was, for girls and boys, used tomeasure statistical dependence between the RAE index in the footballpopulation and the district teams year 2001-2012, and between districtvariables (i.e., match outcome, RAE, football population, senior eliteclubs and proportion of elite players in the teams). Values for strength ofcorrelations were, strong 0.7, moderate 0.4 – 0.6 and weak 0.1-0.3 (seeAkoglu, 2018). The level of significance taken into account was p 0.05.The football population (licensed football players) was excluded from thenational birth statistics, and the district team population was excludedfrom the football population to avoid distribution measurement errors(cf. Delorme, 2010b; Sierra-Diaz et al., 2017). All statistical analyses wereperformed using IBM SPSS Statistics version 24.0.ResultsWe present the results in three steps. In the first step, we describe somebackground information on the RAE in Swedish football and how thiseffect increases when coaches select players for the district teams. In thesecond step, we describe RAE indexes and the contextual factors in the24 district teams. In the final step, we analyse whether contextual factorsin the district and the RAE index for the boys’ and girls’ teams affect thematch results at the elite camp at age 15.scandinavian sport studies forum volume ten 2019147
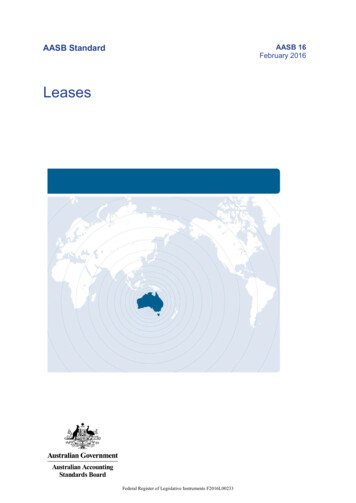
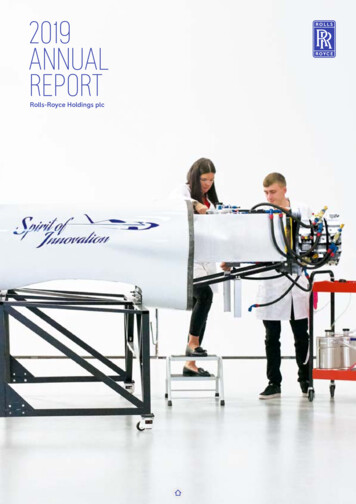
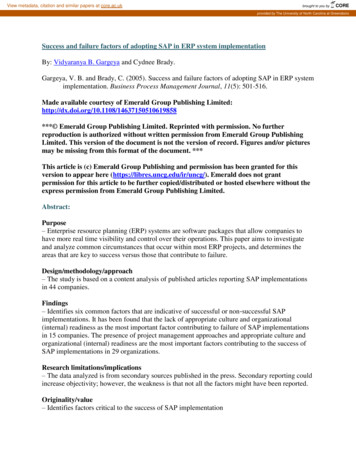
TOR SÖDERSTRÖM, PETER BRUSVIK & STEFAN LUNDRelative age effects in Swedish footballThe analysis of birthdate distributions shows that 57% of the boys and56.9 of the girls in the football population compared to 52% of the boysand 52.6 of the girls in the national population were born in the firsttwo quarters of the year (Figures 1 and 2). The birthdate distribution ofthe boys’ and girls football population is significantly different from thenational population (boys c2 1601.1; p 0.01; girls c2 759.4; p 0.01).figure 1. Birthdate distribution (%) for boys football population and nationalpopulation, 1986-1997.figure 2. Birthdate distribution (%) for girls football population and national population,1986-1997.148scandinavian sport studies forum volume ten 2 019
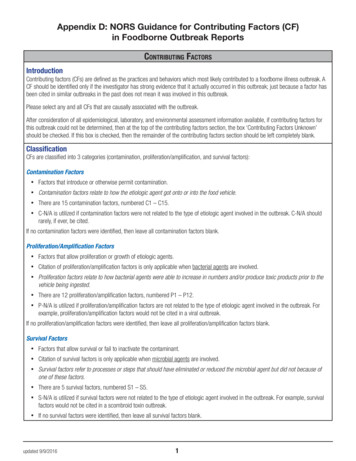
FACTORS UNDERLYING COMPETITIVE SUCCESS IN YOUTH FOOTBALLIn other words, at the age of 15, football players (regardless of level) aremore likely to have been born early in the year and this pattern increaseswhen district coaches select district players for elite camps (Figures 3 and4).figure 3. Birthdate distribution (%) for the boys football population and district team population, 1986-1997.figure 4. Birthdate distribution (%) for the girls football population and district teampopulation, 1986-1997.scandinavian sport studies forum volume ten 2019149
TOR SÖDERSTRÖM, PETER BRUSVIK & STEFAN LUNDWhen the district team players are compared with the total football population of 15-year-old players, the results show differences in birthdatedistributions (Figures 3 and 4). Of the district players who participated in the elite camps between 2001 and 2012, a majority of both boys(71.8%) and girls (64.1%) were born during the first two quarters of theyear. The birthdate distribution of those district players participating inthe elite camps is statistically different from the total football population(boys, c2 516.6; p 0.01 and girls, c2 117.7; p 0.01).figure 5. RAE Index football population and district teams 2001-2012 (boys).figure 6. RAE Index football population and district teams 2001-2012 (girls).150scandinavian sport studies forum volume ten 2 019
FACTORS UNDERLYING COMPETITIVE SUCCESS IN YOUTH FOOTBALLAn analysis of the RAE index for the district and the football populationborn between 1986 (2001) and 1997 (2012) shows that the differencesbetween the RAE indexes for each year is wider for the boys (variationbetween 0.26 to 0.49) than for the girls (variation between 0.04 to 0.21)(Figures 5 and 6).An analysis of the relationship between the RAE index for the districtand the total football populations show a statistical correlation for thegirls, but not the boys (girls, rs .788 p 0.05; boys, rs .426 p 0.05).Contextual factors and the districts’ RAEThe collected data reveal that the structural conditions differ betweendistricts in terms of average number of players, number of elite players,and number of senior elite football clubs. Table 1 illustrates the conditionsfor girls and boys in small, medium, large, and extra-large districts.Table 1. District conditions, 2001-2012 for girls and boys (the spread forthe structural conditions and M median value for each of them)Table 1 shows that there are different patterns between girls and boysand between extra-large and small districts. The extra-large boy districtswin more matches (M 59) than smaller districts (M 36), but this patternis not as evident for girls (extra-large, M 51 vs. small M 45.5). Theboys also have an increase in the RAE index between small and extralarge district teams (boys small districts M 2.92 vs. extra-large districtsM 3.19); however, this is not the case for the girls (small districts M 2.79vs. extra-large districts M 2.82). The RAE index is also higher for boysthan for girls in 21 of 24 districts. For the boys, the districts’ RAE indexvaries between 2.82 and 3.27 (M 3.04; spread 0.45). For the girls, thedistricts’ RAE index is lower compared to boys and varies between 2.60and 2.99 (M 2.84; spread 0.38).Both boys and girls have, however, a decrease in the RAE index inthe football population, from small (boys M 2.74 and girls M 2.75 )to extra-large districts (boys M 2.68 and girls M 2.68). The data alsoshow that the gap between the median RAE index value in the footballpopulation and the district teams is wider for boys (small 0.18, medium0.29, large 0.37 and extra-large 0.51) than for girls (small 0.04, medium0.12, large 0.18 and extra-large 0.14). For both girls and boys extra-largedistricts have more senior elite teams (boys M 4.25 and girls M 3.88)than small districts (boys M 0.04 and girls M 0.17), but the proportionof players from elite clubs in the extra-large district teams differs betweengirls and boys (boys M 54.3% and girls M 21.1%).scandinavian sport studies forum volume ten 2019151
TOR SÖDERSTRÖM, PETER BRUSVIK & STEFAN LUNDtable 1. District conditions, 2001-2012 for girls and boys (the spread for thestructural conditions and M median value for each of them)a) Number of districtsb) Elite index Senior elite club index in the district. Values the sum of thenumber of elite teams in the two highest divisions for each year between2001 and 2012 divided by 12 (years).c) lite players Proportion of elite players in the district teams (%).d) Football population Number of 15 year old players in the district.e) Match outcome total points at the annual elite camp (3 points for a win, 1for a draw, and 0 for a loss. In total 33 matches for boys and 36 matches forgirls)f) RAE population RAE index for the districts football populationg) RAE districts RAE index for the district teamsTaken together, Table 1 illustrates that there are differences between thedistricts regarding the recruitment base for the district teams and thatthis base also differs between boys and girls within each district.152scandinavian sport studies forum volume ten 2 019
FACTORS UNDERLYING COMPETITIVE SUCCESS IN YOUTH FOOTBALLContextual factors, RAE and performanceIn this final section, we analyse associations between contextual factorsand RAE and in what way the number of senior elite clubs in each district,the proportion of elite players on the district teams, and RAE correlatewith match outcome. For boys, there are statistically, both stronger andmore moderate, significant correlations between a district’s RAE indexand the number of 15-year-old players in the district (rs .670 p 0.01),between the RAE index and senior elite clubs in the district (rs .416p 0.05), and between the RAE index and match outcome (rs .423p 0.05) (Table 2).table 2. Spearman’s correlation coefficient for districts (Boy districts n 24)** p 0.01 (two-tailed)* p 0.05 (two-tailed)The girls, however, show a very different pattern (Table 3). There is nostatistically significant correlation between the measured contextualfactors and the district teams’ RAE index. In other words, our analysesshow that RAE in the girl’s district teams cannot be explained by thetotal football population, number of senior elite clubs, or the proportionof elite players. In addition, the RAE index cannot explain the matchperformance of the girl’s district teams.table 3. Spearman’s correlation coefficient for districts (Girl districts n 24)** p 0.01 (two-tailed)* p 0.05 (two-tailed)scandinavian sport studies forum volume ten 2019153
TOR SÖDERSTRÖM, PETER BRUSVIK & STEFAN LUNDIn summary, match outcomes for the boys are influenced by nearly all thevariables we tested, but we did not find a corresponding outcome for thegirls, a finding discussed in the next section.DiscussionThe findings suggest that the talent development system used by theSwedish Football Association fa
date, the total number of players aged 15, club membership, senior elite clubs, proportion of elite players on the district teams, and match outcomes. Based on the birthdates of the players born between 1986 and 1997, a relative age index was constructed for each district. The results showed a relative age effect (RAE) for
![05[2] Strategy competitors, competitive rivalry .](/img/2/052-strategy-competitors-competitive-rivalry-competitive-behavior-and-competitive-dynamics.jpg)