Transcription
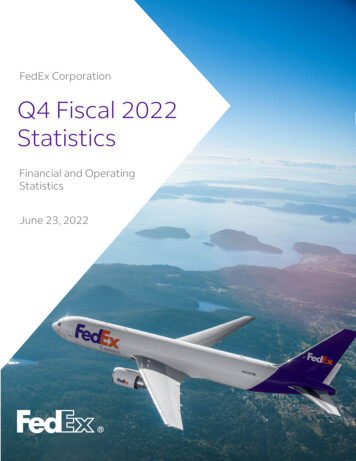
FedEx CorporationQ4 Fiscal 2022StatisticsFinancial and OperatingStatisticsJune 23, 20221
This report is a statistical supplement to FedEx’s interim financial reports and is preparedquarterly. Additional copies are available for downloading and printing atinvestors.fedex.com. For more information, write or call:Mickey Foster, Vice PresidentElizabeth Allen, DirectorStephen Hughes, DirectorJeffrey Smith, DirectorFedEx Corp. Investor Relations942 S. Shady Grove RoadMemphis, TN 38120Telephone: (901) 818-7200
TABLE OF CONTENTS FEDEX CORPORATIONOVERVIEWCONDENSED CONSOLIDATED BALANCE SHEETSCONDENSED CONSOLIDATED STATEMENTS OF CASH FLOWSANNUAL CONSOLIDATED STATEMENTS OF INCOMEQUARTERLY CONSOLIDATED STATEMENTS OF INCOMEFY2018 – FY2019FY2020 – FY2021FY2022CAPITAL EXPENDITURES12345678 FEDEX EXPRESS SEGMENTANNUAL CONSOLIDATED STATEMENTS OF INCOMEQUARTERLY CONSOLIDATED STATEMENTS OF INCOMEFY2018 – FY2019FY2020 – FY2021FY2022ANNUAL OPERATING STATISTICSANNUAL FUEL SURCHARGESQUARTERLY OPERATING STATISTICSFY2018 – FY2019FY2020 – FY2021FY2022 – FY2023QUARTERLY FUEL SURCHARGESFY2018 – FY2022JET FUEL STATISTICSAIRCRAFT AND VEHICLE FLEET STATISTICS91011121314151617181920 FEDEX GROUND SEGMENTANNUAL CONSOLIDATED STATEMENTS OF INCOMEQUARTERLY CONSOLIDATED STATEMENTS OF INCOMEFY2018 – FY2019FY2020 – FY2021FY2022ANNUAL OPERATING STATISTICSQUARTERLY OPERATING STATISTICSFY2018 – FY2023212223242526 FEDEX FREIGHT SEGMENTANNUAL CONSOLIDATED STATEMENTS OF INCOMEQUARTERLY CONSOLIDATED STATEMENTS OF INCOMEFY2018 – FY2019FY2020 – FY2021FY2022ANNUAL OPERATING STATISTICSQUARTERLY OPERATING STATISTICSFY2018 – FY2021FY2022 – FY202327282930313233Only footnotes pertaining to the current year are displayed at the bottom of pages in the statistical book. Forsupplemental information related to FY18 – FY21, please refer to the informational notes appendix.
FEDEX CORPORATIONOVERVIEWFedEx Corporation provides customers and businesses worldwide with a broad portfolio of transportation, ecommerce, and business services. With annual revenue of 94 billion, the company offers integrated businesssolutions through operating companies competing collectively, operating collaboratively, and innovatingdigitally under the respected FedEx brand. Consistently ranked among the world’s most admired and trustedemployers, FedEx inspires its 550,000 employees to remain focused on safety, the highest ethical andprofessional standards, and the needs of their customers and communities. FedEx is committed to connectingpeople and possibilities around the world responsibly and resourcefully, with a goal to achieve carbon-neutraloperations by 2040.FedEx Express invented express transportation and remains the industry’s global leader, providing rapid,reliable, time-definite delivery to more than 220 countries and territories, connecting markets that comprisemore than 99 percent of the world’s gross domestic product. Unmatched air route authorities and transportationinfrastructure, combined with leading-edge information technologies, make FedEx Express the world’s largestexpress transportation company. The FedEx Express business segment financial results include FedExCustom Critical.FedEx Ground provides low-cost, day-certain service to any business address in the U.S. and Canada, aswell as residential delivery to 100% of U.S. residences through its FedEx Home Delivery Service. FedExGround Economy, a FedEx Ground service, specializes in the consolidation and delivery of high volumes oflow-weight, less time-sensitive business-to-consumer packages.FedEx Freight is a leading North American provider of less-than-truckload (LTL) freight services across alllengths of haul to businesses and residences. Within the contiguous U.S., the company offers: FedEx FreightPriority, when speed is critical to meet a customer’s supply chain needs; FedEx Freight Economy, when acustomer can trade time for cost savings; and FedEx Freight Direct, a service to meet the needs of the growinge-commerce market for delivery of heavy, bulky products to or through the door for residences andbusinesses. FedEx Freight also offers freight delivery service to most points in Puerto Rico and the U.S. VirginIslands.FedEx Services provides sales, marketing, information technology, communications, customer service,technical support, billing and collection services, and certain back-office functions that support ourtransportation segments.Corporate, Other, and Eliminations includes corporate headquarters costs for executive officers and certainlegal and finance functions, including certain other costs and credits not attributed to our core business, aswell as certain costs associated with developing our innovate digitally strategic pillar through FedEx Dataworks.FedEx Dataworks is focused on creating solutions to transform the digital and physical experiences of ourcustomers and team members. Also included in Corporate and other is FedEx Office, which provides an arrayof document and business services and retail access to our customers for our package transportationbusinesses, and FedEx Logistics, which provides integrated supply chain management solutions, specialtytransportation, customs brokerage, and global ocean and air freight forwarding.CORPORATE HEADQUARTERS:942 S. Shady Grove RoadMemphis, TN 38120COMMON STOCK LISTING:The New York Stock ExchangeSTOCK SYMBOL:FDXCOMMON SHARES AUTHORIZED:800,000,000COMMON SHARES OUTSTANDING:259,513,685 (as of May 31, 2022)STOCKHOLDERS OF RECORD:11,467 (as of May 31, 2022)TRANSFER AGENT & REGISTRAR:ComputershareP.O. Box 505000Louisville, KY 40233-5000(800) 446-2617FISCAL YEAR END:May 31Q4 FY22 Stat Book / 1
FedEx CorporationCondensed Consolidated Balance SheetsFY 2018 – FY 2022May 31In millions (except share data).FY 2018FY 2019FY 2020FY 2021FY 2022 3,2658,4815251,07013,341 2,3199,1165531,09813,086 4,88110,10257282816,383 7,08712,06958783720,580 rrent AssetsCash and cash equivalentsReceivables, less allowancesSpare parts, supplies, and fuel, less allowancesPrepaid expenses and otherTotal current assetsProperty and Equipment, at CostAircraft and related equipmentPackage handling and ground support equipmentInformation technologyVehicles and trailersFacilities and otherLess accumulated depreciation and amortizationNet property and equipmentOther Long-Term AssetsOperating lease right-of-use-assets, netGoodwillOther assetsTotal other long-term ,6136,5444,38127,538 52,330 54,403 73,537 82,777 85,994LIABILITIES AND COMMON STOCKHOLDERS' INVESTMENTCurrent LiabilitiesCurrent portion of long-term debtAccrued salaries and employee benefitsAccounts payableOperating lease liabilitiesAccrued expensesTotal current liabilitiesLong-Term Debt, Less Current PortionOther Long-Term LiabilitiesDeferred income taxesPension, postretirement healthcare, and other benefit obligationsSelf-insurance accrualsOperating lease liabilitiesDeferred lease obligationsOther liabilitiesTotal other long-term liabilities 1,3422,1772,977—3,1319,627 9641,7413,030—3,2789,013 511,5693,2691,9233,53210,344 1462,9033,8412,2084,56213,660 2,782(1,103)(10,484)24,939Commitments and ContingenciesCommon Stockholders' InvestmentCommon stock 0.10 par value; 800 million shares auth.Additional paid-in capitalRetained earningsAccumulated other comprehensive (loss) incomeTreasury stock, at costTotal common stockholders' investment 52,330 54,403 73,537 82,777 85,994Unaudited. Differences may result due to rounding.Q4 FY22 Stat Book / 2
FedEx CorporationCondensed Consolidated Statements of Cash FlowsFY 2018 – FY 2022Years ended May 31.In millionsFY 2018 FY 2019 FY 2020OPERATING ACTIVITIESNet incomeAdjustments to reconcile net income to cash provided byoperating activities:Depreciation and amortizationProvision for uncollectible accountsOther noncash items including leases and deferred income taxStock-based compensationRetirement plans mark-to-market adjustmentsLoss on extinguishment of debtGain from sale of businessBusiness realignment costsGoodwill and other asset impairment chargesChanges in operating assets and liabilities, net of the effectsof businesses acquired:ReceivablesOther current assetsPension and postretirement assetsand liabilities, netAccounts payable and other operating liabilitiesOther, netCash provided by operating activities 4,572 540 1,286FY 2021FY 2022 5,231 ,6135,09710,1359,832INVESTING ACTIVITIESCapital expendituresBusiness acquisitions, net of cash acquiredPurchase of investmentsProceeds from sale of businessProceeds from asset dispositions and �94Cash used in investing )(3,019)72(47)FINANCING ACTIVITIESPayments on debtProceeds from debt issuancesProceeds from stock issuancesDividends paidPurchase of treasury stockOther, netCash provided by (used in) financing activitiesEffect of exchange rate changes on cashCASH AND CASH EQUIVALENTSNet (decrease) increase in cash and cash equivalentsCash and cash equivalents at beginning of periodCash and cash equivalents at end of periodUnaudited. Differences may result due to rounding.3 / Q4 FY22 Stat Book(704)3,969 3,265(946)3,265 2,319(70)171(187)2,5622,3192,2064,881(190)7,087 4,881 7,087 6,897
FedEx CorporationAnnual Consolidated Statements of IncomeFY 2018 – FY 2022Years ended May 31In millions, except EPSFY 2018FY 2019FY 2021FY 2022 35,513 42,078 nue:FedEx Express segment 36,172 37,331FedEx Ground segment18,39520,522FedEx Freight segmentFedEx Services segmentOther and eliminationsTotal Revenue6,812284,04365,450Operating Expenses:Salaries and employee benefitsPurchased transportationRentals and landing feesDepreciation and amortizationFuelMaintenance and repairsBusiness realignment costs1Goodwill and other asset impairment chargesOther2Total Operating ExpensesOperating Income3:FedEx Express segmentFedEx Ground segmentFedEx Freight segmentCorporate, other, and eliminationsTotal Operating IncomeOther (Expense) Income:Interest, netOther retirement plans income (expense)4Loss on debt extinguishmentOther, netTotal Other Income (Expense)Income Before Income TaxesProvision for Income Taxes (Benefit)FY 1,6696,6741153831,4431,070Net Income 4,572 540 1,286 5,231 3,826Basic Earnings Per Share 17.08 2.06 4.92 19.79 14.54267262261264263 16.79 2.03 4.90 19.45 14.33272265262268266Weighted Avg. Common SharesDiluted Earnings Per ShareWeighted Avg. Diluted SharesSELECTED STATISTICSOperating MarginPre-tax MarginReturn on AssetsReturn on %2.4%2.0%7.1%7.9%6.7%24.6%5.2%4.5%15.6%Dividends Paid Per Common Share 2.00 2.60 2.60 2.60 3.001-FY22 includes 278 million ( 214 million, net of tax, or 0.80 per diluted share) of costs associated with our workforce reduction plan in Europe atFedEx Express.2-FY22 annual consolidated Other operating expense amounts include a legal charge of 210 million ( 160 million, net of tax, or 0.60 per dilutedshare) related to accrued pre- and post- judgment interest incurred in connection with a legal matter involving FedEx Ground. These amounts areincluded in “Corporate, other, and eliminations”.3-FY22 amounts include integration expenses of 132 million ( 103 million, net of tax, or 0.39 per diluted share). These expenses are included in"Corporate, other, and eliminations" and FedEx Express results.4-FY22 amounts include a noncash a net loss of 1.6 billion ( 1.2 billion, net of tax, or 4.49 per diluted share) associated with our mark-to-marketretirement plans accounting adjustments.Unaudited. Differences may result due to rounding.Q4 FY22 Stat Book / 4
FedEx CorporationQuarterly Consolidated Statements of IncomeFY 2018 – FY 2019Years ended May 31In millions, except EPSFIRSTQUARTERFY 2018SECONDTHIRDQUARTER QUARTERFOURTHQUARTERFIRSTQUARTERFY FedEx Express segmentFedEx Ground segmentFedEx Freight segmentFedEx Services segmentOther and eliminationsTotal Revenue 8,4004,2451,664698215,297 9,0764,5251,67361,03316,313 9,0984,8281,613798016,526 9,5984,7971,86291,04817,314 9,2224,7991,95991,06317,052 9,6045,1421,91841,15617,824 9,0055,2611,750499017,010 9,5005,3201,95551,02717,807Operating Expenses:Salaries and employee benefitsPurchased transportationRentals and landing feesDepreciation and amortizationFuelMaintenance and repairsBusiness realignment costsGoodwill and other asset impairment chargesOtherTotal Operating 690316—2,57316,491Operating Income (Loss):FedEx Express segmentFedEx Ground segmentFedEx Freight segmentCorporate, other, and eliminationsTotal Operating Other Income (Expense):Interest, netOther retirement plans incomeOther, netTotal Other Income 36)(3,725)(9)(3,870)Income (Loss) Before Income Taxes9821,139(2,554)Provision for Income Taxes (Benefit)386364Net Income (Loss) 596 775Basic Earnings Per Share 2.22268Weighted Avg. Common SharesDiluted Earnings Per ShareWeighted Avg. Diluted Shares8741,3581,1011,177931231266242192(585) 2,074 1,127 835 935 739( 1,969) 2.89 7.74 4.23 3.15 3.56 2.83( 7.56)268268266265262261 2.19 2.84 7.59 4.15 3.10 3.51 .7%7.8%6.3%6.5%6.6%6.6%5.4%5.5%7.4%(14.3%) 0.50 0.50 0.50 0.50 0.65 0.65 0.65 0.65(1,200)260( 7.56)260SELECTED STATISTICSOperating MarginPre-tax MarginDividends Paid Per Common ShareUnaudited. Differences may result due to rounding.5 / Q4 FY22 Stat Book
FedEx CorporationQuarterly Consolidated Statements of IncomeFY 2020 – FY 2021Years ended May 31In millions, except EPSFIRSTQUARTERFY 2020SECONDTHIRDQUARTER QUARTERFOURTHQUARTERFIRSTQUARTERFY 2021SECONDTHIRDQUARTER QUARTERFOURTHQUARTERRevenue:FedEx Express segmentFedEx Ground segmentFedEx Freight segmentFedEx Services segmentOther and eliminationsTotal Revenue 8,9455,1791,90541,01517,048 9,0845,3151,84451,07617,324 8,9245,8451,738697417,487 8,5606,3941,615778217,358 9,6477,0401,826880019,321 10,3687,3441,936890720,563 10,7887,9801,836889821,510 11,2758,1322,235891522,565Operating Expenses:Salaries and employee benefitsPurchased transportationRentals and landing feesDepreciation and amortizationFuelMaintenance and repairsBusiness realignment costsGoodwill and other asset impairment chargesOtherTotal Operating 5936885106—3,28620,768Operating Income (Loss):FedEx Express segmentFedEx Ground segmentFedEx Freight segmentCorporate, other, and eliminationsTotal Operating Income 97Other Income (Expense):Interest, netOther retirement plans incomeLoss on debt extinguishmentOther, netTotal Other Income me (Loss) Before Income Taxes996572420(319)Provision for Income Taxes2511210515Net Income (Loss) 745 560 315Basic Earnings Per Share 2.86 2.15 1.21260261261 2.84 2.13 1.202622622625.7%5.8%3.2%3.3%2.4%2.4% 0.65 0.65 0.65Weighted Avg. Common SharesDiluted Earnings Per ShareWeighted Avg. Diluted Shares1,6061,4061,049361180157745( 334) 1,245 1,226 892 1,868( 1.28) 4.75 4.64 3.36 7.02262264265265 4.72 4.55 3.30 8.0%11.6% 0.65 0.65 0.65 0.65 0.65261( 1.28)2612,613SELECTED STATISTICSOperating MarginPre-tax MarginDividends Paid Per Common ShareUnaudited. Differences may result due to rounding.Q4 FY22 Stat Book / 6
FedEx CorporationQuarterly Consolidated Statements of IncomeFY 2022Year ended May 31In millions, except EPSFIRSTQUARTERRevenue:FedEx Express segmentFedEx Ground segmentFedEx Freight segmentFedEx Services segmentOther and eliminationsTotal RevenueOperating Expenses:Salaries and employee benefitsPurchased transportationRentals and landing feesDepreciation and amortizationFuelMaintenance and repairs1Business realignment costs2OtherTotal Operating ExpensesOperating Income (Loss)3:FedEx Express segmentFedEx Ground segmentFedEx Freight segmentCorporate, other, and eliminationsTotal Operating IncomeOther Income (Expense):Interest, net4Other retirement plans income (expense)Other, netTotal Other Income (Expense)Income Before Income TaxesProvision for Income TaxesNet IncomeBasic Earnings Per ShareWeighted Avg. Common SharesDiluted Earnings Per ShareWeighted Avg. Diluted SharesFY 2022SECONDTHIRDQUARTER QUARTERFOURTHQUARTER 10,9667,6772,251351,07422,003 11,6058,2642,272771,25623,474 11,3048,8002,253651,21923,641 63126 1,112 1,044 1,112 558 4.17 3.94 4.26 2.15266265261259 4.09 3.88 4.20 2.132712682652616.4%6.6%6.8%5.9%5.6%5.8%7.9%2.8% 0.75 0.75 0.75 0.75SELECTED STATISTICSOperating MarginPre-tax MarginDividends Paid Per Common Share1 - Q4 FY22 includes 60 million ( 46 million, net of tax, or 0.18 per diluted share), Q3 FY22 includes 107 million ( 82 million, net oftax, or 0.31 per diluted share), Q2 FY22 includes 44 million ( 34 million, net of tax, or 0.13 per diluted share), and Q1 FY22includes 67 million ( 52 million, net of tax, or 0.19 per diluted share) of costs associated with our workforce reduction plan in Europeat FedEx Express.2 - Q4 FY22 amounts include a legal charge of 210 million ( 160 million, net of tax, or 0.61 per diluted share) related to accrued preand post- judgment interest incurred in connection with a legal matter involving FedEx Ground. These amounts are included in“Corporate, other, and eliminations”.3 - Q4 FY22 amounts include TNT Express integration expenses of 40 million ( 32 million, net of tax, or 0.12 per diluted share). Q3FY22 amounts include TNT Express integration expenses of 29 million ( 23 million, net of tax, or 0.08 per diluted share). Q2 FY22amounts include TNT Express integration expenses of 34 million ( 26 million, net of tax, or 0.10 per diluted share). Q1 FY22amounts include TNT Express integration expenses of 29 million ( 23 million, net of tax, or 0.08 per diluted share). These expensesare included in "Corporate, other, and eliminations" and FedEx Express results.4 - Q4 FY22 amounts include a noncash net loss of 1.3 billion ( 1.0 billion, net of tax, or 3.83 per diluted share) and Q2 FY22 amountsinclude a noncash net loss of 260 million ( 195 million, net of tax, or 0.73 per diluted share) associated with our mark-to-marketretirement plans accounting adjustments.Unaudited. Differences may result due to rounding.7 / Q4 FY22 Stat Book
FedEx CorporationCapital ExpendituresFY 2018 – FY 2022Years ended May 31In millionsFY 2018FY 2019By Asset TypeAircraft and related equipmentPackage handling and ground support equipmentVehicles and trailersInformation technologyFacilities and otherTotalFY 2020 FY 2021 FY 2022 2,483814954600812 5,663 2,202777982751778 5,490 1,6289101,0569151,359 5,868 2,4511,352351816914 5,884 2,2731,7377178511,185 6,763By SegmentFedEx Express segmentFedEx Ground segmentFedEx Freight segmentFedEx Services segmentOtherTotal 3,4611,178490411123 5,663 3,550808544440148 5,490 3,5601,083539527159 5,868 3,5031,446320512103 5,884 3,6372,139319565103 6,763Unaudited. Differences may result due to rounding.Q4 FY22 Stat Book / 8
FedEx Express SegmentAnnual Consolidated Statements of IncomeFY 2018 – FY 2022Years ended May 31In millionsFY 2018FY 2019FY 2020FY 2021FY 2022Package Revenue:U.S. Overnight BoxU.S. Overnight EnvelopeTotal U.S. OvernightU.S. DeferredTotal U.S. Package RevenueInternational PriorityInternational EconomyTotal International Export Package RevenueInternational Domestic1Total Package Revenue 152 108 663 ,480 413,8401,6531778,711Freight Revenue:U.S.International PriorityInternational EconomyInternational AirfreightTotal Freight RevenueOther Revenue8346917371,4161,410Total 2 2,172 2,176 996 2,810 2,9226.0%5.8%2.8%6.7%6.4%Operating Expenses:Salaries and employee benefitsPurchased transportationRentals and landing feesDepreciation and amortizationFuelMaintenance and repairs2Business realignment costsAsset impairment chargesIntercompany chargesOtherOperating Income3SELECTED STATISTICSOperating Margin1 - International domestic revenue relates to our international intra-country operations.2 - FY22 includes 278 million of costs associated with our workforce reduction plan in Europe.3 - FY22 amounts include TNT Express integration expenses of 115 million.Unaudited. Differences may result due to rounding.9 / Q4 FY22 Stat Book
FedEx Express SegmentQuarterly Consolidated Statements of IncomeFY 2018 – FY 2019Years ended May 31In millionsFIRSTQUARTERFY 2018SECONDTHIRDQUARTER QUARTERFOURTHQUARTERFIRSTQUARTERFY 2019SECONDTHIRDQUARTER QUARTERFOURTHQUARTERPackage Revenue:U.S. Overnight BoxU.S. Overnight EnvelopeTotal U.S. OvernightU.S. DeferredTotal U.S. PackagesInternational PriorityInternational EconomyTotal International Export PackageRevenue1International DomesticTotal Package Revenue 1,7504502,2008783,0781,763770 1,7874322,2199223,1411,865815 1,8364352,2719963,2671,841793 1,9004712,3719423,3131,992877 1,8864682,3549523,3061,874850 1,9484442,3921,0603,4521,896885 1,8444332,2771,1193,3961,738806 2477495761,820731496555701,852Freight Revenue:U.S.International PriorityInternational EconomyInternational AirfreightTotal Freight RevenueOther Revenue202217201214194175167155Total 584604607954395181,3568,731 342 613 344 873 388 630 389 7694.1%6.8%3.8%9.1%4.2%6.6%4.3%8.1%Operating Expenses:Salaries and employee benefitsPurchased transportationRentals and landing feesDepreciation and amortizationFuelMaintenance and repairsIntercompany chargesOtherOperating IncomeSELECTED STATISTICSOperating Margin1 - International domestic revenue relates to our international intra-country operations.Unaudited. Differences may result due to rounding.Q4 FY22 Stat Book / 10
FedEx Express SegmentQuarterly Consolidated Statements of IncomeFY 2020 – FY 2021Years ended May 31In millionsFIRSTQUARTERFY 2020SECONDTHIRDQUARTER QUARTERFOURTHQUARTERFIRSTQUARTERFY 2021SECONDTHIRDQUARTER QUARTERFOURTHQUARTERPackage Revenue:U.S. Overnight BoxU.S. Overnight EnvelopeTotal U.S. OvernightU.S. DeferredTotal U.S. PackagesInternational PriorityInternational EconomyTotal International Export PackageRevenue1International DomesticTotal Package Revenue 1,8664792,3459563,3011,817855 1,8644572,3219803,3011,817873 1,8654592,3241,1273,4511,710810 1,6393812,0209752,9952,010544 1,8614262,2871,0963,3832,317616 2,0124352,4471,2043,6512,510658 2,0784442,5221,4183,9402,596653 5383562,074833865420492,167Freight Revenue:U.S.International PriorityInternational EconomyInternational AirfreightTotal Freight RevenueOther Revenue155146140296311334363408Total 97789586106—5401,68810,538 285 236 137 338 710 900 463 7373.2%2.6%1.5%3.9%7.4%8.7%4.3%6.5%Operating Expenses:Salaries and employee benefitsPurchased transportationRentals and landing feesDepreciation and amortizationFuelMaintenance and repairsBusiness realignment costsAsset impairment chargesIntercompany chargesOtherOperating IncomeSELECTED STATISTICSOperating Margin1 - International domestic revenue relates to our international intra-country operations.Unaudited. Differences may result due to rounding.11 / Q4 FY22 Stat Book
FedEx Express SegmentQuarterly Consolidated Statements of IncomeFY 2022Year ended May 31In millionsFIRSTQUARTERFY 2022SECONDTHIRDQUARTER QUARTERFOURTHQUARTERPackage Revenue:U.S. Overnight BoxU.S. Overnight EnvelopeTotal U.S. OvernightU.S. DeferredTotal U.S. PackagesInternational PriorityInternational EconomyTotal International Export PackageRevenueInternational Domestic1Total Package Revenue 2,1704822,6521,2313,8832,839669 2,2494742,7231,3074,0303,107706 2,2754792,7541,4224,1762,991697 432,270Freight Revenue:U.S.International PriorityInternational EconomyInternational AirfreightTotal Freight RevenueOther Revenue352361346351Total 0281,5826175151,521513604981,71911,053 567 949 520 8865.2%8.2%4.6%7.4%Operating Expenses:Salaries and employee benefitsPurchased transportationRentals and landing feesDepreciation and amortizationFuelMaintenance and repairsBusiness realignment costs2Intercompany chargesOtherOperating Income3SELECTED STATISTICSOperating Margin1 - International domestic revenue relates to our international intra-country operations.2 - Q4 FY22 includes 60 million of costs associated with our workforce reduction plan in Europe. Q3 FY22 includes 107 million of costs associated with our workforce reduction plan in Europe. Q2 FY22 includes 44 million of costsassociated with our workforce reduction plan in Europe. Q1 FY22 includes 67 million of costs associated with ourworkforce reduction plan in Europe.3 - Q4 FY22 amounts include TNT Express integration expenses of 38 million. Q3 FY22 amounts include TNT Expressintegration expenses of 24 million. Q2 FY22 amounts include TNT Express integration expenses of 27 million. Q1FY22 amounts include TNT Express integration expenses of 26 million.Unaudited. Differences may result due to ro
FedEx Freight is a leading North American provider of less-than-truckload (LTL) freight services across all lengths of haul to businesses and residences. Within the contiguous U.S., the company offers: FedEx Freight Priority, when speed is critical to meet a customer's supply chain needs; FedEx Freight Economy, when a .


