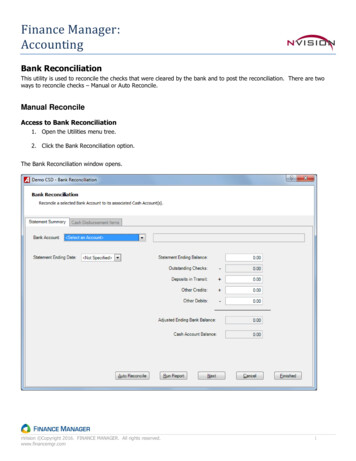
Transcription
Investment Performance ReviewPeriod Ending December 31, 2017Port of Houston AuthorityPension Plan
AndCoFirm UpdateAs we embark on a New Year together we first wanted to say, “Thank you” toour clients for giving us the opportunity to work with you. Our mission is torepresent the sole interests of our clients by redefining independence. Thismission means everything to us. We want to demonstrate this mission everyday by maintaining your trust in an evolving financial world. We are extremelygrateful to be your consultant and will continue to work tirelessly to uphold yourtrust and confidence.At AndCo, we believe in order to continue growing over time, and aligninterests of all employees, we must continue to recycle equity opportunitiesback into the organization. This belief embodies our commitment to remainemployee owned and managed, as well as reward those team members thathave helped make the company what it is today and what it will be goingforward. This shared belief also ensures legacy partners will eventually transfertheir units to new members.As we enter 2018, AndCo has never been stronger and more committed todelivering high quality service. We are 87 people strong, all collectively strivingto serve our clients each day. Since most clients do not have the opportunity tointeract with our entire firm, we have attached a page which outlines ourcurrent organizational structure and illustrates our continued reinvestment inprofessionals to better serve you. Our steadfast focus on one line of business,general consulting, will remain our singular focus going forward.As such, since Joe initially transferred units back to the firm, I have grantedunits to new members. I am also happy to acknowledge Dave West as themost recent 1st generation partner to voluntarily recycle his ownership unitsback into the company. Dave was one of our initial partners and was aninstrumental collaborator in the development of the early philosophies anddeliverables of the organization. Dave will continue to support the firm byserving our clients with the same passion and enthusiasm into the future asone of our most tenured senior consultants.Each January, we hold a Firmwide retreat to discuss the previous year’ssuccesses and challenges, as well as outline our Strategic plan, includingreinforcement of our Mission, Vision and Values. It’s a great time for ouremployees to spend time together and get a better understanding of where thecompany is going, why we’re headed in that direction, and more importantly,the critical role they each play in making it a success. Starting last year, alongwith this strategic review, we also started the process of announcing newpartners at the firm. Since the firm was founded in 2000 by Joe Bogdahn, itsfoundational goal was to make the firm a multigenerational organization led bythe employees. That succession plan was put into place in 2015 and lastJanuary we announced 6 new partners – Donna Sullivan, David Ray, JasonPurdy, Bryan Bakardjiev, Steve Gordon and Troy Brown.This year, we added one new partner – Dan Johnson. Dan has been with thefirm for almost 10 years and has worked tirelessly serving his clients andevolving the firm in multiple areas. Dan believes in what we are doing and thevalue of the independent service model. Dan has continuously demonstratedhis willingness to drop everything to help others and help the firm better serveour clients, each other, and the community. As a testament to his contributions,when his name was announced Dan received a standing ovation from hispeers. We are honored to have Dan at our firm and part of our ownership team.Page 1So, this New Year we want to say “Thank you” twice: once to you, our valuedclients, and once to Dave West for his support, belief and understanding of theAndCo way. We embark on 2018 stronger than ever thanks to your trust,people like Dave, and the rest of our tremendous, growing team.On behalf of everyone at AndCo, thank you for your partnership.Mike Welker, CFA President/CEO
Page 2
AndCoFirm UpdateMike Welker, CFAPresident/CEOBryan Bakardjiev, CFAExecutive DirectorTroy Brown, CFAExecutive DirectorSteve GordonExecutive DirectorKim Spurlin, CPAExecutive DirectorJack EvattDirector of ConsultingDan JohnsonDirector of ConsultingDoug AndersonAnnette BidartMike BostlerJon Breth, CFPChristiaan J. Brokaw, CFAPeter BrownJennifer BrozstekMike FleinerJacob PeacockDirector of Retirement SolutionsDavid RayDirector of Client SolutionsJoe CarterMisha BellTim NashMary NyeT. Christopher Pipich, CFAHoward PohlKerry Richardville, CFAJames RossJohn Thinnes, CFA, CAIABrendon M. Vavrica, CFPTim WaltersGreg WeaverDave West, CFAKim HummelBeth PorzeltJeff PruniskiAmy HeyelPaul MurrayAmy FosterBrooke WilsonNicole HamptonMatt DeConcini, Esq.Chief Compliance OfficerSara SearleCompliance OfficerMatt DeConcini, Esq.Chief Compliance Officer(Moderator)Jack EvattDirector/Senior ConsultantAnnie LopezJeff Gabrione, CFADirector of Research AlternativesJulie Baker, CFAInternationalBrad Hess, CFADomesticAlbert SauerlandDonna SullivanGrace NiebrzydowskiRob Mills, CAIAReal EstateKadmiel Onodje,CAIAAsset StrategiesDan Osika, CFAAsset StrategiesPhilip Schmitt, CIMAHead of Fixed IncomeSteve Jones, CFAHead of Asset Strategies Evan Scussel, CFA, CAIATimKominiarek, CAIA Head of EquityHead of RealAssetMatthew OgrenKevin Laake, CFADomesticMary Ann JohnsonZach Chichinski, CFA, CIPM Rosemarie KieskowskiJose ChristiansenYoon Lee-ChoiAl DiCristofaroPage 3Michael Holycross, CIMAJennifer Gainfort, CFABrian GreenTyler Grumbles,CFA,CIPMIan JonesTony KayBrian KingJeff Kuchta, CFAChris Kuhn, CFA, CAIAJustin Lauver, Esq.John McCann, CIMAJohn MellingerAssociateRachel Brignoni,CLSCDirector of HumanResourcesDerek Tangeman, CFP,CIMADirector of MarketingJason PurdyDirector of ITKim GoodearlHead of RFP TeamJamie UttIT Systems AdministratorTala ChinMarketing AnalystJerry CamelDirector of SoftwareDevelopmentJohn Rodak, CIPMHead of Client On-BoardingJeff Gabrione, CFADirector of ResearchIan JonesSenior ConsultantTim LingerSoftware DeveloperDan JohnsonDirector/Senior ConsultantJacob PeacockDirector of RetirementSolutionsBrandie RiveraControllerMeghan HainesClient On-Boarding AssociateBonnie BurgessOffice Administrator
The Market EnvironmentMajor Market Index PerformanceAs of December 31, 2017 Market returns were positive across major equity and fixed income indices forthe 4th quarter and calendar year 2017. Broad domestic and internationalequity markets continued their year long trend of strong positive performance.Fixed income indices also posted positive results, but equities outpaced fixedincome investments for both the quarter and 1-year period as improvingmacroeconomic data and robust corporate earnings worldwide fosteredinvestor optimism in the continued global economic recovery. The US stockmarket represented by the Russell 3000 Index returned 6.3% and 21.1% forthe quarter and calendar year respectively. While the Russell 3000outperformed the international MSCI ACWI ex US Index during the 4th quarter,international stocks were the best performers of 2017. Domestic equity indicespushed higher as most measures continued to show continued signs of ahealthy US economy. Future prospects for lower corporate and individual taxrates following the passage of a republican party led tax code overhaul inDecember also boosted returns through the period.International equity market benchmarks posted considerable gains for both the4th quarter and year-to-date period with the MSCI ACWI ex US returning 5.0%and 27.2% respectively. Emerging market stocks outpaced both internationaldeveloped and US equities over both periods with the MSCI Emerging MarketsIndex returning 7.4% through the quarter and an impressive 37.3% for thecalendar year. While developed market international index returns wereweaker by comparison, they still posted solid gains with the MSCI EAFE Indexreturning 25.0% for the 1-year period outpacing major domestic indices.International equities benefitted from continued strength in global fundamentaldata, a weakening U.S. Dollar (USD) and generally accommodative globalcentral bank policies. This positive trend in economic fundamentals led someglobal central banks to begin normalizing monetary policy with both theEuropean Central Bank (ECB) and the Bank of England (BoE) taking actionduring the 4th quarter. Many international markets also saw their returnsinfluenced, both positively and negatively, by ongoing political developmentsthroughout the quarter.5.0%MSCI EAFE4.2%MSCI Emerg Mkts7.4%S&P 5006.6%Russell 30006.3%Russell 10006.6%Russell MidCap6.1%Russell 20003.3%Bbg Barclays US AggBbg Barclays US Govt0.4%0.0%Bbg Barclays US TIPS1.3%Bbg Barclays MBS0.2%Bbg Barclays Corp IG1.2%3-Month T-Bill0.3%0.0%2.0%4.0%6.0%8.0%1-Year PerformanceMSCI ACWxUS27.2%MSCI EAFE25.0%37.3%MSCI Emerg MktsS&P 50021.8%Russell 300021.1%Russell 100021.7%Russell MidCap18.5%Russell 2000During the 4th quarter, interest rates on the US Treasury Yield Curve rose forshort-term maturities, but fell for long-term maturities causing further flatteningof the yield curve. The jump in interest rates on the short end of the curve waspartially due to increasing investor expectations for a US Federal Reserve(Fed) interest rate hike, which materialized in December. Despite the increasein short-term rates, broad fixed income indices posted modestly positiveresults with the bellwether Bloomberg Barclays U.S. Aggregate Index returning0.4% for the quarter and 3.5% for the year. Corporate credit continued its trendof outperformance relative to other investment grade sectors through 2017 asit benefitted from the further tightening of credit spreads relative to Treasuries.Source: Investment MetricsPage 4Quarter PerformanceMSCI ACWxUS14.6%Bbg Barclays US AggBbg Barclays US GovtBbg Barclays US TIPSBbg Barclays MBS3.5%2.3%3.0%2.5%Bbg Barclays Corp IG3-Month 0%40.0%
The Market EnvironmentDomestic Equity Style Index PerformanceAs of December 31, 2017 US equity index returns were solidly positive across the style and capitalizationspectrum for the 4th quarter and trailing 1-year period. Throughout 2017, therewas only one instance of a negative quarterly return being posted by theRussell market cap and style indices, which was a -0.13% return by theRussell 2000 Value Index during 1Q 2017. Quarterly results benefitted fromthe passage of republican party tax reforms that represented the first majorrestructuring of the US Tax code since 1986. Investors cheered the reductionsto both individual and corporate income tax rates. In particular, the reduction ofthe corporate tax rate from 35% to 21%, all else equal, should act as atailwind to corporate earnings and therefore future investment returns.Furthermore, as seen through much of 2017, encouraging economic datacontinued to facilitate gains in U.S. equity markets as positive trends in GDP,consumer and business sentiment, corporate earnings and employmentcontinued throughout the period.During the quarter, large cap stocks outperformed mid and small cap equities.The large cap Russell 1000 Index returned 6.6% during the period, double the3.3% return posted by the small cap Russell 2000 Index. Calendar year resultsecho the 4th quarter’s with the Russell 1000 gaining 21.7% versus a 14.6%increase for the Russell 2000. This trend of large cap outperformance can bepartially explained by their greater to exposure to foreign markets relative tosmall cap companies. This can be especially beneficial during periods of USDweakness, such as that experienced over the last year, which is typicallyfavorable to exporters and foreign sales. Large cap companies as a wholegenerate more revenue outside of the US which can expose them to fastergrowing markets, foreign tax benefits or strengthening foreign currencies.Growth indices outperformed value indices across the market cap spectrum forthe fourth straight quarter. Performance for growth indices more than doubledvalue index performance for each respective cap segment with all market capgrowth indices posting returns greater than 20% during 2017. Growthbenchmarks benefitted from larger exposures to more cyclical names withinthe information technology, consumer discretionary, health care and industrialssectors. They also benefitted from underweights to more defensive “bondproxy” sectors such as REITs, utilities and telecom. Lower exposure to theenergy sector also acted as tailwind to growth benchmarks.Quarter Performance - Russell Style Series3000 Value5.1%3000 Index6.3%3000 Growth7.6%1000 Value5.3%1000 Index6.6%1000 Growth7.9%MidCap Value5.5%MidCap Index6.1%MidCap Growth6.8%2000 Value2.0%2000 Index3.3%2000 Growth4.6%0.0%2.0%4.0%6.0%1-Year Performance - Russell Style Series3000 Value13.2%3000 Index21.1%3000 Growth29.6%1000 Value13.7%1000 Index21.7%1000 Growth30.2%MidCap Value13.3%MidCap Index18.5%MidCap Growth Domestic equity valuations appear stretched relative to historical levels basedon Forward Price/Earnings ratios (P/E), with even the most reasonably valuedindices trading above their historical P/E valuations. Index P/E valuationsrange from 110% to 132% of their respective 15-year P/E averages. The smallcap value index appears the most inexpensive and the small cap growthsegment looks the most overvalued.Source: Investment MetricsPage 58.0%25.3%2000 Value7.8%2000 Index14.6%2000 Growth0.0%22.2%5.0%10.0%15.0%20.0%25.0%30.0%35.0%
The Market EnvironmentGICS Sector Performance & (Sector Weight)As of December 31, 2017 Sector performance was positive across all sectors for the 4th quarter of 2017.However, only four of eleven economic sectors outpaced the Russell 1000Index return. Cyclical sectors tended to do well through the period with thehigher yielding bond proxy sectors lagging on a relative basis. Apparel andretail companies drove performance within the consumer discretionary sector,which returned 9.2%, leading all other sectors. Technology stocks continuedtheir 2017 gains over the quarter benefitting from robust 3rd quarter earningsand product demand returning 8.9%. Over the trailing 1-year period,technology was the best performing sector by a relatively wide marginreturning an impressive 38.4%. Materials, consumer discretionary, healthcare,industrials and financials all posted returns greater than 20%. Nine of elevenlarge cap economic sectors posted positive returns for the year with eightposting double digit returns. Energy and telecom services were the only largecap sectors to post negative returns over the last year, returning -1.3% and-1.2% respectively.Small cap sector results were mixed relative to their large capitalizationcounterparts. Five of eleven economic sectors outpaced the Russell 2000Index return for the quarter, with nine sectors posting positive results for theperiod. Most of the sector trends observable in large cap index sectorperformance also impacted small cap sectors. However, there were severalnotable differences, particularly in technology, telecom services and financialswhere there was significant underperformance relative to their large capcounterparts. Small cap sectors trailed large cap sectors in those threecategorizations by 8.0%, 7.4% and 6.7% during the quarter respectively. Overthe 1-year period, ten of eleven sectors have posted gains with six of elevensectors having returns greater than 10%. Over the one year period, healthcare stocks were the best performers within the Russell 2000 returning a solid35.7%. Energy was the only Russell 2000 sector to post a negative return overlast year, falling a meaningful -18.4%.Using S&P 500 sector valuations as a proxy for the market, forward P/E ratiosfor eight of the GICS sectors were higher than their long-term averages atquarter-end. Using these historical P/E measures, the energy, materials andutilities sectors appear the most extended. In contrast the technology, healthcare and telecommunications sectors were trading at a discount to their longterm average P/E ratios.QuarterRussell 10009.2%Consumer Disc (12.3%)23.4%Consumer Staples (7.6%)6.4%Energy (5.8%)6.4%12.9%-1.3%8.3%Financials (14.8%)21.6%1.5%Health Care (13.5%)22.1%6.5%Industrials (10.5%)21.7%7.0%Materials (3.4%)24.1%Real Estate (3.7%)3.1%Telecom Services (1.9%)3.4%9.7%-1.2%0.5%Utilities uarter40.0%1-Year7.7%Consumer Disc (12.1%)15.4%Consumer Staples (2.7%)7.2%5.3%Energy (3.7%)6.9%-18.4%1.6%6.4%6.4%Industrials (15.2%)19.5%0.9%Info Technology (17.0%)16.8%3.8%Materials (4.5%)17.7%-0.5%Real Estate (7.0%)-20.0%35.7%2.5%Health Care (15.0%)4.9%-4.0%5.6%1.0%Utilities (3.7%)Source: Morningstar Direct15.0%Russell 2000Telecom Services (0.8%)Page 638.4%8.9%Info Technology (23.4%)Financials (18.2%)1-Year14.4%-10.0%0.0%10.0%20.0%30.0%40.0%
The Market EnvironmentTop 10 Index Weights & Quarterly Performance for the Russell 1000 & 2000As of December 31, 2017Top 10 Weighted StocksRussell 1000Weight1-QtrReturnTop 10 Weighted Stocks1-YearReturnSectorRussell 2000Weight1-QtrReturnSectorApple Inc3.43%10.2%48.5%Information TechnologyNektar Therapeutics Inc0.42%148.8%386.7%Health CareMicrosoft Corp2.53%15.4%40.7%Information Technologybluebird bio Inc0.41%29.7%188.7%Health CareAmazon.com Inc1.83%21.6%56.0%Consumer DiscretionarySage Therapeutics Inc0.30%164.4%222.6%Health CareFacebook Inc A1.63%3.3%53.4%Information TechnologyExact Sciences Corp0.29%11.5%293.3%Health CareBerkshire Hathaway Inc B1.50%8.1%21.6%FinancialsGrubHub Inc0.29%36.3%90.9%Information TechnologyJohnson & Johnson1.49%8.1%24.4%Health CareCatalent Inc0.26%2.9%52.4%Health CareJPMorgan Chase & Co1.46%12.6%26.7%FinancialsKnight-Swift Transportation Inc A0.26%5.4%33.2%IndustrialsExxon Mobil Corp1.40%3.0%-3.8%EnergyCurtiss-Wright Corp0.26%16.9%24.6%IndustrialsAlphabet Inc C1.25%9.1%35.6%Information TechnologyEPAM Systems Inc0.25%22.2%67.1%Information TechnologyAlphabet Inc A1.24%8.2%32.9%Information TechnologySterling Bancorp0.25%0.1%6.4%FinancialsTop 10 Performing Stocks (by Quarter)Russell 1000Weight1-QtrReturnCalAtlantic Group Inc0.02%54.1%66.5%Skechers USA Inc0.02%50.8%53.9%Top 10 Performing Stocks (by .03%245.2%147.5%0.09%188.2%N/ARussell 2000WeightConsumer DiscretionaryVerso Corp AConsumer DiscretionaryAnaptysBio IncSectorMaterialsHealth CareFirst Solar Inc0.02%47.2%110.4%Information TechnologySage Therapeutics Inc0.30%164.4%222.6%Health CareUrban Outfitters Inc0.01%46.7%23.1%Consumer DiscretionaryValhi Inc0.01%154.6%82.7%MaterialsL Brands Inc0.06%46.5%-3.9%Consumer DiscretionaryNektar Therapeutics Inc0.42%148.8%386.7%Health CareRegal Entertainment Group A0.01%45.4%17.0%Consumer DiscretionaryForterra Inc0.01%146.7%-48.8%MaterialsHealth CareHollyFrontier Corp0.04%43.5%63.2%EnergyIgnyta Inc0.07%116.2%403.8%Twitter Inc0.06%42.3%47.3%Information TechnologyOverstock.com Inc0.05%115.2%265.1%Consumer DiscretionaryThe Kroger Co0.10%37.6%-19.0%Consumer StaplesMadrigal Pharmaceuticals Inc0.02%104.1%516.0%Health CareUnited States Steel Corp0.02%37.4%7.4%MaterialsBoot Barn Holdings Inc0.01%86.6%32.7%Consumer DiscretionaryBottom 10 Performing Stocks (by Quarter)Russell 1000Weight1-QtrReturn1-YearReturnBottom 10 Performing Stocks (by Quarter)SectorRussell 2000Weight1-QtrReturn1-YearReturnSectorConsumer DiscretionaryMallinckrodt PLC0.01%-39.6%-54.7%Health CareIconix Brand Group Inc0.00%-77.3%-86.2%Intrexon Corp0.00%-39.4%-49.4%Health CareAqua Metals Inc0.00%-68.9%-83.8%IndustrialsPandora Media Inc0.00%-37.4%-63.0%Information TechnologyImmune Design Corp0.01%-62.3%-29.1%Health CareTesaro Inc0.01%-35.8%-38.4%Health CareGNC Holdings Inc0.01%-58.3%-66.6%Consumer DiscretionaryPG&E Corp0.09%-34.2%-24.5%UtilitiesEastman Kodak Co0.00%-57.8%-80.0%Information TechnologyAcadia Healthcare Co Inc0.01%-31.7%-1.4%Health CareGenMark Diagnostics Inc0.01%-56.7%-65.9%Health CareOPKO Health Inc0.01%-28.6%-47.3%Health CareWillbros Group Inc0.00%-55.9%-56.2%EnergyHealth CareCelgene Corp0.32%-28.4%-9.8%Health CareNanoString Technologies Inc0.01%-53.8%-66.5%General Electric Co0.60%-27.3%-42.9%IndustrialsNordic American Tankers Ltd0.01%-53.6%-67.8%EnergyNewell Brands Inc0.06%-27.0%-29.4%Consumer DiscretionaryCuris Inc0.00%-53.0%-77.3%Health CareSource: Morningstar DirectPage 71-YearReturn
The Market EnvironmentInternational and Regional Market Index Performance (Country Count)As of December 31, 2017 International equity returns advanced during the 4th quarter, largely driven byongoing improvement in the global economy and continued weakness in theUSD. These trends, in tandem with a rally in technology stocks and risingcommodity prices, helped emerging markets continue their 2017outperformance relative to developed market equities. The USD continued itsyear-to-date decline against most major currencies through the period. Thisprovided additional tailwinds to international index returns denominated inUSD. The USD weakness is also visible in the 1-year performance for broadinternational indices, with all indices showing higher returns in terms of USD.Results for broad developed market international indices were positive for the4th quarter in both USD and local currency terms with the MSCI EAFE Indexreturning 4.2% and 3.7% respectively. While developed markets advanced onthe back of positive economic data, ongoing political developments alsoimpacted several markets thorough the quarter. Enthusiasm over the ECB’sdecision to extend its quantitative easing program was waned by GermanChancellor Merkel’s failure to form a coalition government and Catalonia’sindependence referendum. In the UK, initial concerns over a “hard Brexit” weretempered toward the end of the quarter as a the EU and UK were able tocome to a preliminary agreement, increasing the odds of a more amicableseparation. Prime Minister Abe’s coalition government was successful inJapan’s October elections, winning a clear majority and providing reassurancethat Japan’s current monetary and fiscal policies will likely continue withoutmajor change. Performance for the past year has been strong on an absolutebasis with the MSCI EAFE Index returning 25.0% and 15.2% in USD and localcurrency terms respectively.The MSCI Emerging Market Index outperformed developed markets during the4th quarter, returning 7.4% and 5.7% in USD and local currency termsrespectively. While the same tailwinds that pushed developed internationalmarkets higher also benefitted emerging market equities, rising commodityand technology stock prices also helped gains. Similar to developed markets,political news influenced emerging markets during the quarter. In China, therewas a change in posture with a greater focus on quality growth, financialstability and economic reforms. India announced relief for the country’s staterun banks designed to inject additional liquidity to the financial system toimprove lending and stimulate the economy. Mexican stocks suffered as thepeso weakened against the dollar and investor concerns surrounding thefuture of NAFTA’s pushed prices lower. Brazil also faced currency headwindsand despite the fact that corruption charges against President Temer weredropped, recent votes indicated that support for future political reforms mayhave weakened. One year returns for the MSCI Emerging Market Index werean impressive 37.3% in USD terms and 30.6% in terms of local currency.Source: MSCI Global Index Monitor (Returns are Net)Page 8USDQuarter PerformanceLocal Currency5.0%4.2%AC World x US (46)WORLD x US (22)4.2%3.7%EAFE (21)4.2%3.7%2.2%Europe & ME (16)1.3%8.0%8.1%Pacific (5)7.4%Emerging Mkt (24)5.7%11.7%EM EMEA (10)7.3%8.4%EM Asia (9)EM Latin Amer -Year Performance10.0%Local Currency27.2%AC World x US (46)18.2%24.2%WORLD x US (22)14.6%25.0%EAFE (21)15.2%25.3%Europe & ME (16)12.9%24.6%Pacific (5)19.7%37.3%Emerging Mkt (24)30.6%24.5%EM EMEA (10)15.2%42.8%EM Asia (9)35.9%23.7%22.1%EM Latin Amer %45.0%
The Market EnvironmentU.S. Dollar International Index Attribution & Country DetailAs of December 31, 2017MSCI - EAFESector Weight1-Year ReturnConsumer Discretionary12.3%5.3%24.7%Consumer s21.2%3.0%24.7%Health tion Technology6.4%5.0%39.3%Materials8.2%8.5%33.9%Real Estate3.6%6.4%21.7%Telecommunication 4.2%25.0%TotalMSCI - ACWIxUSSector WeightQuarter Return1-Year ReturnConsumer Discretionary11.3%6.1%28.1%Consumer ials23.1%4.5%Health ion Technology11.5%6.2%51.1%Materials8.2%8.4%32.2%Real Estate3.2%5.6%26.5%Telecommunication 5.0%27.2%TotalMSCI - Emerging MktSector WeightQuarter Return1-Year ReturnConsumer Discretionary10.2%9.0%40.1%Consumer ials23.5%8.2%Health ion Technology27.7%7.1%60.6%Materials7.4%8.7%33.6%Real Estate2.8%3.1%49.5%Telecommunication .4%37.3%TotalSource: MSCI Global Index Monitor (Returns are Net in USD)Page 9Quarter ReturnCountryJapanUnited KingdomFranceGermanySwitzerlandAustraliaHong giumFinlandNorwayIrelandIsraelAustriaNew ZealandPortugalTotal EAFE CountriesCanadaTotal Developed CountriesChinaKoreaTaiwanIndiaSouth olandChilePhilippinesTurkeyUnited Arab EmiratesQatarColombiaPeruGreeceHungaryCzech RepublicEgyptPakistanTotal Emerging CountriesTotal ACWIxUS .8%-2.1%-5.5%7.4%5.0%1- .3%27.2%
The Market EnvironmentDomestic Bond Sector & Broad/Global Bond Market Performance (Duration)As of December 31, 2017 4thBroad fixed income benchmarks were slightly positive during thequarter. InOctober, the Fed began implementation of its plan to gradually reduce itsbalance sheet by systematically slowing the rate of reinvestment of theTreasury and mortgage backed securities (MBS) it holds on its books as thesecurities mature. This process will reduce the size of the Fed’s balance sheetover time and can be viewed as tightening of monetary policy. Positivemacroeconomic data throughout the quarter increased expectations that theFederal Open Market Committee (FOMC) would increase short-term interestrates during the quarter, pushing interest rates higher, especially at the shortend of the yield curve. The FOMC announced a 25 bps interest rate hike afterits December meeting, however, investors were not surprised by the rateincrease and market reactions were relatively muted. Despite subduedinflation, the Fed feels the economy is tracking to be healthy enough towarrant continued tightening in 2018. This caused a flattening of the yieldcurve as short-term market yields rose and rates on maturities greater than 10years fell. Long-term rates fell due to the artificially low supply caused bysignificant Fed ownership of long maturity Treasuries as well as stronginvestor demand. All else equal, this was a benefit to longer duration indices.While this was a relatively difficult period for fixed income investments, theBloomberg Barclays U.S. Aggregate Index stayed slightly positive for thequarter and calendar year, returning 0.4% and 3.5% respectively.Within investment grade credit, lower quality corporate issues outperformedhigher quality issues for both the quarter and 1-year period as contractingcredit spreads from improvements in economic fundamentals acted as atailwind to these issues. Baa rated credit was the best performing investmentgrade credit quality segment returning 1.2% for the quarter and 7.4% for theyear. High yield debt trailed investment grade credit for the quarter due to itslower duration and lack of spread compression relative to investment gradecredit. While investment grade spreads tightened 8 bps during the 4th quarter,spreads on high yield bonds tightened only 4 bps. However, high yield debtcontinues to be the largest beneficiary of the strengthening economy over lastyear with the Bloomberg Barclays High Yield Index appreciating 7.5%.A review of sector performance shows that investment grade credit hascontinued its 2017 trend of outperformance versus Treasuries and MBSsecurities during the 4th quarter. As previously mentioned, corporate issuesbenefited from tightening credit spreads throughout the period. Treasuriesstruggled through the quarter due to lower yields and tightening monetarypolicy. Despite widening spreads and increased supply, MBS managed tooutperform Treasuries for the quarter and the year. For calendar year 2017,Treasury securities were the worst performing investment grade sectorreturning 2.3%, while U.S. investment grade corporate bonds were the bestperforming investment grade sector gaining 6.4%.Source: BloombergPage 10Quarter PerformanceAAA (5.4)0.1%AA (6.0)0.6%A (7.6)1.1%Baa (7.7)1.2%U.S. High Yield (3.9)0.5%U.S. Treasury (6.2)0.1%U.S. Mortgage (4.4)0.2%U.S. Corporate IG (7.6)1.2
Kim Spurlin,CPA ExecutiveDirector Jeff Gabrione, CFA Director of Research-Alternatives Julie Baker,CFA . Michael Holycross,CIMA Jennifer Gainfort, CFA BrianGreen TylerGrumbles,CFA,CIPM IanJones Tony Kay BrianKing Jeff Kuchta,CFA Chris Kuhn, CFA, CAIA Justin Lauver,Esq. John McCann,CIMA JohnMellinger TimNash MaryNye T. Christopher Pipich,CFA .
