Transcription
Rodiel C. Ferrer, Alger TangDe La Salle University, Manila, PhilippinesThe Impact of Merger and Acquisition, Financial Ratios on Stock Price among theIndustrial Firms in the PhilippinesAbstract:With increased industrialization and development in the Philippines, it is essential for industrialcompanies to gain a positive image in the eyes of the various potential investors. One way of achievingthis is by registering positive stock performance.In line with this, the study explored the possible effects of various financial indicators in the form offinancial ratios to the year-on-year change in stock price among the different publicly listed industrialcompanies during the year 2006 to 2010. The occurrences of business combinations as well as theindustry subsectors were also included in the model to determine the possible effects of these factors onthe change in stock price. To accomplish this, the researchers made use of panel data regression withmergers and acquisitions, financial ratios and industry subsector as independent variables and the yearon-year change in stock price as dependent variables to highlight the impact of various regressors onstock price.Results indicated that certain financial ratios, namely the asset turnover, price-earnings and dividendpay-out ratios together with some company specific factors exhibited a significant impact oncompany’s change in stock price. This study would help corporate managers to create moreadvantageous strategies with the objective of increasing stock price. The study also allows the public tobetter anticipate changes in stock prices.Keywords: Merger and Acquisition, Financial Ratios, Stock Price and Industrial Firms1IntroductionGlobalization, industrialization and economic development helped the Philippines slowly become amore capital-intensive country. Hence, industrial firms are slowly increasing its number whilegradually increasing investors both within and outside the country. As such, more and more people arebecoming interested in the movements of the stock prices of the publicly listed industrial companies.In order to obtain and retain a positive image on these investors, company managers performcomprehensive planning and create effective strategies in order to increase the value of the company’sstocks. A few of these strategies include mergers and acquisitions as well as improving the variousfinancial ratios used by financial experts in assessing a company’s status.This study explored the effects of mergers and acquisitions, together with liquidity, activity, leverage,profitability, market performance ratios and industry subsectors on the year-on-year change in stockprice among the publicly listed industrial companies in the Philippines during the five-year period,
2006 to 2010. To accomplish this, the researchers made use of panel data regression with the businesscombination, financial ratios and industry subsectors as the independent variables and the change instock price as the dependent variable.Several theories, namely the efficient market theory, the discounted cash flows model, the GordonGrowth model and the Price-earnings valuation model, were used as guiding principles for this study.Studies conducted by Leong, Ward, and Gan(1996), Harjito and Sulong(2006); Bouwman, Fuller andNain(2003) Kallunki, Lampsa and Laamanen(2008); as well as Mazzucato and Semmler(1999) alsoprovided the researchers with valuable insights that helped in the conduct of this study.2Statement of the ProblemThe study wanted to investigate about the possible effects of merger and acquisition on the change instock prices of companies under business combinations. Furthermore, the research wanted to determinewhich among the financial indicators, represented by financial ratios under the five categories namelyprofitability, liquidity, activity, leverage, and market performance ratios would significantly impact theyear-on-year change in stock price. In addition, the researchers would want to know whether theindustry subsectors under the industrial sector of the Philippine stock exchange has a particular effecton the change in stock price.3Review of Related LiteratureMerger and AcquisitionA business combination, as defined by IFRS 3, is a transaction or event in which an acquirer obtainscontrol of one or more businesses. A business is then defined as an integrated set of activities andassets that is capable of being conducted and managed for the purpose of providing a return directly toinvestors or other owners, members or participants. [IFRS 3.Appendix A].
According to Moeller (2009), reasons for mergers and acquisitions fall into three broad categories.These are grouped to strategic, financial, and organizational. In strategic intent, the company wants tostrengthen the combined companies’ market position. This is achieved by increasing the market shareor reduction in competition in the market or both. The financial reasons is largely due to the moneyinvolved in the deal (Moeller, 2009). The business combination activity may be for the short-term orlong-term financial goals. The last, which is the organizational intent, is when the acquiring companyobtains a target company because of the target company’s key management personnel or because ofstock liquidity. According to the study of Massa and Xu (2011), the stock liquidity of the targetcompany would affect the likelihood of a business combination occurring. Therefore, stockperformance is one of the possible reasons for business combination.Ravenschaft and Scherer (1987) stated that efficiency was expected to rise as a result of increasedcapital, shared expertise, reduced redundancy in production and realized economies of scale. This isone of the benefits of a successful M&A, however, according to Hughes (1989), this is not always thecase, as M&A if not well planned can lead to even increased inefficiencies in the firm.Financial RatiosAt present, one major concern of most firms is on how to measure and assess the degree of the successof M&As. Firms need to measure before and after effects of M&A in order for them to evaluatewhether the M&A has been beneficial as planned. According to Smart and Megginson (2009), one wayto measure a firm’s condition is through the use of financial ratios. Financial ratios are suitable tools inanalyzing a firm’s financial statements to assess performance over a period. Moreover, a variety offinancial ratios are existing to analyze a firm’s liquidity, activity, debt, profitability and market value.After firms have measured its financial condition, they should be ready to evaluate it. Gitman (1999)discussed the use of ratio analysis, as a method of measuring and evaluating financial ratios to assess afirm’s performance. For Gitman (1999), there are basically two methods of ratio assessment. One wayis the use of cross-sectional analysis and the other way is the use time-series analysis. Cross-sectionalanalysis engages the comparison of different financial ratios that took place in the same period.Through this kind of analysis, a firm can determine how well it has performed in relation to other firms,also called as benchmarking and in relation to the industry as a whole. The other way of ratioassessment is known as the time-series analysis. In this kind of analysis, a firm compares its ownperformance over a period of time. This can tell whether the firm has progressed according to its plans.Reaction of Stock PricesGugler and Yurtoglu (2008) discussed that one way of determining the effect of the merger is throughthe examination of the stock market value of the acquiring and the acquired firm. Gopalaswamy,Acharya and Malik (2008) examined the Indian market and tested stock price reaction of both the targetand the acquiring companies which may have been caused by information related to a merger activityusing a traditional event-study residual analysis. Their study indicated that there were abnormal returnswhich are stimulated by activities that are concerned with business combinations. The result wassupported by Wong and Cheung (2009) wherein it was concluded that the acquiring companies wouldexperience positive effects on stock price. Other studies that helped the researchers in this paper wereLeong, Ward and Gan (1996) and Pilloff and Santomero (1996). Harjito and Sulong (2006), on the
other hand, indicated that there would business combinations would have no significant impact onstock prices.Stock Prices in Relation to Financial RatiosAono and Iwaisoko (2010) suggested that financial ratios have a low level of relationship with thestock price as evidenced by their study involving Japanese firms. Turk and Chapman (2006); Indrianiand Sugiharto (2010) as well as Lewellen (2004), on the other hand, showed that financial ratios doesnot have any significant impact on the change in stock price. Martani, Mulyono and Khairurizka(2009); Hao and Zhang (2007); Cai and Zhang(2010) as well as Shams, Zamanian, Kahreh, and Kahreh(2011) indicated that financial ratios would have a significant impact on the year-on-year in stock price.Their studies provided evidence that different financial ratios can affect the stock price in differentstock exchanges.Stock Price in Relation to IndustriesKallunki, Lampsa and Laamanen (2008) examined the possible effects of industry by looking at theeffects of the acquisition of firms under the technology sector. They concluded that such acquisitionwould affect stock price valuation in a significant manner. Moreover, Mazzucato and Semmler (1999)explored whether there exist a relationship between stock price volatility and market share instability inconnection with industry specific factors using the US automobile industry. The empirical resultsshowed that the degree of stock price volatility is indeed partly affected by industry specific factors.4MethodologyThe research used a causal/explanatory approach. In this type, the researchers wanted to study theimpact of business combinations, financial ratios and industry subsectors on the change in stock pricesof the industrial companies affected. In order for the group to proceed with the research, theresearchers gathered data from the website of the Philippines Stock Exchange particularly the annualreports and stock prices of all the listed service companies from 2006-2010. In order to identify thecompanies with business combination, the group made use of the information found in the OSIRISdatabase. The researchers then extracted two particular ratios under the profitability, marketperformance, liquidity, capital structure, and turnover measures of a company which are used torepresent the financial ratios. The occurrence of mergers and acquisitions would be captured by the useof a dummy variable. Upon gathering the data, the group used the panel data regression analysis toanalyze the impact of the ratios on change in stock prices.The study encompassed all companies that were listed in the industrial sector of the Philippine StockExchange (PSE). The research used the financial reports and the market information provided for in thePSE website and in the OSIRIS database. These sources of information were readily available and wereeasy to obtain.The industrial sector includes companies that are engaged in the distribution of utilities such aselectricity and water, the manufacturing of beverage, tobacco and food, construction, allied servicesand infrastructure, in addition to diversified industrials. The total scope of the study would includeseventy firms publicly listed in the industrial sector of the Philippine Stock Exchange.
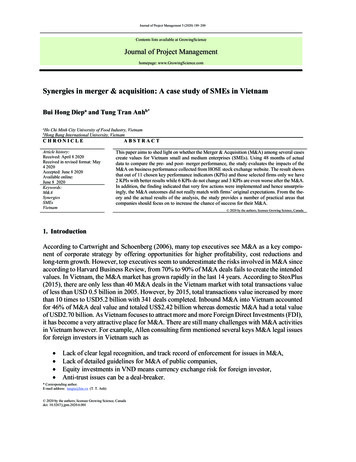
In order for a research to proceed, research procedures were performed with specific relevance to thesubject being researched. As the research needed the use of annual reports, the first step to thisresearch was data gathering. The researchers primarily made use of secondary data obtained from thewebsite of PSE, the OSIRIS database and the Bloomberg website. In order to determine the occurrenceof business combinations, the group used the merger and acquisition information found in the OSIRISdatabase. After identifying companies with business combination, the researchers recorded theoccurrence through the use of indicator variables.In addition, the group extracted two ratios for each measure namely the liquidity, profitability, activity,capital structure, and market performance. For the liquidity measure, the current and quick ratios wereconsidered while the return on assets and return on equity ratios were for the profitability measure. Theactivity measure included the asset turnover and the payables turnover ratios while the marketperformance measure was represented by the price-earnings and dividend payout ratios. The leverageaspect included the debt-to-equity and equity-to- assets ratios. Moreover, the industry subsector inwhich the company is operating in is also taken into account using dummy variables.The use of various statistical tools and software aided the conduct of this study. Specifically, thevariance inflation factor, the Naïve Panel Data Regression, Space-varying Fixed Effects Panel DataRegression, Time-Varying Fixed Effects Panel Data Regression, Fixed- and Time-varying FixedEffects Panel Data Analysis, Random Effects Panel Data Regression, Pearson correlation coefficienttest were used to analyze the data and the corresponding result. Additionally, different ways ofsummarizing data such as means and standard deviation was used in the paper. Tests of robustness afterobtaining the final regression model were performed to assure the researchers that there were noviolations in the regression assumptions.5Descriptive StatisticsIn order to have a preliminary view of the possible impact of certain financial ratios, under liquidity,profitability, leverage, activity and market performance, industry and merger and acquisitions onstock price, the researchers employed the use of descriptive statistics. Using the descriptive statistics,the researchers extracted the average, standard deviation, observations, minimum and maximum valuesfor each variable to be used in the study.VariableObsMeanStd. 77066.237573-1106.8returnoneq y305-2.8442249.85565-860.83763.68008returnonas t305-0.484438.922375-92.345553.91667assetsturn r2830.1203842.016099-133.36185payablestu r2823.99431956.81978-1942.8732
i s1820.5061544.382524-27.378925.29712dividendpa .35522701ind code3455.3913042.3822128Based on the mean and standard deviation of the various variables used in the study, it was unexpectedto observe that the change in stock price would have the smallest standard deviation. This wouldindicate that the changes in the stock price were generally less volatile compared to the other variablessuch as the various financial ratios. The result would also indicate that approximately 68% of all thechanges in the stock prices for publicly listed industrial companies during the years 2006 to 2010would fall within the range of -0.76% to 1.68%. The average change in stock price for the publiclylisted industrial companies in the Philippine Stock Exchange from the five-year period 2006 to 2010was 0.46%. The greatest stock price drop resulted in a -0.95% decrease in stock price while the higheststock price increase resulted in a 9.46% increase in stock price. The low standard deviation wasunpredicted because stock prices were said to be extremely unstable which caused the researchers toexpect a high variance for the said variable. Using the range of the values of the change in stock price,which is 10.41%, the researchers saw that such range of values is also much smaller than the financialratios used in the study.With respect to the liquidity of publicly listed companies, the mean average of percentage change forcurrent ratio was 0.59 while quick ratio yielded 0.63. We can observe that the difference in the meanbetween the two ratios is minimal; this can be due to the fact that these ratios are similar, and the onlydifference would lie on the exclusion of inventory in computing for quick ratio. The similarity betweencurrent and quick ratio was also manifested in standard deviation. Both have a standard deviation of6.24% when rounded off to the nearest thousandths. With regard to the range of changes in currentratio and quick ratio, 68% of changes in current ratio and quick ratio would fall on the range of -5.65%to 6.83% and -5.61% to 6.87% respectively. Likeness between the two ratios was further revealedrelative to their maximum percentage increase and minimum percentage decrease. Both ratiosexperienced a highest drop of one percent. Both ratios also reached their maximum increase of 106.8%.On the matters concerning publicly listed companies’ profitability, the mean average for profitabilityindicators in the variables of return on asset and return on equity would be -2.84 and -0.48correspondingly. Based on the averages, it can be observed that most industrial companies experiencednet losses over the five-year period. However, the net loss is minimal relative to the total assets andshareholders’ equity. The degree of variability or standard deviation would show 49.86 for return onasset and 8.92 for return on equity. The standard deviation for return on asset was higher compared tothe standard deviation of the return on equity variable. This may be because assets were more volatilecompared to shareholders’ equity for industrial companies. On ranges of changes, 68% of changes inreturn on assets would lie on the range between -52.70% and 47.01% while the same 68% of changes
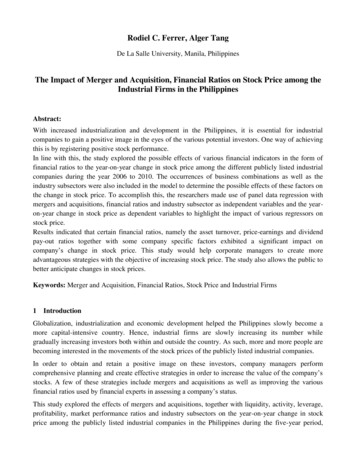
in return would be positioned between the ranges of -9.41% to 8.44% for equity. The maximum andminimum percentage changes would also differ between return on assets and return on equity. Returnon assets would show greatest increase of 63.68 and utmost drop of -860.84 whereas return on equitywould experienced furthermost boost of 53.92 and largest decline up to –92.35.In relation to publicly listed companies activity measures, mean average of percentage change for assetturnover was 12.04 along with mean average of percentage change for payables turnover which was3.99. Accounts payable turnover would show higher variability having a standard deviation of 56.82 ascompared to the standard deviation for asset turnover which was 2.02. Higher variability of payablesturnover than assets turnover was also exposed in range of changes. Both activity measures’ largestdrop would be as low as 1% percent where the maximum increase will be much higher in payablesturnover having 942.87% than asset turnover’s 33.36% largest increase.On the other hand, for leverage ratios, debt to equity ratio would have the higher mean of 0.09,meanwhile; equity ratio would give an average of 0.06. Standard deviation of the debt to equity ratiovariable was 1.28% compared to the 2.24% standard deviation of the equity ratio. Based on the resultsabove, it can be seen that 68% of the changes in debt to equity ratio would be within the range of 1.19% to 1.36%. The range wherein 68% of all of the changes in the equity ratio was from-2.18% to2.30%.Under the market performance of publicly listed companies, price earnings ratio would yield a meanaverage of 0.51 and on one hand, divided payout ratio would give an average of 0.75. These twovariables have significantly less observations in comparison with other variables. The standarddeviation for price earnings ratio would be higher, having 4.38, than dividend payout ratio which was3.67. Price earnings would fall to as low as -27.38% and increase to as high as 25.30% while dividendpayout ratio furthermost decrease would be -5.33% and would soar to as large as 18.59%.6Panel Data RegressionThe final model for this study is the random effects generalized least squares regression model shownbelow. The model, being a generalized least square regression, the model would have no heterogeneityand autocorrelation. The overall model was statistically significant at 1% because the p-value of theoverall model was 0.000. Based on the results shown by the regression output, the equity ratio, priceearnings ratio and the dividend pay-out ratio were the financial indicators that had significant impact onthe change in stock price.The overall results of the final regression model supported the results of Harjito and Sulong(2006)which showed that there exists a positive relationship between the change in stock price and thedifferent financial ratios. On the other hand, the apriori expectation that business combinations wouldhave an impact on the stock price was based on the research conducted by Leong, Ward, andGan(1996) was not met. The result of the final model indicated however, that there was no statisticalevidence that business combinations had any impact on the year-on-year change in stock price.Based on the testing performed, merger and acquisition activities did not have any significant impacton the year-on-year change in stock price. This may be because the event window used for this researchwas too wide. Other researches regarding the effects of business combinations on the change in stock
price made use of event windows of only several days wide. However, this research would indicate thatmergers and acquisitions did not have any long-term impact on the stock prices even if there would bea significant impact on the short-term stock price changes.Random-effects GLS regressionGroup variable: compNumber of obsNumber of groups 9427R-sq: within 0.4159between 0.4028overall 0.3987Obs per group: min avg max 13.55Random effects u i Gaussiancorr(u i, X) 0 (assumed)Wald chi2(14)Prob chi2stockpriceCoef.currentquickreturnoneq yassetsturn rpayablestu rdebttoequityequityratiopriceearni sdividendpa tmaind 2ind 3ind 4ind 7ind 5464-.4734543.1198371(omitted).2203553sigma usigma erho.35234472.69730476.2033924Std. Err.zP z 54.780.0000[95% Conf. 1203008.5610114(fraction of variance due to u i)All three significant ratios posted test statistics that were significant at a Type I error rate of 1% withprice-earnings ratio registering a p-value of 0.002, the dividend pay-out ratio registering a 0.008 pvalue while the equity ratio registered 0.003 p-value. Both price-earnings ratio and the equity ratiopositively affected stock price by 0.15% and 3.68% respectively. Dividend pay-out, on the other hand,negatively affected year-on-year change in stock price by -0.10% per 1% change.The result of the price-earnings ratio was consistent with the theoretical framework used for this model,which is the Price-Earnings valuation model. However, the result for the dividend pay-out ratio was abit surprising. Declaring higher dividends relative to earnings would negatively affect the stock price ofindustrial companies in the Philippines. This may be caused by the capital intensiveness of theoperations used by the industrial companies. Earnings accumulated over the past periods should bebetter off invested in additional assets. This would be supported by the result of the equity ratio
wherein reinvesting accumulated earnings into operations instead of opting to use debt financing wouldhelp increase stock prices.None of the industrial subsectors posted a significant test statistic indicating that these subsectors didnot significantly affect the year-on-year change in stock price.7ConclusionsBased on the results above, only three financial ratios significantly affected the explained variable.These ratios were the asset turnover, price-earnings ratio and the dividends pay-out ratio. The priceearnings ratio was the only financial ratio that significantly affected the change in stock price in apositive manner. Therefore, keeping a conservative income relative to assets and investing accumulatedprofits into the business would help companies increase their stock prices. This indicates thatemploying more conservative strategies would be more effective for industrial companies that aim toincrease stock market performance.Company specific attributes also significantly affected the dependent variable. Therefore, managersand those charged with governance should carefully analyze stock movements and determine thecompany’s performance in the stock market relative to other companies to determine if their companyhas a competitive advantage or disadvantage that significantly affects stock price. Careful investigationshould be performed to pinpoint those advantages and disadvantages so that the company can leveragefurther on the strengths that help improve stock prices while minimize or remove key weaknesses thathinder stock price growth.BibliographyAono, K. and Iwaisoko T. (2010). Forecasting Japanese Stock Returns with Financial Ratios and OtherVariables. Hitotsubashi University.Bouwman, C., Fuller, K., Nain, A. (2003). Stock Market Valuation and Mergers.Mit SloanManagement Review, Fall, 2003.Cai, J. and Zhang Z. (2010). Leverage Change, Debt Overhang, and Stock Prices. Drexel University.Dougherty, C. (2007). Introduction to Econometrics. New York: Oxford University Press.Gitman, L. J. (1999) Principle of Managerial Finance. 9th edition. Addison Wesley Publishing. USA.Gopalaswamy, A. K., Acharya, D., Malik, J. (2008). Stock Price Reaction to Merger Announcements:An Empirical Note on Indian Markets. Investment Management and Financial Innovations, Volume5, Issue 1.Gugler, K., Yurtoglu, B. B. (2008). The Economics of Corporate Governance and Mergers. EdwardElgar Publishing Limited. UKHarjito, D. A., Sulong, Z. (2006). The Effect of Merger and Acquisition Announcements on StockPrice Behavior and Financial Performance Changes: A Case of Banks in Malaysia. KajianBisnisDan Manajemen, Volume 8 No. 1.Hao, S. Q. and Zhang, G. C. (2007). Relative Firm Profitability and Stock Price Sensitivity toAggregate Information. Hong Kong University of Science and Technology.Hughes, A (1989) The Impact of Merger: a survey of empirical evidence for the UK. McGraw HillPress. New York.
Indriani, N. and Sugiharto, T. (2010). A Financial Performance of the Company with Effect UsingConventional Methods of EVA and Rate Shares.Gunadarma University.Kallunki, J., Lampsa, E. and Laamanen, T. (2008). Stock Market Valuation, Profitability, and R&DSpending of the Firm: The Effect of Technology Mergers and Acquisitions. Journal of BusinessFinance and Accounting, Volume 36, Issue 7-8, pp. 838-862.Leong, M. F., Ward, B., Gan, C. (1996). The Implication of a Merger Announcement on Share Price:An Event Case Study of Trust Bank New Zealand Limited. Lincoln University, Canterbury.Lewellen, J. (2004). Predicting Returns with Financial Ratios. Journal of Financial Economics. Vol. 74,pp. 209-325.Martani, D. Mulyono and Khairurizka. (2009). The Effect of Financial Ratios, Firm Size, and CashFlow from Operating Activities in the Interim Report to the Stock Return. China Business Review,Volume 8, No. 6, pp. 44-55.Massa, M. and Xu, M. (2011) The value of (stock) liquidity in the M&A market. The China Centre forFinancial Research, Tsinghua University, Beijing, China.Mazzucato, M. and Semmler, W. (1999). Market Share Instability and Stock Price Volatility Duringthe Industry Life-Cycle: the US Automobile Industry. London Business School, London.Moeller, S. (2009).Surviving M&A: Make the Most of your Company Being Acquired. John Wiley &Sons Ltd. West Sussex United KingdomPilloff, S. (1996). The Value of Bank Mergers and Acquisitions. The Wharton School, University ofPennsylvania.Ravenscraft and Scherer F (1987).Acquisitions, Mergers, Sell-offs and Economic Efficiency. HarvardBusiness Review, Volume 76 Issue 1D. McGraw Hill Press, New YorkShams, M. F., Zamanian, G., Kahreh, Z. S., and Kahreh, M. S. (2011). The Relationship BetweenLiquidity Risk and Stock Price: An Empirical Investigation of the Tehran Stock Exchange. AzadUniversity, Iran.Smart, S., and Megginson, W. (2009). Financial Management: An Introduction. ESP Printers, Inc.Philippines.Torres-Reya, O. (2006, October 23). Panel Data Analysis Fixed and Random Effects (using Stata .pdfTurk, A. and Chapman, M. (2006). The Effects of Financial Ratios and Market Hype on Short TermStock Prices. Illinois Wesleyan University.Wong, A. and Cheung, K. Y. (2009). The Effects of Merger Acquisition Announcements on theSecurity Prices of Bidding Firms and Target Firms in Asia. International Journal of Economics andFinance, Vol. 1, No. 2, pp. 274-283.
Keywords: Merger and Acquisition, Financial Ratios, Stock Price and Industrial Firms 1 Introduction Globalization, industrialization and economic development helped the Philippines slowly become a more capital-intensive country. Hence, industrial firms are slowly increasing its number while gradually increasing investors both within and outside .