Transcription
Peer Comparisons
Table of ContentsPeer ComparisonsIntroductionTotal EnrollmentUndergraduate Enrollmentby Genderby Race and CitizenshipGraduate Enrollmentby Genderby Race and CitizenshipTotal Degrees AwardedTotal Degrees Awarded by LevelBachelor's Degrees Awarded by DisciplineMaster's Degrees Awarded by DisciplineDoctoral Degrees Awarded by DisciplineFirst‐time First‐year Enrollmentby GenderCombined SAT Critical Reading and Mathematics 25th and 75th PercentilesAcceptance RateFirst‐time, First‐year YieldFirst‐time, First‐year Retention RateSix‐year Graduation RateAverage Faculty CompensationProfessorsAssociate ProfessorsAssistant ProfessorsUniversity Endowment FundsUniversity Endowment Funds per FTE StudentExpenditures per FTE StudentTuition, Fees, Room, and BoardFull‐time, First‐year Students Receiving Institutional Grant Aid:Average Amount of Aid ReceivedFull‐time, First‐year Students Receiving Loan AidAverage Amount of Aid ReceivedPeer Comparisons:Carnegie Mellon University (CMU) comparison to Average PeerCalifornia Institute of Technology (Cal Tech) comparison to CMUCornell University (Cornell) comparison to CMUDuke University (Duke) comparison to CMUEmory University (Emory) comparison to CMUGeorgia Institute of Technology (Georgia Tech) comparison to CMUMassachusetts Institute of Technology (MIT) comparison to CMUNorthwestern University (Northwestern) comparison to CMUUniversity of Pennsylvania (Penn) comparison to CMUPrinceton University (Princeton) comparison to CMURensselaer Polytechnic Institute (RPI) comparison to CMURice University (Rice) comparison to CMUStanford University (Stanford) comparison to CMUWashington University in St. Louis (Washington) comparison to CMU
Return to Table of ContentsPeer ComparisonsData Sources:Academe: Bulletin of the American Association of University ProfessorsIPEDS: National Center for Education Statistics Integrated Postsecondary Education Data SystemNACUBO: National Association of College and University Business OfficersU.S. News & World Report: U.S. News & World Report's "America's Best Colleges"Peer Institution List:The following list of schools was selected by executive administration for benchmarking purposes:California Institute of Technology (Cal Tech)Cornell University (Cornell)Duke University (Duke)Emory University (Emory)Georgia Institute of Technology (Georgia Tech)Massachusetts Institute of Technology (MIT)Northwestern University (Northwestern)University of Pennsylvania (Penn)Princeton University (Princeton)Rensselaer Polytechnic Institute (RPI)Rice University (Rice)Stanford University (Stanford)Washington University in St. Louis (Washington)Definitions:Degree Disciplines: All degree disciplines are categorized according to their Classification of Instructional Programs (CIP) codeArts: Includes Architecture and related services; visual and performing artsBusiness: Includes business, management, marketing, and related support servicesComputer and Information Sciences (CIS): Includes computer and information sciences and support servicesEngineering: Includes engineering; engineering technologies/techniciansHumanities and Social Sciences: Includes area, ethnic, cultural, and gender studies; communication, journalism, and related programs;communications technologies/technicians and support services; foreign languages, literatures, and linguistics; English language andliterature/letters; liberal arts and sciences, general studies and humanities; philosophy and religious studies; theology and religious vocations;psychology; social sciences; historyMathematics: Includes biological and biomedical sciences; mathematics and statistics; physical sciencesOther: Includes agriculture, agriculture operations, and related sciences; natural resources and conservation; personal and culinary services;education; family and consumer sciences/human sciences; legal professions and studies; library science; military technologies;multi/interdisciplinary studies; parks, recreation, leisure, and fitness studies; science technologies/technicians; security and protective services;construction trades; mechanic repair technologies/technicians; precision production; transportation and materials moving; health professions andrelated clinical sciencesPublic Administration: Includes public administration and social services professionsEnrollment: Carnegie Mellon enrollment figures do not include Qatar enrollment per IPEDS reporting guidelinesExpenditures: Includes the following institutional expenses: instruction, research, public service, academic support, student services, and institutionalsupportFaculty Compensation: Sum of salaries and benefits; not adjusted for cost of livingFederal Grant Aid: Includes grants that were provided by federal agencies such as the U.S. Department of Education, including Title IV Pell Grants andSupplemental Educational Opportunity Grants (SEOGs). Also includes need‐based and merit‐based educational assistance funds and training vouchersprovided from other federal agencies and/or federally‐sponsored educational benefits programs, including the Veteran's Administration, Department ofLabor, etc.First‐time, First‐year Retention Rate: The percent of first‐year students who return for their second year
Return to Table of ContentsInstitutional Grant Aid: Includes scholarships and fellowships that were granted and funded by the institution and/or individual departments within theinstitution (and are limited to students attending the institution). Also includes tuition and fee waivers granted by the institution (for which the institutionis not reimbursed from another source). These would include scholarships targeted to certain groups of individuals (from a particular state or studying acertain subject) for which the institution designated the recipient; athletic scholarships; etc.SAT 25th‐75th Percentile Range: The SAT scores for the middle 50% of first‐time, first‐year studentsSix‐year Graduation Rate: The percent of first‐time first‐year students who graduate within six yearsState/Local Grant Aid: Includes grants that were provided by the state such as Leveraging Educational Assistance Partnerships (LEAP) (formerly SSIGs).Also includes merit scholarships that were provided by the state and tuition and fee waivers for which the institution was reimbursed by a state agency.Local grants would include any local government grants, scholarships, or gift‐aid that are awarded directly to the student.Student Loan Aid: Includes all Title IV subsidized and unsubsidized loans made directly to students and for which the student is the designated borrower.(Include Perkins Loans made to students.) Excludes PLUS and other loans made directly to parents and for which the parent is the designated borrower.Also includes all institutionally‐ and privately‐sponsored loans made to students, for which the student is the designated borrower (as long as the funds passthrough the financial aid office).Student to Faculty Ratio: The total full‐time equivalent (FTE) enrollment of students divided by the total full‐time equivalent (FTE) of instructional faculty.For this calculation, FTE is equal to full‐time headcount plus one‐third part‐time headcount.
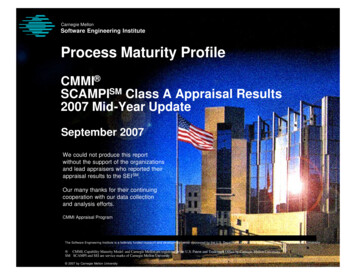
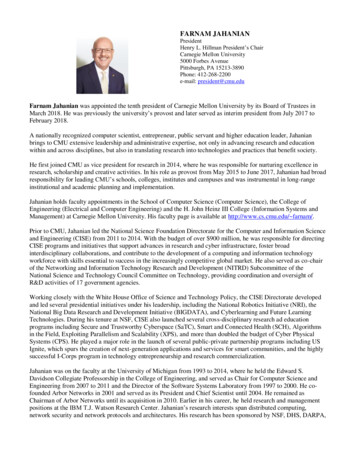
Return to Table of ContentsTotal EnrollmentFall 2010Cal 81Georgia on13,820Source: IPEDSUndergraduate EnrollmentFall 2010Cal rgia etonRiceRPIStanfordWashingtonSource: IPEDS5,1423,5295,4316,9407,138
Return to Table of ContentsUndergraduate Enrollment by GenderFall 2010Cal 45%Georgia 9%51%50%50%MenWomenSource: IPEDSUndergraduate Enrollment by Race and CitizenshipFall 2010Cal TechCMU74%Cornell74%17%Duke75%18%Emory73%Georgia TechWashingtonSource: nford14%79%MIT12%10%79%7%% U.S. Citizen (White, Asian, and race not reported)% U.S. Citizen (Black, Hispanic, Pacific Islander/Native Hawaiian, and American Indian/Alaska Native)% International% U.S. Citizen (Two or more races)1%
Return to Table of ContentsGraduate EnrollmentFall 2010Cal orgia 6,682Source: IPEDSGraduate Enrollment by GenderFall 2010Cal Tech71%CMU69%Cornell43%53%47%43%57%Georgia ource: nn31%57%DukeEmory29%29%60%40%49%51%MenWomen
Return to Table of ContentsGraduate Enrollment by Race and CitizenshipFall 2010Cal ukeGeorgia %Rice54%12%RPIStanfordWashingtonSource: IPEDS48%6%55%37%34%1%45%10%69%1%1%34%10%3%21%% U.S. Citizen (White, Asian, and race not reported)% U.S. Citizen (Black, Hispanic, Pacific Islander/Native Hawaiian, and American Indian/Alaska Native)% International% U.S. Citizen (Two or more races)1%
Return to Table of ContentsTotal Degrees AwardedAcademic Year 2009-10Cal gia 70Source: IPEDSTotal Degrees Awarded by LevelAcademic Year 2009-10Cal %RPI8%25%50%38%10%21%46%49%% Bachelor's15%39%71%Washington9%7%35%34%RiceSource: IPEDS8%36%57%PrincetonStanford8%46%48%Georgia %43%% Master's% Doctoral7%% Other
Return to Table of ContentsBachelor's Degrees Awarded by DisciplineAcademic Year 2009-10ArtsEngPublicHum and0%34%AdminSoc 15%7%Emory5%0%0%Georgia Tech5%58%MIT3%Cal TechCMUNorthwesternMath ts - Architecture and Visual and Performing ArtsEng - EngineeringPublic Admin - Public Administration and Social ServicesHum and Soc Sci - Humanities and Social SciencesMath and Sci - Mathematics, Statistics, Biological, and Physical SciencesCIS - Computer and Information SciencesBusiness - Business Management, Marketing, and Related Support ServicesSource: IPEDS
Return to Table of ContentsMaster's Degrees Awarded by DisciplineAcademic Year 2009-10ArtsEngPublicHum andCal Tech0%62%CMU6%CornellBusinessOtherAdminSoc %8%1%49%9%1,60732%40%Georgia ,0638%15%9%9%4%36%13%1,455Arts - Architecture and Visual and Performing ArtsEng - EngineeringPublic Admin - Public Administration and Social ServicesHum and Soc Sci - Humanities and Social SciencesMath and Sci - Mathematics, Statistics, Biological, and Physical SciencesCIS - Computer and Information SciencesBusiness - Business Management, Marketing, and Related Support ServicesSource: IPEDSMath andCISTotal
Return to Table of ContentsDoctoral Degrees Awarded by DisciplineAcademic Year 2009-10Cal TechCMUCornellDukeEmoryGeorgia %12%4%63%49%25%9%24%21%51%30%17%PublicHum andAdminSoc %49%24%35%48%Arts - Architecture and Visual and Performing ArtsEng - EngineeringPublic Admin - Public Administration and Social ServicesHum and Soc Sci - Humanities and Social SciencesMath and Sci - Mathematics, Statistics, Biological, and Physical SciencesCIS - Computer and Information SciencesBusiness - Business Management, Marketing, and Related Support ServicesSource: IPEDSMath 08244
Return to Table of ContentsFirst-time, First-year EnrollmentFall 2010Cal gia Source: IPEDSFirst-time, First-year Enrollment by GenderFall 2010Cal %45%36%64%MITPenn42%58%Georgia 2%RPI28%72%Stanford52%48%Washington52%48%Source: IPEDSMenWomen
Return to Table of ContentsCombined SAT Critical Reading and Mathematics 25th and 75th PercentilesFall 201016001500140013001200Source: IPEDS
Return to Table of ContentsAcceptance RateFall 2010Cal Tech13%CMU33%Cornell18%Duke19%Emory30%Georgia 21%RPIStanfordWashington40%7%21%Source: IPEDSFirst-Time, First-year YieldFall 2010Cal Tech36%CMU29%Cornell48%Duke41%Emory28%Georgia eRPI36%21%StanfordWashingtonSource: IPEDS71%31%
Return to Table of ContentsFirst-year Retention RateFall 2009 CohortCal Tech98%CMU96%Cornell96%Duke97%Emory94%Georgia e95%RPI91%Stanford98%Washington97%Source: IPEDSSix-year Graduation RateFall 2004 CohortCal Tech88%CMU87%Cornell93%Duke95%EmoryGeorgia RiceRPI93%83%Stanford94%Washington94%Source: IPEDS
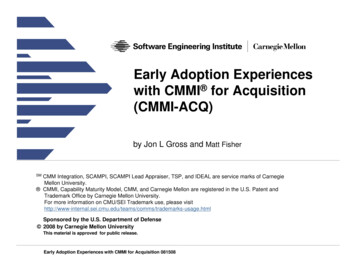
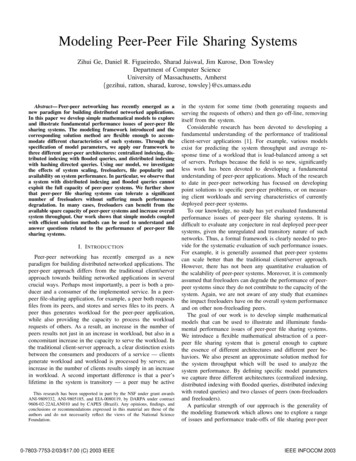
Return to Table of ContentsAverage Faculty Compensation - ProfessorsAcademic Year 2010-11Cal TechCMU 207,500 172,200Cornell 194,100Duke 202,600EmoryGeorgia Tech 195,800 170,300MIT 206,000Northwestern 214,700Penn 223,900Princeton 228,000RiceRPI 193,700 156,500Stanford 231,000Washington 203,100Average Peer Compensation 202,092Source: AcademeAverage Faculty Compensation - Associate ProfessorsAcademic Year 2010-11Cal TechCMU 135,600 121,800Cornell 139,000Duke 130,900Emory 131,900Georgia Tech 118,200MIT 146,500Northwestern 142,600Penn 153,300PrincetonRiceRPI 151,000 133,700 116,600StanfordWashingtonSource: Academe 162,900 124,200Average Peer Compensation 137,415
Return to Table of ContentsAverage Faculty Compensation - Assistant ProfessorsAcademic Year 2010-11Cal TechCMU 130,100 117,700CornellDukeEmoryGeorgia Tech 123,800 108,100 114,400 107,400MIT 128,800Northwestern 128,000PennPrincetonRiceRPI 146,600 115,100 107,500 100,700StanfordWashingtonSource: Academe 129,800 108,000Average Peer Compensation 119,100
Return to Table of ContentsUniversity Endowment Funds ( 000)Fiscal Year 2009Cal TechCMU 1,545,429815,099Cornell 3,478,587Duke4,823,572Emory4,694,260Georgia Tech335,792MIT 115Washington4,473,180Source: NACUBOAverage Peer Institution 5,533,938University Endowment Funds per FTE Student ( 000)Fiscal Year 2009Cal Tech*CMU 79Cornell*Duke 360Emory 363Georgia Tech 18MIT*Northwestern 344Penn 258Princeton 1,909RiceRPI 692 93StanfordWashingtonSource: NACUBO* Not reported to NACUBO 921 36Average Peer Institution 498
Return to Table of ContentsExpenditures per FTE Student ( 000)Fiscal Year 2009 277Cal Tech 81CMU 71Cornell 143Duke 103EmoryGeorgiaTech 53 222MIT 89Northwestern 122Penn 131Princeton 79RiceRPIStanfordWash U 50 163 156Average Peer Institution 127Source: IPEDSTuition, Fees, Room, and BoardAcademic Year 2011-2012Cal Tech 49,380CMU 55,120Cornell 54,701Duke 51,865EmoryGeorgia Tech 52,792 36,688MIT 52,507Northwestern 52,463PennPrincetonRiceRPIStanford 53,976 48,850 48,206 54,679 53,298WashingtonSource: Institution Websites 56,256Average Peer Institution 51,205
Return to Table of ContentsPercent of Full-time, Students Receiving Institutional Grant AidFall 2009 CohortCal Tech59%CMU58%Cornell52%Duke47%Emory55%Georgia e64%RPI100%Stanford64%Washington54%Source: IPEDSAverage Amount of Institutional Grant Aid ReceivedFall 2009 CohortCal Tech 29,152CMU 21,486 29,758Cornell 33,213DukeEmoryGeorgia Tech 24,794 6,432MIT 32,094Northwestern 23,666Penn 30,568Princeton 32,503RiceRPI 25,595 17,194StanfordWashingtonSource: IPEDS 31,535 23,205
Return to Table of ContentsPercent of Full-time, First-time Students Receiving Loan AidFall 2009 CohortCal Tech33%CMU41%Cornell32%Duke32%Emory40%Georgia e24%RPIStanfordWashington81%13%29%Source: IPEDSAverage Amount of Student Loan Aid ReceivedFall 2009 CohortCal Tech 5,026CMUCornellDuke 6,771 5,431 4,755Emory 6,063Georgia Tech 6,319MIT 5,994Northwestern 5,978PennPrinceton 5,567 4,787Rice 7,691RPIStanfordWashingtonSource: IPEDS 9,510 6,242 5,967
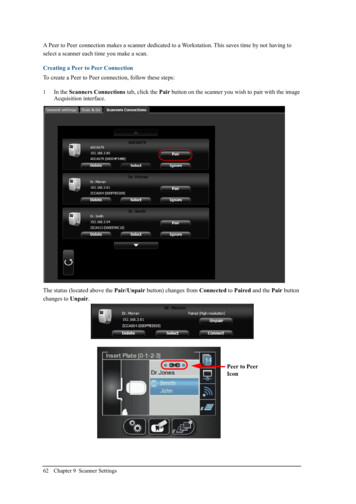
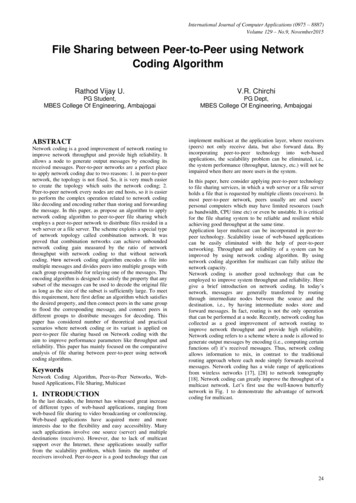
Return to Table of ContentsCarnegie Mellon University (CMU)Location: Pittsburgh, PennsylvaniaTuition, Fees, Room, and Board: 55,120Established: 1900Student to Faculty Ratio: 12:1Institutional Data: http://www.cmu.edu/iraTotal Enrollment Fall 2010Peer Avg.13,996CMU11,340Graduate Enrollment Fall 2010Peer Avg.CMU6,5705,510Undergraduate Enrollment Fall 2010Peer Avg.CMU7,4265,830First-time, First-year Enrollment Fall 2010Peer Avg.1,697CMU1,486First-year Retention Rate Fall 2009 CohortPeer Avg.96%CMU96%Six-year Graduation Rate Fall 2004 CohortPeer Avg.91%CMU87%Total Degrees Awarded 2009-10Peer Avg.CMU3,8763,584
Return to Table of ContentsCalifornia Institute of Technology (Cal Tech)Location: Pasadena, CaliforniaTuition, Fees, Room, and Board: 49,380.Established: 1891Student to Faculty Ratio: 3:1Institutional Data: http://www.iro.caltech.edu/Total Enrollment Fall 2010Cal Tech2,175CMU11,340Graduate Enrollment Fall 2010Cal Tech1,208CMU5,510Undergraduate Enrollment Fall 2010Cal Tech967CMU5,830First-time, First-year Enrollment Fall 2010Cal Tech222CMU1,486First-year Retention Rate Fall 2009 CohortCal Tech98%CMU96%Six-year Graduation Rate Fall 2004 CohortCal Tech88%CMU87%Total Degrees Awarded 2009-10Cal TechCMU4903,584
Return to Table of ContentsCornell University (Cornell)Location: Ithaca, New YorkTuition, Fees, Room, and Board: 54,701Established: 1865Student to Faculty Ratio: 12:1Institutional Data: http://www.dpb.cornell.edu/Total Enrollment Fall 2010Cornell20,939CMU11,340Graduate Enrollment Fall 2010Cornell7,004CMU5,510Undergraduate Enrollment Fall 2010CornellCMU13,9355,830First-time, First-year Enrollment Fall 2010CornellCMU3,1791,486First-year Retention Rate Fall 2009 CohortCornell96%CMU96%Six-year Graduation Rate Fall 2004 CohortCornell93%CMU87%Total Degrees Awarded 2009-10CornellCMU6,4283,584
Return to Table of ContentsDuke University (Duke)Location: Durham, North CarolinaTuition, Fees, Room, and Board: 53,760Established: 1838Student to Faculty Ratio: 8:1Institutional Data: http://ir.provost.duke.edu/Total Enrollment Fall 2010Duke15,016CMU11,340Graduate Enrollment Fall 2010Duke8,319CMU5,510Undergraduate Enrollment Fall 2010Duke6,697CMU5,830First-time, First-year Enrollment Fall 2010Duke1,752CMU1,486First-year Retention Rate Fall 2009 CohortDuke97%CMU96%Six-year Graduation Rate Fall 2004 CohortDuke95%CMU87%Total Degrees Awarded 2009-10DukeCMU4,0503,584
Return to Table of ContentsEmory University (Emory)Location: Atlanta, GeorgiaTuition, Fees, Room and Board: 52,792Established: 1836Student to Faculty Ratio: 7:1Institutional Data: http://www.oirpe.emory.edu/index.htmlTotal Enrollment Fall 2010Emory13,381CMU11,340Graduate Enrollment Fall 2010EmoryCMU6,1505,510Undergraduate Enrollment Fall 2010EmoryCMU7,2315,830First-Time, First-Year Enrollment Fall 2010EmoryCMU1,8751,486First-Year Retention Rate Fall 2009 CohortEmory94%CMU96%Six-year Graduation Rate Fall 2004 CohortEmory87%CMU87%Total Degrees Awarded 2009-10EmoryCMU3,9253,584
Return to Table of ContentsGeorgia Institute of Technology (Georgia Tech)Location: Atlanta, GeorgiaTuition, Fees, Room, and Board: 36,688Established: 1885Student to Faculty Ratio: 19:1Institutional Data: http://www.irp.gatech.edu/Total Enrollment Fall 2010Georgia Tech20,720CMU11,340Graduate Enrollment Fall 2010Georgia TechCMU6,9705,510Undergraduate Enrollment Fall 2010Georgia TechCMU13,7505,830First-time, First-year Enrollment Fall 2010Georgia TechCMU2,7121,486First-year Retention Rate Fall 2009 CohortGeorgia Tech94%CMU96%Six-year Graduation Rate Fall 2004 CohortGeorgia Tech77%CMU87%Total Degrees Awarded 2009-10Georgia TechCMU5,0273,584
Return to Table of ContentsMassachusetts Institute of Technology (MIT)Location: Cambridge, MassachusettsEstablished: 1861Institutional Data: http://web.mit.edu/ir/Tuition, Fees, Room, and Board: 52,507Student to Faculty Ratio: 8:1Total Enrollment Fall 2010MIT10,566CMU11,340Graduate Enrollment Fall 2010MIT6,267CMU5,510Undergraduate Enrollment Fall 2010MIT4,299CMU5,830First-time, First-year Enrollment Fall 2010MITCMU1,0671,486First-year Retention Rate Fall 2009 CohortMIT97%CMU96%Six-year Graduation Rate Fall 2004 CohortMIT94%CMU87%Total Degrees Awarded 2009-10MIT3,296CMU3,584
Return to Table of ContentsNorthwestern University (Northwestern)Location: Evanston, IllinoisTuition, Fees, Room, and Board: 54,869Established: 1851Student to Faculty Ratio: 7:1Institutional Data: http://www.adminplan.northwestern.edu/ir/Total Enrollment Fall 2010Northwestern20,481CMU11,340Graduate Enrollment Fall 2010Northwestern10,946CMU5,510Undergraduate Enrollment Fall 2010NorthwesternCMU9,5355,830First-time, First-year Enrollment Fall 2010Northwestern2,128CMU1,486First-year Retention Rate Fall 2009 CohortNorthwestern96%CMU96%Six-year Graduation Rate Fall 2004 CohortNorthwestern94%CMU87%Total Degrees Awarded 2009-10NorthwesternCMU6,0813,584
Return to Table of ContentsUniversity of Pennsylvania (Penn)Location: Philadelphia, PennsylvaniaTuition, Fees, Room, and Board: 53,976Established: 1740Student to Faculty Ratio: 6:1Institutional Data: http://www.upenn.edu/ir/Total Enrollment Fall 2010Penn25,007CMU11,340Graduate Enrollment Fall 2010PennCMU13,0675,510Undergraduate Enrollment Fall 2010PennCMU11,9405,830First-time, First-year Enrollment Fall 2010Penn2,405CMU1,486First-year Retention Rate Fall 2009 CohortPenn98%CMU96%Six-year Graduation Rate Fall 2004 CohortPenn95%CMU87%Total Degrees Awarded 2009-10PennCMU7,1573,584
Return to Table of ContentsPrinceton University (Princeton)Location: Princeton, New JerseyTuition, Fees, Room, and Board: 49,934Established: 1746Student to Faculty Ratio: 6:1Institutional Data: earch/Total Enrollment Fall 2010Princeton7,724CMU11,340Graduate Enrollment Fall 2010Princeton2,582CMU5,510Undergraduate Enrollment Fall 2010Princeton5,142CMU5,830First-time, First-year Enrollment Fall 2010Princeton1,312CMU1,486First-year Retention Rate Fall 2009 CohortPrinceton99%CMU96%Six-year Graduation Rate Fall 2004 CohortPrinceton96%CMU87%Total Degrees Awarded 2009-10PrincetonCMU1,9923,584
Return to Table of ContentsRensselaer Polytechnic Institute (RPI)Location: Troy, New YorkTuition, Fees, Room, and Board: 54,679Established: 1824Student to Faculty Ratio: 16:1Institutional Data: http://provost.rpi.edu/node/88Total Enrollment Fall 2010RPI6,704CMU11,340Graduate Enrollment Fall 2010RPI1,273CMU5,510Undergraduate Enrollment Fall 2010RPI5,431CMU5,830First-time, First-year Enrollment Fall 2010RPI1,154CMU1,486First-year Retention Rate Fall 2009 CohortRPI91%CMU96%Six-year Graduation Rate Fall 2004 CohortRPI83%CMU87%Total Degrees Awarded 2009-10RPICMU1,7903,584
Return to Table of ContentsRice University (Rice)Location: Houston, TexasEstablished: 1912Institutional Data: www.rice.edu/OIRTuition, Fees, Room, and Board: 47,851Student to Faculty Ratio: 8:1Total Enrollment Fall 2010Rice5,879CMU11,340Graduate Enrollment Fall 2010Rice2,350CMU5,510Undergraduate Enrollment Fall 2010Rice3,529CMU5,830First-time, First-year Enrollment Fall 2010Rice949CMU1,486First-year Retention Rate Fall 2009 CohortRice95%CMU96%Six-year Graduation Rate Fall 2004 CohortRice93%CMU87%Total Degrees Awarded 2009-10RiceCMU1,5823,584
Return to Table of ContentsStanford University (Stanford)Location: Stanford, CaliforniaTuition, Fees, Room, and Board: 52,883Established: 1891Student to Faculty Ratio: 10:1Institutional Data: Total Enrollment Fall 2010Stanford19,535CMU11,340Graduate Enrollment Fall 2010Stanford12,595CMU5,510Undergraduate Enrollment Fall 2010StanfordCMU6,9405,830First-time, First-year Enrollment Fall 2010Stanford1,672CMU1,486First-year Retention Rate Fall 2009 CohortStanford98%CMU96%Six-year Graduation Rate Fall 2004 CohortStanford94%CMU87%Total Degrees Awarded 2009-10StanfordCMU4,7123,584
Return to Table of ContentsWashington University in St. Louis (Washington)Location: St. Louis, MissouriTuition, Fees, Room, and Board: 55,111Established: 1853Student to Faculty Ratio: 7:1Institutional Data: http://research.wustl.eduTotal Enrollment Fall 2010Washington13,820CMU11,340Graduate Enrollment Fall 2010WashingtonCMU6,6825,510Undergraduate Enrollment Fall 2010WashingtonCMU7,1385,830First-time, First-year Enrollment Fall 20101WashingtonCMU1,6321,486First-year Retention Rate Fall 2009 CohortWashington97%CMU96%Six-year Graduation Rate Fall 2004 CohortWashington94%CMU87%Total Degrees Awarded 2009-10WashingtonCMU3,8633,584
Peer Comparisons Data Sources: Academe: Bulletin of the American Association of University Professors IPEDS: National Center for Education Statistics Integrated Postsecondary Education Data System NACUBO: National Association of College and University Business Officers U.S. News & World Report: U.S. News & World Report's "America's Best Colleges"