Transcription
Korea-Australia Rheology Journal, Vol.24, No.3, pp.211-219 (2012)DOI: ological properties of polyvinylsiloxane impression materials before mixingand during setting related to handling characteristicsHyang-Ok Lee and In-Bog Lee*Department of Conservative Dentistry and Dental Research Institute, School of Dentistry,Seoul National University, Seoul, South Korea(Received June 26, 2012; final revision received August 22, 2012; accepted August 23, 2012)AbstractThe purpose of this study is to determine and compare the handling and rheological properties of polyvinylsiloxane impression pastes before mixing and during setting, and to investigate the effect of its constituents on the properties of the materials. Five polyvinylsiloxane impression materials (Examixfine,Extrude, Honigum, Imprint II, and Express) were used. A flow test and a drip test were performed to determine the handling characteristics. The rheological properties of each impression material prior to mixing(shear stress, viscosity) and during setting (storage modulus G’, loss modulus G’’, loss tangent tanδ) weremeasured with a stress-controlled rheometer at 25oC and 32oC, respectively. Inorganic filler content of eachimpression material was measured and observed with a SEM. The molecular weight distribution of polymermatrix was determined with a gel permeation chromatography (GPC). Express and Honigum display lowerflow compared to the other materials, due to their high yield-stress values. Examixfine exhibits the greatestflow. All materials display pseudoplastic behavior, excluding the Examixfine catalyst. The viscosities at lowshear rate are greatest for Express and Honigum; however, under high shear conditions, the viscosities ofExtrude and Honigum are the lowest. Following mixing, each material show an increase in G’, finally reaching a plateau, and the tanδ rapidly decreases with time. Imprint II shows the highest final G’ as well as themost rapid decrease in tanδ. Express and Imprint II present the highest filler content and rough filler surface,while Honigum shows the lowest filler content and small filler particles. Most products are composed ofpolymers over 30 kDa and oligomers less than 1 kDa. Each impression material possesses different rheological properties, which significantly affect the handling characteristics. The yield stress of the impressionmaterial minimizes unnecessary flow prior to and after seating. Viscoelastic change during setting of eachimpression material determines the setting time and the stiffness after setting. These rheological propertiesof impression materials are affected by the filler content and molecular weight distribution of polymer matrix.Keywords: polyvinylsiloxane, impression material, rheology, flow, handling characteristics1. IntroductionRubber impression materials are the most widely used inrestorative dentistry, and many different products can befound on the market. According to the manufacturer, eachimpression material differs in many aspects such as accuracy, elastic recovery, dimensional stability, flow, flexibility, handling characteristics, and hydrophilicity. In the past,accurate reproduction of tooth surfaces was considered acritical issue, but as accuracy has become somewhat guaranteed by improvements in technology, the handling characteristics of impression materials have emerged as a newarea of interest (Rubel, 2007; Darvell, 2009; Min, 2010).The handling characteristics of impression materials aredetermined by several factors such as ease of mixing, flow,and setting time. Currently, most impression materials are*Corresponding author: inboglee@snu.ac.kr 2012 The Korean Society of Rheology and Springerprovided with an automix system, and therefore little difference exists in the ease of mixing among materials. Also,the setting time is provided by the manufacturer. In contrast, rheological properties, such as viscosity and flow, aredifferent for each product and significantly affect the handling characteristics (Darvell, 2009; Park and Song, 2010).Appropriate flow is essential to obtain a detailed impression, but some products possess excessive flow so that theimpression material flows into the patient's throat, resultingin discomfort. Therefore, evaluation of the rheologicalproperties that affect the handling characteristics of impression materials is very important.The flow of impression materials were studied as early asthe 1960s, but these studies consisted of simple viscositymeasurements using a rheometer (Braden, 1967; Combeand Moser, 1978). More recently, the viscoelastic behaviorsof polyether, polysulfide, polyvinylsiloxane, and condensation silicone before and during setting was investigated211
Hyang-Ok Lee and In-Bog LeeTable 1. Impression materials used in this study and setting times provided by the manufacturer.MaterialTypeSetting timeManufacturerExamixfinePolyvinylsiloxane Light body (Base, Catalyst)4 minGC (Tokyo, Japan)ExtrudePolyvinylsiloxane Light body (Base, Catalyst)6 minKerr (Romulus, MI, USA)HonigumPolyvinylsiloxane Light body (Base, Catalyst)3.5 minDMG (Hamburg, Germany)Imprint IIPolyvinylsiloxane Light body (Base, Catalyst)4 min3M ESPE (St Paul, MN, USA)ExpressPolyvinylsiloxane Light body (Base, Catalyst)5 min3M ESPE (St Paul, MN, USA)(McCabe and Arikawa, 1998). The yield-stresses and viscosities of the bases and catalysts of polyvinylsiloxaneimpression materials contributed to the non-drip property ofthe impression material (Martinez et al., 2001). The effectof temperature on rheological properties has also been studied (Berg et al., 2003).Most previous studies either measured only the flow ofthe base and catalyst before mixing or measured the viscoelastic development during setting. The viscoelasticcharacteristics during setting of impression materials areaffected not only by the polymerization reaction but alsoby the rheological properties of its constituents. Therefore,combined studies that measure both the rheological characteristics of the impression materials prior to and aftermixing can better relate their results to the clinical situations. In addition, the micro-level analysis of the materialscan help understand the rheological properties.The purpose of this study is to determine and comparethe handling and rheological characteristics of five different polyvinylsiloxane impression materials before and aftermixing, and to relate these properties to material aspects interms of filler and polymer matrix.2. Materials and Methods2.1. MaterialsFive commercially available polyvinylsiloxane lightbody impression materials were studied and their brandnames and manufacturers are listed in Table 1.2.2. Flow testTo determine the flow behavior of the impression materials before mixing, 0.05 mL each of the base and catalystof each impression material were placed separately onto a25oC hydrophilic glass plate using a 1 mL syringe and acustom made loading device (Lee et al., 2010). After thematerial was allowed to flow for 3 min, the spread diameter was measured with a digital caliper (NSK, Tokyo,Japan). Five measurements were performed for the baseand catalyst of each impression material.2.3. Drip testIn order to investigate the flow characteristics of mixed212impression materials during setting in oral temperature, adrip test was done. Using a 1 mL syringe, 0.1 mL of mixedimpression material was placed onto a hydrophilic glassplate maintained at a temperature of 32oC on a hot plate(Barnstead Thermolyne, Hampton, NH, US). After marking the center of the impression material, the glass platewas stood up perpendicularly for 5 min. The lower end ofthe dripped material was marked with a line, and the distance from the center to the line was measured as theamount of flow for that material during setting. Five measurements were made for each material.2.4. Measurement of rheological properties of impression materials2.4.1. Measurement of the viscosities of impressionmaterials prior to mixingThe AR 2000 stress-controlled rheometer (TA instruments, Leatherhead, Surrey, UK) was used to measure therheological properties of impression materials prior to mixing. Viscosity change as a function of shear rate was measured using the steady state flow test with a cone and plategeometry (2o cone angle and 60 mm diameter) within ashear rate range of 0-15/s. The base and catalyst were measured separately at 25oC.2.4.2. Measurement of the viscoelastic changes inmixed impression materials during settingTo measure the viscoelastic changes in the mixed impression materials during setting, a dynamic oscillation-timesweep test was performed using parallel aluminum plateswith diameters of 20 mm and a 500 µm gap between thetwo plates. After loading 0.16 mL of the mixed impressionmaterial onto the Peltier plate set at 32oC, the changes instorage modulus (G ′ ), loss modulus (G ″ ), and loss tangent(tan δ) were measured for ten minutes at an oscillating frequency of 1 Hz and a maximum torque of 2000 µNm. Thetime from the beginning of mixing to measurement withthe AR2000 rheometer was less than one minute. Abovemeasurements were repeated three times for each material.2.5. Measurement of the filler content of impression materialsTo investigate the effect of the inorganic filler content onKorea-Australia Rheology J., Vol. 24, No. 3 (2012)
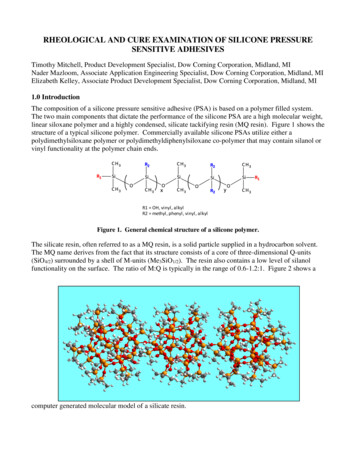
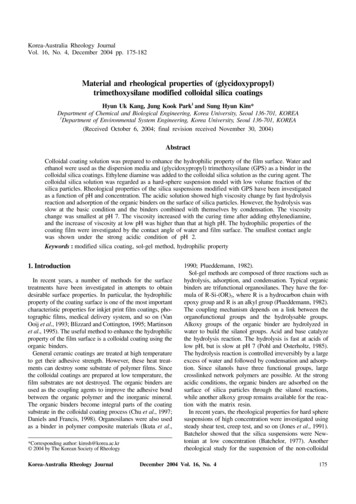
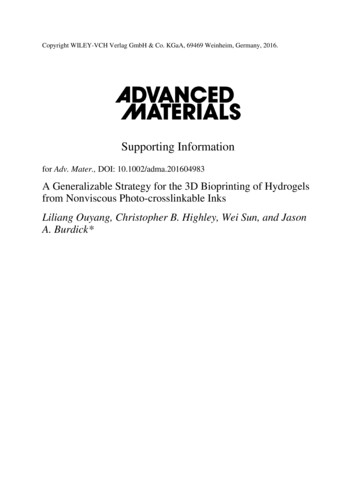
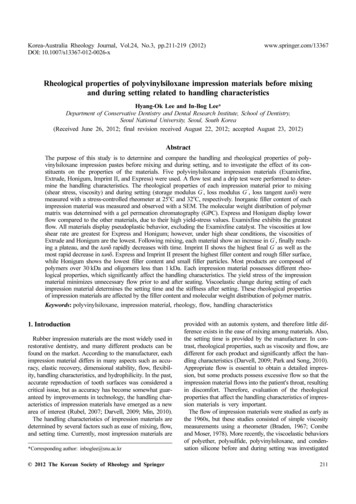
Rheological properties of polyvinylsiloxane impression materials before mixing and during setting related to handling characteristicsFig. 1. (Color online) Lateral view of impression materials allowed to flow for 3 min at 25oC.the viscosity of the impression materials, the fillerweight% was measured. The amount of 1 mL of eachimpression material was placed into a pre-weighed 15 mLplastic tube, which was then measured as a final weight.In order to remove the organic matrix, each material wasdissolved in 10 ml diethyl ether and centrifuged for10 min at 5000 rpm. The supernatant liquid phase wasthen removed, and the process was repeated three times toensure that only pure inorganic filler remained. The tubeswere placed in a dry furnace at 70oC for 24 hours. Fromthe weight difference the filler fraction was calculated.Three measurements were made for each material. Theshape and size of the inorganic fillers were examined witha SEM to investigate their effects on the rheological properties.Fig. 2. (Color online) Flow diameters (mm) of impression materials allowed to flow for 3 min at 25oC.3. Results2.6. Measurement of the molecular weight distributionof the organic matrix of impression materialsThe molecular weight of organic matrix was measured at35oC using a gel permeation chromatography (GPC) consisting of a Waters 510 HPLC pump (Waters, Milford,MA, US), three columns including PLgel 5.0 µm guard,MIXED-C, and MIXED-D (Polymer Laboratories, ChurchStretton, Shropshire, UK), and a Viscotek T60A dual detector (Viscotek , Houston, TX, US). HPLC grade Tetrahydrofurane (THF, J. T. Baker, Phillipsburg, NJ, US) was used asan eluent at a flow rate of 1.0 mL/min. The system was calibrated using polystyrene standards (Polymer Laboratories).Three measurements were made for each material.2.7. Statistical analysisThe data were analyzed using one-way ANOVA andTukey’s post hoc test at a significance level of 95% usingSPSS version 12.0 software. Additionally, a correlationanalysis was performed to investigate the relations betweenflow, drip distance, and the rheological variables.Korea-Australia Rheology J., Vol. 24, No. 3 (2012)3.1. Flow testFig. 1 shows the lateral profiles after flow of 0.05 mLof each base and catalyst for 3 min, while the diametersof flow are shown in Fig. 2. Examixfine catalyst demonstrates the highest flow, followed by Extrude catalyst,Examixfine base, and Extrude base (p 0.05). Examixfine and Extrude show higher flows for both the baseand catalyst when compared to the other products. Incontrast, the bases and catalysts of Express and Honigumdisplay low flows.3.2. Drip testExamixfine has the highest drip distance, followed by Extrude,Imprint II, Honigum, and Express (p 0.05). The resultsare similar to the results of the flow test (r 0.904) (Fig. 3).3.3. Rheological properties of impression materials3.3.1. The viscosities of impression materials prior tomixing213
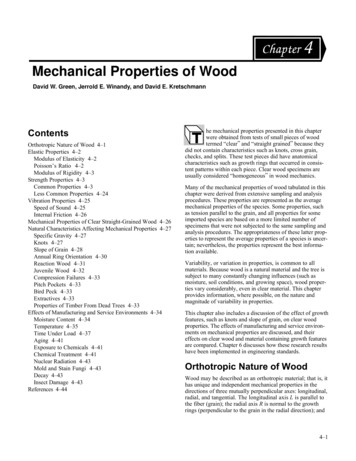
Hyang-Ok Lee and In-Bog LeeExpress demonstrate curves with yield stresses greater thanzero (Fig. 4-e,f). As you can see in Table 2, and Fig. 4-(e)and (f), the highest yield stress is found in the Expressbase, followed by the Honigum catalyst, Honigum base,and Express catalyst.3.3.2. Viscoelastic changes in mixed impression materials during settingThe viscoelastic changes in the mixed impressionmaterials during setting are shown in Table 3 and Fig. 5.The shear storage modulus G’ increases over time untilreaching a plateau, and each product differs in theamount of time required to reach the plateau and maximum value of the storage modulus (p 0.05) (Fig. 5-a).Honigum and Imprint II reach the plateau the fastest;Extrude is the slowest. At the plateau, Imprint II displaysthe highest G’ value and Extrude displays the lowest.The intersection of the slope of the increasing G’ withthe extension of the line from the plateau is determinedas the setting time. As a result, Honigum and Imprint IIshow the shortest setting times, while Extrude exhibitsthe longest (p 0.05). The values obtained shows a highcorrelation with the setting times provided by the manufacturers (r 0.983). The time required for the G’ toreach 0.2 MPa differs for each product, with the time forHonigum being the fastest at 121.3 s and the time forExtrude being the slowest at 312.4 s. The shear lossmodulus G’’ increases over time until reaching a maximum value and consequently decreases to a plateau area(Fig. 5-b). The loss tangent, tan δ, rapidly decreases withtime, with the times for the loss tangent to reach 1 beingfastest for Honigum at 16.8 s and slowest for Extrude at143.3 s (Table 3).Fig. 3. (Color online) Drip distances (mm) of impression materials for 5 min at 32oC after mixing.The changes in viscosity according to changes in shearrate are shown in Table 2 and in Fig. 4. Only the Examixfine catalyst displays no change in viscosity with anincrease in shear rate; all other impression materials demonstrates pseudoplastic behavior (Fig. 4-a,b). The viscosities at low shear rate (shear rate 0.01/s) are the highestfor Express and Honigum, while Examixfine and Extrudeshow the lowest values. The results are highly correlated tothe results of the flow test (r 0.925). Under a high shearrate of 10/s, the Examixfine base showes the highest viscosity, while the bases of Extrude and Honigum demonstrate the lowest viscosities.In the curve representing the change in shear stressaccording to change in shear rate, Examixfine and Extrudeshow zero shear stress at zero shear rate (Fig. 4-c,d). However, even with a zero shear rate, Honigum, Imprint II, andTable 2. The apparent viscosities (Pa.s) and yield stresses (Pa) of the five impression materials prior to mixing at different shear rates(γ: 1/s).MaterialViscosity (Pa.s)γ 0.01ExamixfineExtrudeHonigumImprint IIExpressBase0.1CYield stress .9)a37.8(0.5)a55.7(3.2)bNumbers in parentheses are standard deviations.Identical letters within a column are not significantly different (p 0.05).214Korea-Australia Rheology J., Vol. 24, No. 3 (2012)
Rheological properties of polyvinylsiloxane impression materials before mixing and during setting related to handling characteristicsFig. 4. (Color online) Rheological properties of the bases and catalysts of impression materials as a function of shear rate before mixing.(a) Apparent viscosity vs. shear rate for base pastes. (b) Apparent viscosity vs. shear rate for catalyst pastes. (c) Shear stress vs. shearrate for base pastes of Examixfine and Extrude (yield stress 0). (d) Shear stress vs. shear rate for catalyst pastes of Examixfine andExtrude (yield stress 0). (e) Shear stress vs. shear rate for base pastes of Honigum, Express, and Imprint II (yield stress 0). (f) Shearstress vs. shear rate for catalyst pastes of Honigum, Express, and Imprint II (yield stress 0).Table 3. The storage moduli (G’) and loss tangents (tan δ) at different elapsed times, setting times, times to reach G’ 0.2 MPa, andtimes at tan δ 1 for the impression materials during setting at 32oC.Materialt 1 mint 3 mint 10 minSetting time (s)Time atG’ 0.2 MPaTime attan δ 10.02208.3 (4.4)c149.3 (4.5 )c53.7 (4.7)c0.03382.2 (4.4)a312.4 (5.7)a143.3 (10.7)adG’ (Pa)tan δG’ (Pa)tan δG’ (Pa)tan 83700.00.01190.1 (7.2)121.3 (10.5)16.8 (11.0)dImprint II14.211.9275453.30.19751833.00.02191.9 (4.2)d140.5 (0.5)c89.7 (1.4)bExpress45.16.4842196.70.19679700.00.04283.8 (4.3)b179.7 (4.6)b74.4 (2.1)bNumbers in parentheses are standard deviations.Identical letters within a column are not significantly different (p 0.05).* Setting time is defined as the point at which the increasing slope meets the plateau.3.4. Inorganic filler content of impression materialsThe mean values of weight% of inorganic fillers arelisted in Table 4. Express and Imprint II present the highestfiller content (47.2 - 50.0%), while Honigum showes thelowest value (26.4 - 28.5%). There is no direct liner relation between the filler weight% and the viscosity ofimpression materials (r 0.149). However, except Honigum,there is a positive correlation between the filler weight %and the viscosity (r 0.854).The SEM morphologies of the fillers are shown in Fig. 6,where the inorganic fillers consist of different sizes and shapes.In general, the base and catalyst of each material have the sameinorganic fillers. Examixfine ( 12 µm) and Honigum ( 8 µm)Korea-Australia Rheology J., Vol. 24, No. 3 (2012)present irregular (angular) shaped fillers. Imprint II andExpress have spherical filler particles with rough surface( 16 µm), and Extrude has rod shape particles ( 38 µm).3.5. Molecular weight distribution of the organicmatrix of impression materialsMolecular weights of the organic matrix are listed inTable 5. Except Honigum, GPCs of most products showdistinct two peaks (Fig. 7). One is the high molecularweight polymer peak over 30 kDa and the other is oligomer peak less than 1 kDa. In Honigum, high molecularweight polymer peak over 30 kDa and oligomer peaks of0.4 - 3 kDa are consecutively appeared.215
Hyang-Ok Lee and In-Bog LeeFig. 5. (Color online) (a) Shear strorage moduli (G’). (b) Shear loss moduli (G’’). (c) Loss tangents (tan δ) of impression materials asa function of time during setting at 32oC.Table 4. Molecular weights of the polymer matrix and the filler weight% of impression materials.MaterialsExamixfineExtrudeHonigumImprint IIExpressMolecular weights of polymer matrixBase84300Filler weight%34.1 (3.0)c80040039.9 (1.8)bCatalyst44100800Base3400080041.2 (0.3)bCatalyst3230080041.5 (0.4)bBase316003200150080040028.5 (0.3)dCatalyst420002900130070040026.4 (0.2)dBase3390080040049.1 (0.4)aCatalyst3820080040047.2 (1.2)aBase3920080040050.0 (0.4)aCatalyst3930080040048.0 (0.5)aNumbers in parentheses are standard deviations.Same letters within a column are not significantly different (p 0.05).4. DiscussionHandling characteristics of impression materials cannotbe considered independently from rheological properties,which are determined by the components of the materialsuch as filler amount, size and shape, monomer blend, and216degree of cross-linking (Balkenhol et al., 2007; Samaniuket al., 2011). Therefore, in order to evaluate the handlingcharacteristics, both the rheological characteristics andpolymerization reaction should be considered. This studyevaluates the handling characteristics of bases and catalystsprior to mixing using the flow test and compares the resultsKorea-Australia Rheology J., Vol. 24, No. 3 (2012)
Rheological properties of polyvinylsiloxane impression materials before mixing and during setting related to handling characteristicsFig. 7. (Color online) Representative GPC curves of impressionmaterials. (a) Base paste of Examixfine. (b) Base paste ofHonigum. Honigum showed a broader molecular weight spectrum of organic matrix.The flows of the base and catalyst before mixing are notaffected by the setting reaction; therefore, molecular interactions and the resulting yield stress play an important role. Amaterial with yield stress will not flow until the applied stressexceeds the yield stress. In the flow test, the stress applied tothe base area of the extruded impression material is proportional to its own weight. This can be expressed as follows:ρVgStress ---------AFig. 6. SEM images of inorganic fillers of impression materials.(a) Base paste of Examixfine. (b) Catalyst paste of Examixfine.(c) Base paste of Extrude. (d) Catalyst paste of Extrude. (e) Basepaste of Honigum. (f) Catalyst paste of Honigum. (g) Base pasteof Imprint II. (h) Catalyst paste of Imprint II. (i) Base paste ofExpress. (j) Catalyst paste of Express.with the rheological properties such as viscosity and yieldstress. Moreover, to evaluate the effect of polymerizationon the handling characteristics, the drip test was performedfrom the beginning of mixing until final setting of theimpression materials. This effect was also analyzed withthe viscoelastic behavior during setting.Korea-Australia Rheology J., Vol. 24, No. 3 (2012)(1)when ρ is the density, V the volume, g the gravity, and Ais base area.In this study, a 1 mL syringe was used to place 0.05 ml ofimpression material. The diameter of the syringe opening isapproximately 2 mm. Therefore the initial diameter of theimpression material placed onto the glass plate via the syringeis assumed to be 2 mm. Immediately following placement, theextrusion pressure and gravity cause the material to flow andspread laterally resulting in increase of the base area ofextruded material. Consequently, the applied stress decreasesand reaches the material’s yield stress, and the impressionmaterials would no longer flow. At that moment, the appliedstress is approximately the same as the yield stress:ρVgApplied stress Yield stress ---------2- .πR(2)217
Hyang-Ok Lee and In-Bog LeeTherefore, the spread diameter, R, of an impression material is given by:ρVgR ----------------------------------.π Yield stress(3)The highest flow of Examixfine and Extrude can beexplained by their zero yield stress. In contrast, Honigumand Express show low flows and high slumping resistances, which is caused by their high yield stresses in therange of 55-132 MPa (Table 2, Fig. 1, 2 and 4).Viscosity is determined by intermolecular shear forcesuch as interactions between monomer and filler or betweenfillers. Therefore, the chemical composition of polymer andthe shape and amount of filler are major factors in determining the viscosity (Lee et al., 2003; Lee et al., 2006). Theviscosity at a shear rate of 0.01/s can be considered as theviscosity prior to and after seating the impression materialin the patient's mouth, a condition in which shear force doesnot exist. Judging from the high viscosity values ofHonigum and Express, it can be inferred that comparativelyhigher molecular interactions exist in these materials whenno shear force exists. This characteristic minimizesunwanted flow before and after seating, which is highlybeneficial for both the patient and the dentist.The viscosity at a shear rate of 10/s can be considered asthe viscosity of the material being extruded from the automix gun or being seated in the patient’s mouth. These areconditions in which a high shear force is applied and underwhich most impression materials exhibit pseudoplasticbehavior (McCabe and Browman, 1981; German et al.,2008). The pseudoplasticity of a material is determined bythe molecular interactions and the agglomerations of particles. When shear force is applied, these entanglementsand agglomerations are partially destroyed and reformed aschanges occur in arrangement, direction, folding, twisting,and bonding among molecules. In this study, Honigumshows the highest pseudoplasticity, which provides easewhen extruding the impression material into the tray andseating the material in the patient's mouth. This is alsohelpful in reproducing minute details.In order to reproduce clinical conditions, the drip test andmeasurement of the viscoelastic change after mixing wereperformed at 32oC, the intraoral temperature when themouth is open. In contrast to the flow test, the drip test isaffected by the polymerization reaction in addition to theviscosity of the material. Drip distance decreases in the following order: Examixfine, Extrude, Imprint II, Honigum,and Express, corresponding to the decreasing order of flowdiameter (Fig. 2 and 3). This implies that the viscosity ofthe base and catalyst prior to mix can affect the flow of theimpression material during setting (r 0.903).The degree of cross-linking of impression materials dueto polymerization can be determined by measuring theshear storage modulus and the loss tangent (McCabe and218Carrick, 1989). As polymerization progresses, the storagemodulus increases, while the loss tangent decreases. In thisstudy, the storage modulus G’ increases with time andeventually reaches a plateau. This illustrates an increase incross-linking and progression of the gelation process. Thetime required to reach the plateau is different for eachmaterial, and the values are not significantly different tothe setting time provided by the manufacturers (r 0.983).At the initial point of the plateau (completion of polymerization), Imprint II shows the highest storage modulus(stiffness), and Extrude exhibits the lowest storage modulus (high flexibility) (Fig. 5-a). A material with a low storage modulus after setting can be easily removed from theoral cavity as a cast. Furthermore, it is useful to makeimpressions of teeth with large undercuts or mobility.The loss tangent of a material is the ratio of lost energyto stored energy during the process of transformation. Alarge loss tangent indicates viscous behavior with a largeloss of energy, while a small loss tangent implies elasticbehavior. Impression materials show a decrease in loss tangent during setting. The more rapidly the loss tangentdecreases, the faster the elasticity will appear. In this study,Imprint II has the highest initial tan δ value, which rapidlydecreases with time (Fig. 5-c). This result corresponds tothe results regarding the storage modulus.This study analyzes not only the rheological properties ofmaterial, but also material itself in terms of filler and polymer matrix. Impression materials are composed of inorganic fillers and low-molecular weight polymers. Withrespect to fillers, impression material is suspension that isa heterogeneous fluid containing solid filler particles. Anumber of factors influence the rheology of a suspension,including filler particle size, particle size distribution, andthe volume fraction of the filler. The effect of volume fraction on viscosity is described using the Krieger-Doughertyηϕequation (Barnes et al., 1989), ----- 1 – ------ η0ϕm–[ η ]ϕm, where η isthe viscosity of the suspension, η0 is the apparent viscosityof the medium, η is the volume fraction of solids in thesuspension, ϕm is the maximum volume fraction of solidsin suspension, and [η] is the intrinsic viscosity of the suspension, which is 2.5 for spheres. This equation indicatesan increase in viscosity with increase in filler volume fraction. As the volume fraction of solids in the systemincreases, the particles become more closely packedtogether resulting in increase of particle-particle interactions and resistance to flow.The high initial viscosity of Imprint II and Express canpartly be explained by their high filler content. In addition,fillers of both products shows rough surface with nanosized irregularities. Increased surface roughness wouldcontribute to an increase in particle-particle interaction.Surprisingly, in spite of low filler content of Honigum, itKorea-Australia Rheology J., Vol. 24, No. 3 (2012)
Rheological properties of polyvinylsiloxane impression materials before mixing and during setting related to handling characteristicsshows high initial viscosity value. It can be explained bythat Honigum has smaller filler particles compared to otherproducts and a high number of smaller particles with highsurface area would lead more interactions between polymer and particles or between inter-particles (Fig. 6).The GPC analysis shows that the polymer matrix ofimpression material is composed of several oligomers orpolymers with different molecular weights. The molecularweights measured by the GPC are relative weights compared to polystyrene using a calibration curve. In addition,because the detector of the instrument sensed the change ofrefractory index of polymer in THF eluent, the concentration of specific polymer cannot be quantified based onthe intensity of GPC curve. Therefore, based on the resultsof GPC, the influence of polymer matrix on the rheologicalproperties of impression materials cannot easily be analyzed. However, GPC shows the difference in polymermatrix between products. The broader molecular weightspectrum of organic matrix of Honigum might partlyexplain the highest initial viscosity despite of its low fillercontent (Fig. 7).In the future study, we
the AR2000 rheometer was less than one minute. Above measurements were repeated three times for each material. 2.5. Measurement of the filler content of impres-sion materials To investigate the effect of the inorganic filler content on ′″ Table 1. Impression materials used in this study and setting times provided by the manufacturer.