Transcription
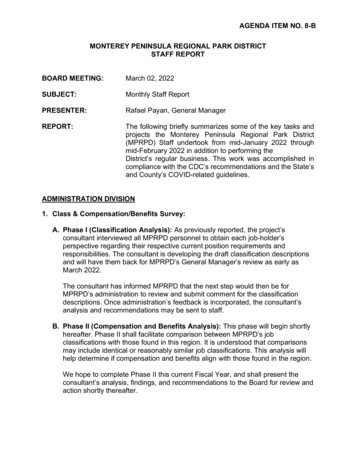
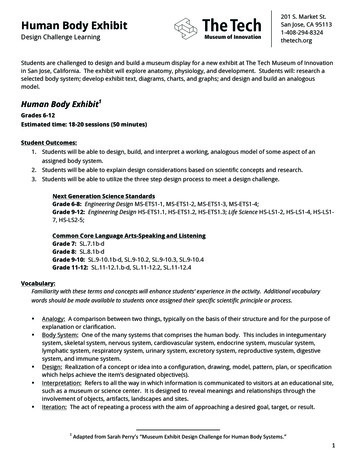
Exhibit 1. The Impact of Health Reform:Percent of Women Ages 19–64 Uninsured by State2008–092019 19%– 23%7%– 14%14%– ource: Urban Institute and Kaiser Commission on Medicaid and the Uninsured estimates based on the CensusBureau’s March 2009 and 2010 Current Population Survey (CPS: Annual Social and Economic Supplements),available at www.statehealthfacts.org, “Health Insurance Coverage of Women 19–64, states (2008–2009).”Estimates for 2019 by Jonathan Gruber and Ian Perry of MIT using the Gruber Microsimulation Modelfor The Commonwealth Fund.NJRICTDEMDDC
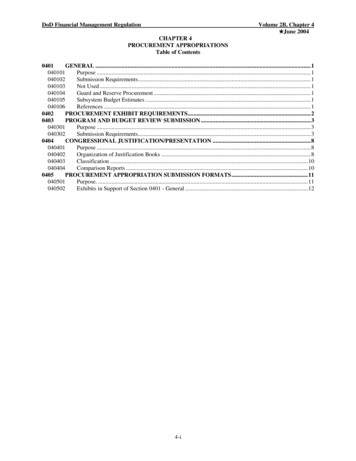
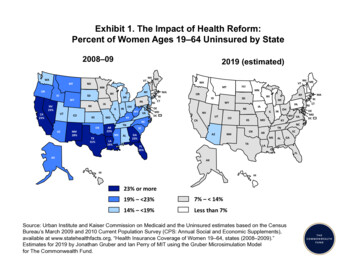
Exhibit 2. Uninsured Rates Are High Among Women with Low Incomes,Young Adults, and Hispanics in 2010Percent of women ages 19–645251413430292419226PovertyAgeSubgroups may not sum to totals because of rounding.Note: FPL refers to Federal Poverty Level.Source: The Commonwealth Fund Biennial Health Insurance Survey (2010).Race/ethnicity
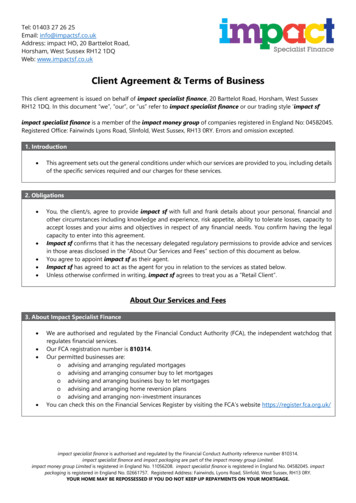
Exhibit 3. Women Struggle to Find Affordable Coveragein the Individual MarketWomen ages 19–64 withindividual coverage* orwho tried to buy it inpast three years and:TotalHealthproblem**No healthproblem 200%FPL200% FPLFound it very difficult orimpossible to find coveragethey needed46%55%34%47%40%Found it very difficult orimpossible to find affordablecoverage6074446454Were turned down, chargeda higher price because ofhealth, or had a health problemexcluded from coverage3344213930Any of the above7185557765Never bought a plan5364396440Note: FPL refers to Federal Poverty Level.* Bought in the past three years.** Respondent rated health status as fair or poor, has a disability or chronic disease that keeps them from working fulltime or limits housework/other daily activities, or has any of the following chronic conditions: hypertension or high bloodpressure; heart disease, including heart attack; diabetes; asthma, emphysema, or lung disease; high cholesterol.Source: The Commonwealth Fund Biennial Health Insurance Survey (2010).
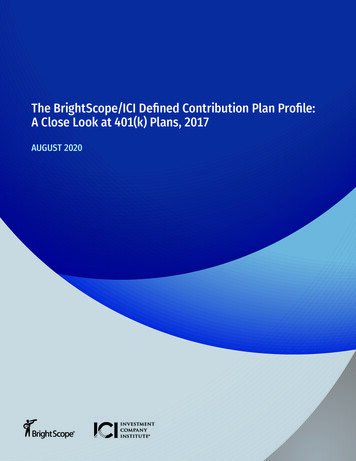
Exhibit 4. The Share of Women Spending 10 Percent or Moreof Their Income on Health Care Climbed over the Past Decade,Especially for Women with Low IncomesPercent of women ages 19–64 who spent 10% or more of householdincome annually on out-of-pocket costs and premiums*Note: FPL refers to Federal Poverty Level.* Base: Women who specified income level and private insurance premium/out-of-pocket costsfor combined individual/family medical expenses.Source: The Commonwealth Fund Biennial Health Insurance Surveys (2001 and 2010).
Exhibit 5. Growing Numbers of Women Are Affected byMedical Bill and Debt ProblemsPercent of women ages 19–64 with medical bill problems or accrued medical debt*Note: FPL refers to Federal Poverty Level.* Had problems paying medical bills, contacted by a collection agency for unpaid bills,had to change way of life in order to pay medical bills, or has outstanding medical debt.Source: The Commonwealth Fund Biennial Health Insurance Surveys (2005 and 2010).
Exhibit 6. Problems Accessing Needed Care Worsened for WomenAcross the Income Spectrum over the Past DecadePercent of women ages 19–64 who had any of four access problems*in past year because of costNote: FPL refers to Federal Poverty Level.* Did not fill a prescription; did not see a specialist when needed; skipped recommended medical test, treatment,or follow-up; had a medical problem but did not visit doctor or clinic.Source: The Commonwealth Fund Biennial Health Insurance Surveys (2001 and 2010).
Exhibit 7. Less Than Half of Women Are Up to Datewith Recommended Preventive Care*Percent of women ages 19–64Total 133%FPL88%82%91%91%94%Cholesterol checked7258747685Received cervical cancer screening7464738086Received colon cancer screening4636305454Received mammogram7252607585Up to date with preventive care*4635445657Blood pressure checked133%–250%–400% 249% FPL 399% FPLFPLNote: FPL refers to Federal Poverty Level.* Cervical screen in past year for females ages 19–29, past three years ages 30 ; colon cancer screening in past fiveyears for adults ages 50–64; and mammogram in past two years for ages 50–64; blood pressure checked in pastyear; cholesterol checked in past five years (in past year if has hypertension or heart disease).Source: The Commonwealth Fund Biennial Health Insurance Survey (2010).
Exhibit 8. Timeline for Health Reform Implementation: Coverage Provisions20102011201220132014201520162017Small business tax creditEarly Retiree Reinsurance ProgramPre-existing condition insurance plansYoung adults up to age 26 on parents’ plans Prohibitions against lifetime benefit caps and rescissions Preventive services coverage without cost-sharing No pre-existing exclusions for children Phased-in ban on annual limitsStates adopt exchange legislation, implement exchanges(2011–2013)Annual review of premium increasesPublic reporting by insurers on share of premiums spent on medical costsInsurers must spend at least 85% of premiums (large group) or 80% (small group /individual) on medical costs or provide rebates to enrolleesExchanges begin certifyingQualified Health PlansHHS certifiesexchangesExchange openenrollment beginsMedicaid expansionInsurance market reforms including no rating on health or genderEssential benefits standardPremium and cost-sharing credits for exchange plansPremium increases a criterion for carrier exchange participationIndividual requirement to have insuranceEmployer shared responsibility paymentsOption for statewaiver to designalternativecoverageprogramsSource: National Association of Insurance Commissioners; Commonwealth Fund Health Reform Resource Center: What’s in the Affordable Care Act? (PL 111–148and 111–152), th-Reform-Resource.aspx.
Exhibit 9. Most of the 27 Million Women Who Were UninsuredDuring 2010 Will Gain Coverage in 2014Subsidized privateinsurance withconsumer protections8 millionMedicaid14 millionNonsubsidizedprivate insurance withconsumer protections1 millionIncome undesignated4 million27 million women ages 19–64 who wereuninsured during the year in 2010Source: The Commonwealth Fund Biennial Health Insurance Survey (2010).
Exhibit 10. Under the Affordable Care Act, Women Will Benefit fromNewly Subsidized Sources of Health InsuranceWomen ages 19–64MedicaidSubsidized privateinsurancePrivateinsuranceTotal 133%FPL133%–249%FPL250%–399%FPL400% FPLUninsured anytime during the year29%27 million51%30%18%6%Any bill problem or medical debt*44%42 million58664321Any cost-related access problem**48%45 million65594428Spent 10% or more of householdincome on premiums***15%7 million4324106Spent 10% or more of householdincome on premiums and totalout-of-pocket costs****33%26 million48382322In the past 12 months:Note: FPL refers to Federal Poverty Level.* Includes: had problems paying or unable to pay medical bills; contacted by collection agency for unpaid medical bills; hadto change way of life to pay bills; medical bills being paid off over time. ** Includes any of the following because of cost:had a medical problem, did not visit doctor or clinic; did not fill a prescription; skipped recommended test, treatment, orfollow-up; did not get needed specialist care. *** Base: women who specified income level and premium for privateinsurance plan. **** Base: women who specified income level and premium/out-of-pocket costs for combinedindividual/family medical expenses.Source: The Commonwealth Fund Biennial Health Insurance Survey (2010).
insurance plan. **** Base: women who specified income level and premium/out-of-pocket costs for combined individual/family medical expenses. Source: The Commonwealth Fund Biennial Health Insurance Survey (2010). Women ages 19-64 Medicaid Subsidized private insurance Private insurance Total 133% FPL 133%-249% FPL 250%-399% FPL 400% FPL