Transcription
Calculating Trade-offs in DataCenter DesignData Center Science Center, Schneider ElectricJuly 21, 2020
Topics1TradeOff Tools overview2Tips for viewing TradeOff Tools3One slide overview of each tool4Summary5Demo
Schneider Electric TradeOff Tools Simple, automated tools to support specificplanning decisions Models complex interactions of systems based ondata and science One-screen, standardized user interface Instant output allows for rapid creation of “what if”scenarios Optimized for use on PCs and tablets (can also beused on smart phones)Free tools at https://tools.apc.com ness/data-centers-and-networks/trade-off-tools/
Where do the tools come in?1At the beginningof the planning process23White Paper14245CapacityBudgetGrowth planCriticalityEfficiencyDensity
Difficult questions can affect or delay critical planningdecisionsShould I build a data center or outsource to a colo1?Should I build out now or inphasesWhat is the capital costof different alternatives2?What density should I plan for3Should I implement Li-ion or VRLA batteries4?What would I need to do to hit a specific efficiency(PUE) target5?
Tips for viewing TradeOff Tools 1.For PCs & Macs, preferred browser is Google Chrome(Mozilla Firefox is also supported)2.For tablets & smart phones, preferred browser is Google Chrome(Safari is also supported)3.Configure your browser’s pop-up blocker to allow pop-ups fromapc.com, apcmedia.com, and schneider-electric.com4.When using Google Chrome on a PC or Mac, it’s possible toview the tools in your local language by opening the Englishversion and right clicking and selecting “Translate to .” option5.To save your results as a PDF using Google Chrome, select theprint icon at the top of the tool, change Local Destination to“Save as PDF”, change Layout to “Landscape”, click on “Save”button, select file destination and fill in file name and click “Save”(Note for tools with multiple screens, you’ll have to repeat)6.To reset a tool to defaults, reload the page by right clicking andchoosing the reload choice or icon (or press Ctrl R)
Data Center Power Sizing CalculatorDetermine impact of server and storage configurations on IT load capacity and required utility input power Define basic characteristics of a datacenter’s IT load Server quantity & mixMainframesStoragePUE Estimate data center IT load capacity Calculate how much utility power is requiredto support IT load Demonstrate allocation on total powerrequirementhttps://www.apc.com/tool/?tt 1
Server Carbon & Energy Allocation CalculatorView impact of efficiency, load characteristics, and location on carbon and energy allocation for IT users Assign carbon and energy costs to ITusers, based on data center attributes: See annual energy and carbon allocationson a per-server basis, driven by: PUEIT loadLocationServersStorageNetworkingPhysical infrastructureIllustrate15 year allocationshttps://www.apc.com/tool/?tt 2
Data Center AC vs. DC Efficiency CalculatorView ipact of data center efficiency of various AC and DC power distribution architectures Compare energy efficiency of four differentpower distribution architectures Legacy 208 V ACBest practice 208 V AC415 V AC380 V DCDemonstrate how 415 V AC and 380 V DChave virtually same efficiencyhttps://www.apc.com/tool/?tt 3
Data Center Capital Cost CalculatorDetermine impact of physical infrastructure design choices on capital cost Quickly set data center budget expectations( /- 20%) Decide priority among competing designparameters Cost breakdown by subsystemCost breakdown by type of cost (material,labor, installation)CapacityBudgetGrowth planCriticalityEfficiencyCosts derived from actual configurations,quotes from 3rd party suppliers & partnershttps://www.apc.com/tool/?tt 4
Three Phase UPS Efficiency Comparison CalculatorGauge the impact of 3-phase UPS on energy costs and carbon footprint Compare 2 three phase UPS systems EfficiencyElectricity costCarbon footprint Assess UPSs from list of APC UPSs(measured data) or define own UPS Demonstrate how scaling UPSs to matchload impacts efficiency curve See efficiency, electricity cost, and carbonas function of IT loadhttps://www.apc.com/tool/?tt 5
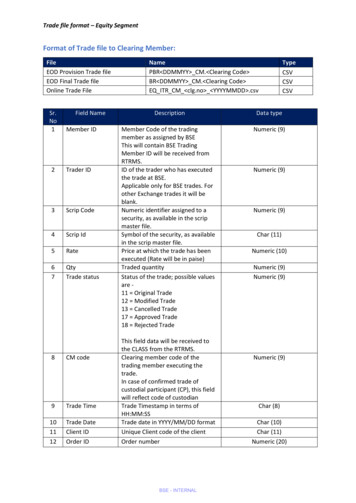
Data Center Efficiency & PUE CalculatorDetermine impact of alternative power and cooling approaches on energy cost Estimate annualized data centerefficiency of new or existing data center Power usage effectiveness (PUE)Power consumption by subsystemEnergy cost breakdown See the efficiency curve of the datacenter Determine efficiency impact of keydesign decisions RedundancyCooling / power architecturePercent loadhttps://www.apc.com/tool/?tt 6
Data Center Carbon Footprint CalculatorDetermine impact of changes in data center efficiency on energy costs and carbon footprint Illustrate how data center changes impactcarbon emissions LocationEfficiency (PUE)Load (kW) Determine savings in electricity as PUEimproves Estimate equivalent number of carsremoved from road Demonstrate 15-year cost and carbonsavingshttps://www.apc.com/tool/?tt 7
Data Center Capacity & Growth Planning CalculatorDetermine impact of power and cooling technology and growth plan strategies on design parameters Show how uncertainty of IT growth planimpacts costs Demonstrate how scaled buildout reducesdata center TCO. Key factors include: IT load profileStep sizeRedundancyPower & cooling architecture Compare PUE over data center life Compare runrate and cashflow analysishttps://www.apc.com/tool/?tt 8
Data Center Virtualization Saving CalculatorDetermine impact of server virtualization and data center design choices on energy and space savings Illustrate energy savings resulting fromserver virtualization Compare pre- and post-virtualization % energy savingsAnnual electric billEfficiency (PUE)Space requiredDemonstrate where energy savings comesfrom Entire data centerPhysical infrastructureTotal ITServershttps://www.apc.com/tool/?tt 9
Data Center InRowTM Cooling Containment SelectorDetermine impact of preferences and constraints on the recommended containment approach Generate optimal containmentconfiguration UncontainedHot aisle containmentRack air containmentRack air containment with frontcontainmentIdentify dimensions and layouts that limitconfiguration possibilitieshttps://www.apc.com/tool/?tt 10
Cooling Economizer Mode PUE CalculatorDetermine impact of geography and cooling characteristics on PUE, energy cost, and carbon emissions Determine optimal cooling economizerapproach based on: Climate (ASHRAE bin data)Data center loadIT operating environment (temperature &humidity)Compare common cooling architectures PUEEnergy costCarbonFull & partial economizer hourshttps://www.apc.com/tool/?tt 11
TMInRow Ancillary IT Equipment Cooling CalculatorDetermine impact of IT, cooling, & room characteristics on ability for row-based cooling to support ancillary IT loads Ancillary IT IT equipment not arranged inrows, such as: Tape librariesStorage equipmentNetworking gearPower distribution equipmentDetermine if additional cooling is requiredor if the existing InRow cooling issufficient, based on: IT parametersCooling parametersRoom characteristicshttps://www.apc.com/tool/?tt 12
Data Center Build vs. Colocation CalculatorDetermine impact of data center attributes and pricing model on TCO, cash cross-over point, and cash flow Impact of data center attributes andpricing model on TCO Compare financials: TCOBreak-even (years)Cash flow by yearKey assumptions: % un-scalable infrastructureMaintenance , staffingColo setup/installRemote hands for colohttps://www.apc.com/tool/?tt 13
Single Phase UPS Efficiency Comparison CalculatorDetermine impact of single phase UPS efficiencies on energy costs and carbon footprint Compare 2 single phase UPS systems EfficiencyElectricity costCarbon footprint Assess UPSs from list of APC UPSs(measured data) or define own UPS See efficiency, electricity cost, and carbonas function of IT loadhttps://www.apc.com/tool/?tt 14
Data Center Cooling Architecture CalculatorProvide the user with the optimal cooling architecture based on key data center attributes, preferences, and constraints Determine optimal cooling architecture basedon: Data center capacity and power densityThe containment and floor typeFinancial factors analyzedRecommended cooling architectures include: Heat removal methodEconomizer modeIndoor unit locationAir distributionhttps://www.apc.com/tool/?tt 15
Flywheel vs. VRLA Battery Carbon Footprint CalculatorView carbon impact of flywheels vs. VRLA batteries for energy storage of static UPSs Compare carbon footprint over entirelifecycle In most countries, batteries are“greener” Key drivers Location (energy source) Battery service lifehttps://www.apc.com/tool/?tt 16
Prefabricated vs. Traditional Cost CalculatorDetermine impact of design attributes on cost of prefabricated vs. traditional data centers Compare financials: Equipment costDesign installation costSpace costKey drivers: Cooling architectureRack densityPlacement of prefab modulesBuild vs. leasehttps://www.apc.com/tool/?tt 17
Traditional vs. OCP Capital Cost CalculatorView capital cost comparison and key drivers between traditional and Open Compute power architectures Compare financials: Capital cost summaryComparison at subsystem level tohighlight where cost differences occurKey drivers: Data center load mix of traditional & OCPTraditional server power supply oversizingand cost per watthttps://www.apc.com/tool/?tt 18
Lithium-ion vs. VRLA UPS Battery TCO CalculatorView TCO impact of lithium-ion vs. VRLA batteries for energy storage of static UPS Compare financials: Cumulative cost summary and chartillustrating cross-over pointBreakdown of TCO costsKey drivers: Replacement period for each energystorage typeRuntimehttps://www.apc.com/tool/?tt 19
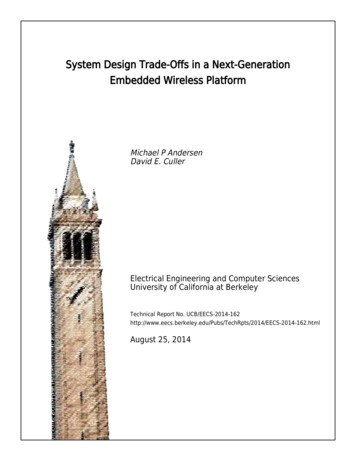
Rack Power Architecture Efficiency CalculatorCompare conventional ITE-level PSU architectures with centralized rack-level PSU architectures Compare performance of conventional PSUarchitecture with12V & 48V rack-level PSUarchitectures: EfficiencyLossesEnergy costKey drivers: PSU oversizingPSU redundancyComponent efficiencieshttps://www.apc.com/tool/?tt 20
Data Center Temperature Rise CalculatorUnderstand how temperatures rise when power and cooling is lost Examine how data center design can affecttemperature when power and cooling is lost Examine how to mitigate temperature risewhen power and cooling is lost Examine when best to switch back to primarypower after power loss Model a range of data center architectures,cooling, and power characteristics Provide industry standard alerts andrecommendationshttps://www.apc.com/tool/?tt 21
Data Center IT Pod Sizing CalculatorUnderstand the electrical and physical attributes of an IT pod Results based on: Input voltageInput break sizeDensity per rackCalculated results include: Maximum pod capacityRack countBranch breaker recommendationNumber of breakers & positions neededFootprint requiredhttps://www.apc.com/tool/?tt 23
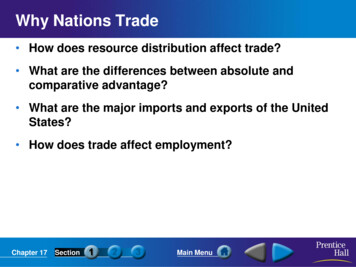
Three-Phase UPS Modernization Opex CalculatorEstimate the opex savings of replacing an aging 3-phase UPS with a new UPS Compare opex of aging vs. new 3-PH UPSsystems Electricity costMaintenance contract costBattery replacement costSpare parts replacement cost Assess cumulative costs and NPV over10-year life Demonstrate implications of operating anaging, less efficient UPS See opex cost drivershttp://www.apc.com/tool/?tt 25
Edge UPS Fleet Management Comparison CalculatorCompare costs of managing your own distributed UPSs vs. utilizing a 3rd party Compare costs for managing a distributedUPS fleet Transportation & parts costStaff costDowntime costVendor / partner service cost Assess annual costs & downtime for auser-defined asset age distribution Demonstrate how key variables impactoptimal approach Staff count, time allocation, and costDowntime events, recovery time, and costof downtimeFrequency of events requiring dispatch ofservice personnelhttp://www.apc.com/tool/?tt 27
TradeOff Tools SummaryWhat are TradeOff Tools?TradeOff Tools are simple, interactive tools, basedon data and science, that make it easy to varyparameters, experiment with “what if” scenarios andmake tradeoffs during data center planningWhen should they be used?Used early in the planning process, TradeOff Toolshelp avoid planning roadblocks by making informedand accurate decisionsHow do they help in planninga data center?TradeOff Tools help show quantifiable, tangiblebenefits of implementing certain technologies andjustify project decisions
Contact UsData Center Science Center Email at: DCSC@Schneider-Electric.comContact us with questions or commentswith TradeOff Tools or related s.apc.com
Rack Power Architecture Efficiency Calculator. Compare conventional ITE-level PSU architectures with centralized rack -level PSU architectures Compare performance of conventional PSU architecture with12V & 48V rack-level PSU architectures: Efficiency Losses Energy cost Key drivers: PSU oversizing PSU redundancy