Transcription
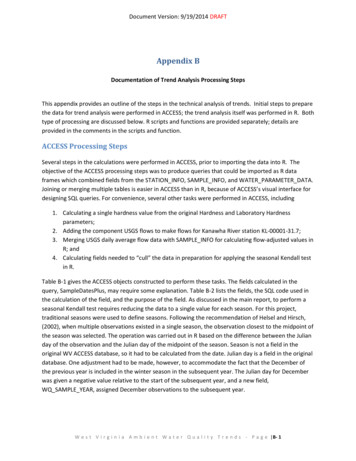
Document Version: 9/19/2014 DRAFTAppendix BDocumentation of Trend Analysis Processing StepsThis appendix provides an outline of the steps in the technical analysis of trends. Initial steps to preparethe data for trend analysis were performed in ACCESS; the trend analysis itself was performed in R. Bothtype of processing are discussed below. R scripts and functions are provided separately; details areprovided in the comments in the scripts and function.ACCESS Processing StepsSeveral steps in the calculations were performed in ACCESS, prior to importing the data into R. Theobjective of the ACCESS processing steps was to produce queries that could be imported as R dataframes which combined fields from the STATION INFO, SAMPLE INFO, and WATER PARAMETER DATA.Joining or merging multiple tables is easier in ACCESS than in R, because of ACCESS’s visual interface fordesigning SQL queries. For convenience, several other tasks were performed in ACCESS, including1. Calculating a single hardness value from the original Hardness and Laboratory Hardnessparameters;2. Adding the component USGS flows to make flows for Kanawha River station KL-00001-31.7;3. Merging USGS daily average flow data with SAMPLE INFO for calculating flow-adjusted values inR; and4. Calculating fields needed to “cull” the data in preparation for applying the seasonal Kendall testin R.Table B-1 gives the ACCESS objects constructed to perform these tasks. The fields calculated in thequery, SampleDatesPlus, may require some explanation. Table B-2 lists the fields, the SQL code used inthe calculation of the field, and the purpose of the field. As discussed in the main report, to perform aseasonal Kendall test requires reducing the data to a single value for each season. For this project,traditional seasons were used to define seasons. Following the recommendation of Helsel and Hirsch,(2002), when multiple observations existed in a single season, the observation closest to the midpoint ofthe season was selected. The operation was carried out in R based on the difference between the Julianday of the observation and the Julian day of the midpoint of the season. Season is not a field in theoriginal WV ACCESS database, so it had to be calculated from the date. Julian day is a field in the originaldatabase. One adjustment had to be made, however, to accommodate the fact that the December ofthe previous year is included in the winter season in the subsequent year. The Julian day for Decemberwas given a negative value relative to the start of the subsequent year, and a new field,WQ SAMPLE YEAR, assigned December observations to the subsequent year.W e s t V i r g i n i a A m b i e n t W a t e r Q u a l i t y T r e n d s - P a g e B- 1
Document Version: 9/19/2014 DRAFTTable B-1. ACCESS Queries Created for Trend AnalysisNameObject TypePurposeSelectedParametersTableList of parameters for trend analysisUSGSFlowTableImport of daily average flow from USGS gagesGageStationListTableLookup table of gages for stationsHardnessStep1Select QueryCombines records of Hardness and Laboratory Hardness, selecting the latter if both exist for givensample.HardnessStep2Append QueryAppends records from HardnessStep1 to WATER PARAMETER-DATA with new WQ RECORD ID andnew ANALYTICAL PARAMETER ID 600SampleDatesPlusSelect QueryAdds fields to SAMPLE INFO for (1) preparing data for R time series; (2) culling data; and (3) regressingdata against timeForTSSelect QueryStarting point for R analysis of non-flow-adjusted trends. Merges WATER PARAMETER DATA withSampleDatesPlus, adding STATION CODE and STREAMNAME from STATION INFO and onlyparameters specified by SelectedParameters.KanawhaFlowStep1Select QueryCreates flows for Kanawha River as sum of flows from gages 03200500 and 03198000KanawhaFlowStep1Append QueryAppends flows from Step 1 to USGSFlow with (fake) gage ID 032010000USGSFlowWithStationsSelect QueryAppends STATION CODE to USGSFlowSampleDatesWithFlowSelect QueryAdds Flow and STATION CODE to SampleDatesPlus (only records with both flow and samples)ForRSSelect QueryStarting point for R analysis of flow-adjusted trends. Merges WATER PARAMETER DATA withSampleDatesWithFlow, adding STREAMNAME from STATION INFO and only parameters specified bySelectedParameters.W e s t V i r g i n i a A m b i e n t W a t e r Q u a l i t y T r e n d s - P a g e B- 2
Document Version: 9/19/2014 DRAFTTable B-2. Fields in SampleDatesPlus QueryFieldSAMPLE YEARDefinitionYear([SAMPLE DATE])PurposeCalendar yearSAMPLE MONTHMonth([SAMPLE DATE])Calendar monthSEASONIIf([SAMPLE MONTH] 2 And[SAMPLE MONTH] 6,2,IIf([SAMPLE MONTH] 5 And[SAMPLE MONTH] 9,3,IIf([SAMPLE MONTH] 8 And[SAMPLE MONTH] 12,4,1)))Defines Seasons: Spring(Mar,Apr, May), Summer (Jun, Jul,Aug), Fall (Sep, Oct, Nov),Winter (Dec, Jan, Feb)WQ JULIAN DAYIIf([SAMPLE MONTH] 12,[JULIAN DAY]-365,[JULIAN DAY])December Julian days arenegative values for cullingWQ SAMPLE YEARIIf([SAMPLE MONTH] 12,[SAMPLE YEAR] 1,[SAMPLE YEAR])Sample year for December setat next calendar year so dataare included in winter seasonof following yearMIDPOINT DISTANCEIIf([SEASON] 1,Abs([WQ JULIAN DAY]-14),IIf([SEASON] 2,Abs([WQ JULIAN DAY]-105),IIf([SEASON] 3,Abs([WQ JULIAN DAY]-197),Abs([WQ JULIAN DAY]-289))))Calculates difference betweensample Julian day andmidpoint of season for cullingRegression Time[Sample Date]-#12/31/1969Days since end of 1969; Usedin regressions as time variableR Processing StepsTwo kinds of processing steps in R were used in the trend analysis of WV data: (1) R commands to subsetdata or create new fields in R data frames in preparation for trend analysis; and (2) R functions whichgenerally (i) subset the data by station and parameter; (ii) apply a function which performs a statisticaloperation on the subset of the data, (iii) get return values of interest (like p-values, and slopes) from thefunction; (iv) writes, for each combination of station and parameter, the return values to a new dataframe. It was outside the scope of this project to write the statistical functions themselves to performthe trend analysis: only existing functions available in R packages were used. The functions created forthis project are not generic. They frequently take data frames as inputs but they presuppose that thedata frames have specific fields, and therefore their usefulness outside of this project is very limited.There are also functions which plot data and have roughly the same format as the functions in (2). Theyalso (i) subset data by station and parameter, but instead of steps (ii) –(iv) they (ii) define figure titlesand labels (sometimes calling statistical functions to do so), (iii) plot figures, and (iv) export figures to pdffile.Two R functions created for this project do not strictly speaking follow the pattern for (2): prepTS.R andprepRS.R. These functions build time series of observations and residuals (flow-adjusted values),respectively. They work by creating (i) a subset of each station, parameter, year, and season; (ii)selecting the observation closest to the seasonal midpoint; or (iii) assigning the season a value of NA ifno observations exist for that season, and (iv) writing the values to a new data frame. These programsW e s t V i r g i n i a A m b i e n t W a t e r Q u a l i t y T r e n d s - P a g e B- 3
Document Version: 9/19/2014 DRAFTmay be pushing the limit of data processing in R. Expect them to take several hours to run on the fullperiod of record.Table B-3 gives the “streams” of R processing steps used in the trend analysis this project, along with thegoal or purpose of the stream and the R functions called by the stream. Table B-4 gives the R functionscreated for this project, along with any built in statistical functions used in the function. Table B-5 givesthe purpose of these statistical functions and the library which is the source of the function.Scripts and Functions for OutputOutput Processing.R performs no new calculations. It (1) gathers together the results from all of thetrend analysis into a single data frame, (2) selects slopes and p-values by analysis type for eachcombination of station and parameter, and (3) exports the subsets of results by parameter to csv filesfor using in making the report tables. The csv files underwent further processing in EXCEL before beingconverted into report tables. These processing steps and functions have no use outside of this project.Running the ScriptsIf the R processing streams are sourced in the order given in Table B-3, they will produce the csv files theform the basis of the report tables from the following four csv files:1. ForTS.csv2. ForRS.csv3. StreamNames.csv4. CalcType.csvTable B-3. R Processing Streams in Trend Analysis.FileTS Processing.RPurposeLong-term and recent linear trends on datawith little or no censoringRS Processing.RLong-term and recent linear trends onresiduals from LOWESS from data with littleor no censoringStep Trend Processing.RLong-term step trends on data (andLOWESS residuals) with little or nocensoringTrends for censored data: recent lineartrends, long-term linear and step trendsCensored Processing.ROutput Processing.RConverts output in R data frames into csvfiles for report tablesFunctions CSVs.R* Processing steps, not true functionW e s t V i r g i n i a A m b i e n t W a t e r Q u a l i t y T r e n d s - P a g e B- 4
Document Version: 9/19/2014 DRAFTTable B-4: R Functions used in Trend xmakePeriodBox.RmakeCenMedians nStep.RPurposeCulls data into timeseries with singleobservation perseasonSeasonal Kendall testMann-Kendall Test onmedina-adjusted dataCalculates LOWESScurve and put residualsinto dataframeprepTS applied toresidualsprepRS with shorterrangeKruskal test for longterm step d data usingROS method tocalculate seasonalmediansMan-Kendall test forcensored dataStep trends forcensored dataStat function (if oredTable B-5: Statistical Functions Used in Trend AnalysisStatistical l Kendall testMann-Kendall testKruskal-Wallis rank-sum testWilcoxon rank-sum testROS, MLE, and Kaplan-Meier summary statisticsKendall’s Tau for censored dataRank-sum tests for censored dataKaplan-Meier empirical CDFRank-sum test for censored dataW e s t V i r g i n i a A m b i e n t W a t e r Q u a l i t y T r e n d s - P a g e B- 5
Document Version: 9/19/2014 DRAFTThe first two csv files are simply the output from the ACCESS processing steps discussed above.StreamNames.csv is a file used in plots and tables to add the stream name to a data frame. It is used as amatter of convenience only: Stream names could have been carried through all the processing steps, butwere here added on in the final steps. CalcyType.csv gives the analysis type and is used only to make thetables for the report. It was produced independently from the processing steps given here using both Rand EXCEL.Two words of warning before attempting to source the scripts: (1) the functions used in the scripts haveto be sourced before running the scripts (that is, sourcing the functions is not automatically performedby the script); and (2) the source calls and pdf calls must be checked to see if they are consistent withthe default directories used in the R installation being used.W e s t V i r g i n i a A m b i e n t W a t e r Q u a l i t y T r e n d s - P a g e B- 6
The csv files underwent further processing in EXCEL before being converted into report tables. These processing steps and functions have no use outside of this project. . kendallTrendTest EnvStats Mann-Kendall test kruskal.test stats Kruskal-Wallis rank-sum test wilcox.test stats Wilcoxon rank-sum test censtats NADA ROS, MLE, and Kaplan-Meier .