Transcription
- OLDENSTATENETDesign Process ' Analyzed extensive mapping resources to understand: existing technical and telecom assets, road andhighway systems, topological factors, socioeconomic composition by region, broadband speeds (or lackthereof) by region, among other factors. Used CPUC middle-mile recommendation routes as anchors for most route solutions adding regional rings. Engaged with a diverse set of community groups to understand needs, requirements, existing assets, andpotential opportunities. Engaged service providers (carriers, vendors, ISPs, etc) to examine potential solution sets. Integrated proposed 18 projects into the initial statewide network recommendation. Identified regions where the unserved population is 50 miles from current design to build fiber paths wherefeasible. Estimated the cost for building proposed routes in preparation for an optimization analysis.
- OLDENSTATENETDesign Factors' Primarily utilize new fiber-optic cable construction where feasible (Caltrans Right of Way). Seek joint build partnerships to reduce costs to the state and to partners. Use long-term Dark Fiber IRUs where appropriate to reduce cost, time to service, and to addresiliency. Align to organizations with existing regional, state, and federal broadband infrastructure funding tomaximize investments, e.g. CASF-funded organizations. Aim for "early wins" to meet expectations of residents, policymakers, and other stakeholders. Utilize well-established best practices in network design principles, protocols, engineering, andoperation.
- OLDENSTATENETSupport for Optimization Process' Inform CDT to enable partner-based optimization and application of available budget. This includes: Providing comprehensive information to drive decision-making for Build vs. Buy vs. Joint Build Working with CDT to determine contingency reserve percentage against 3.28 budget (typically 10-20 /o)Steps to achieving optimization: Show total routes, mileage, and projected cost of statewide Middle Mile Network that would be 100% newly-built fiber,including required equipment and facilities Determine newly-built routes that are no regrets and most feasible within available budget Determine routes for dark fiber IRUs within remaining budget In addition, determine joint-build portions of MM network within remaining budgetFinal CDT decisions for all MM network segments within 3.28 budget (minus contingency): 18 Initial Projects Joint build routes Newly built fiber routes Equipment and facilities Dark Fiber IRU routes
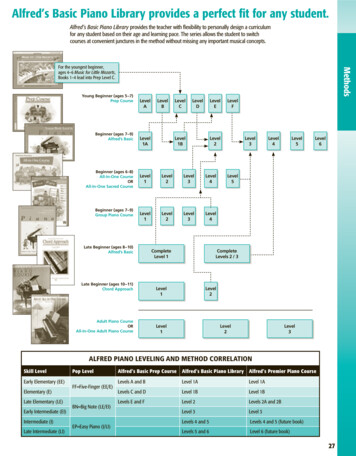
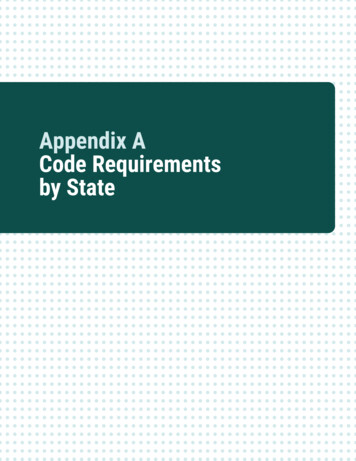
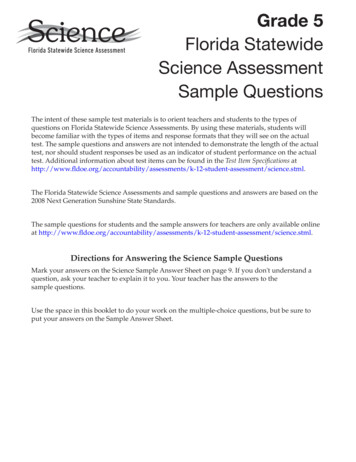
STATEWIDE MAP2-REDDINGRegion 1: Caltrans Districts 1, 2, 3Region 2: Caltrans Districts 4, 9 (portion), 103-MARSYVILLE4-0AKLANDRegion 3: Caltrans Districts 5, 6, 9 (portion)Region 4: Caltrans Districts 7, 126-FRESNO9-BISHOP-SAN LUISOBISPORegion 5: Caltrans Districts 8, 118-SAN BERNARDINO TPA Regions 1 - 5Caltrans Districts 1 - 12-IRVl}"'ETribal Nations11-SAN DIEGOPROPRIETARY& CONFIDENTIAL NOA MATERIAL: GSN-V.3--4·22-22
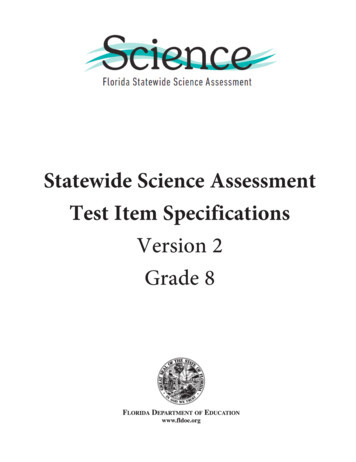
STATEWIDE MAPRegion 1: Caltrans Districts 1, 2, 3Region 2: Caltrans Districts 4, 9 (portion), 10Region 3: Caltrans Districts 5, 6, 9 (portion)Region 4: Caltrans Districts 7, 12Region 5: Caltrans Districts 8, 11/TPA Proposed Network TPA Regions 1 - 5Tribal NationsPROPRIETARY& CONFIDENTIAL NOA MATERIAL: GSN - V.3-- 4 · 22- 22
LEGEND Tribal Nations/TPA Proposed NetworkIGSN VERSION 3 4.22 .22
2-REDDING--LEGEND010 STOCKTONr,State & National Highways Tribal Nations/Caltrans DistrictsIGSN VERSION 3 4.22 .22
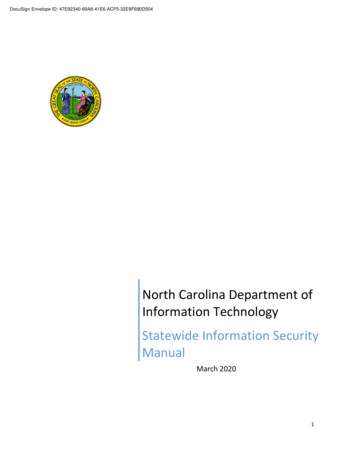
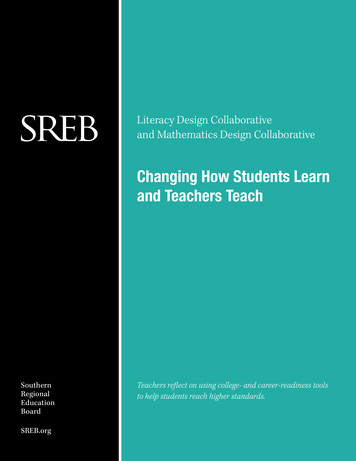
0 s.0-- - . . .'f:" -.-0 ·0 00sUnserved Residential &Unserved Non-Residential 2,000 - 5,574 1,500 - 2,000 1,000 - 1,500ee 500 - 1,000 1- 500000-2'20-1 .,Percent Households Below Poverty LineCensus tract data from U.S. Census Bureau's AmericanCommunity Survey (ACS)- 2015-2019 5-year estimatesLEGEND0r,State & National Highways Tribal NationsIGSN VERSION 3 4.22 .22
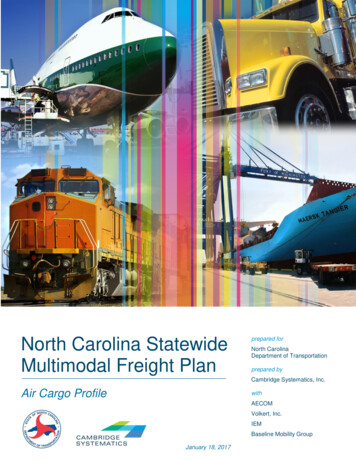
2-PLUMAS, TEHAMA3-LAKELEGEND0State & National Highways Tribal Nations/Initial 18 TPA Projects/CalREN BackboneIGSN VERSION 3 4.22 .22
LEGEND0Loe . -. ,L. 00" ,State & National Highways Tribal Nations/TPA Proposed NetworkIGSN VERSION 3 4.22 .22
Unserved Residential &Unserved Non-Residential 2,000 - 5,574 1,500 - 2,000 1,000 - 1,500ee 500 - 1,000 1- 500000-2'20-1 .,Percent Households Below Poverty LineCensus tract data from U.S. Census Bureau's AmericanCommunity Survey (ACS)- 2015-2019 5-year estimatesLEGEND0r,State & National Highways Tribal Nations/CalREN Backbone/TPA Proposed NetworkIGSN VERSION 3 4.22 .22
Unserved Residential &Unserved Non-Residential 2,000 - 5,574 1,500 - 2,000 1,000 - 1,500ee 500 - 1,000 1- 500000-2'20-1 .,Percent Households Below Poverty LineCensus tract data from U.S. Census Bureau's AmericanCommunity Survey (ACS)- 2015-2019 5-year estimatesLEGEND0r,State & National Highways Tribal Nations/CalREN Backbone/TPA Proposed Network/CPUC Anchor BuildsGSN VERSION 3 4.22 .22
LEGEND0State & National HighwaysITPA Proposed NetworkIGSN VERSION 3 4.22 .22
- OLDENSTATENETREGION 1: KEV HIGHLIGHTS' Geographic/Environmental: Vastly underserved area of the state Prone to catastrophic outages, fire hazard zonePopulation: Includes California's two largest Tribal Nations: Hoopa Valley Tribe and Yurok TribeTechnical/Business-related: First collaborative effort with a small local exchange carrier - Siskiyou Telephone Opportunity for cooperation and collaboration with Tribal Nations to build resiliency and connectivitywithin the region. Minimal availability of existing fiber to support I RUs.
LEGEND Tribal Nations/TPA Proposed NetworkGSN VERSION 3 4.22 .22
3-MARYSVILLELEGENDState & National Highways Tribal Nations/Caltrans Districts6-FRESNO.J5-SAN LUISOBISPOIGSN VERSION 3 4.22 .22
Unserved Residential &Unserved Non-Residential 2,000 - 5,574 1,500 - 2,000 1,000 - 1,500ee 000 500 -1,000 1 - 500Gil000,.,oPercent Households Below Poverty Line"Census tract data from U.S. Census Bureau's AmericanCommunity Survey (ACS) - 2015-20\9 5-year estimates0 LEGEND 0[ J ,.,,., GState & National HighwaysTribal Nations * IGSN VERSION 3 - 4 22.22
6-AMADORLEGENDState & National Highways Tribal Nations/Initial 18 TPA Projects/CalREN Backbone.JIGSN VERSION 3 4.22 .22
LEGENDState & National Highways/TPA Proposed NetworkGSN VERSION 3 4.22 .22
Unserved Residential &Unserved Non-Residential 2,000 - 5,574 1,500 - 2,000e 1,000 - 1,500 500 -1,000 1- 500,00.,020--1 Percent Households Below Poverty LineCensus tract data from U.S. Census Bureau's AmericanCommunity Survey (ACS) - 201 2019 5-yea r estimatesLEGENDGState & National HighwaysTribal Nations/CalREN Backbone/TPA Proposed Network,GSN VERSION 3 4 22 22
Unserved Residential &Unserved Non-Residential0 2,000 - 5,574 1,500 - 2,000 1,000 - 1,500ee 500 - 1,000 1- 5000000-2'20-1 .,Percent Households Below Poverty LineCensus tract data from U.S. Census Bureau's AmericanCommunity Survey (ACS)- 2015-2019 5-year estimatesLEGENDr,State & National Highways Tribal Nations/CalREN Backbone/TPA Proposed Network/CPUC Anchor BuildsGSN VERSION 3 4.22 .22
LEGENDState & National Highways/TPA Proposed NetworkGSN VERSION 3 4.22 .22
- OLDENSTATENETREGION 2: KEY HIGHLIGHTSGeographic/Environmental: Includes densely populated urban areas and sparsely populated mountainous regions. Certain areas considered high risk fire hazard zones.Population: Service affordability will be key due to socioeconomic factors in parts of the region.Technical/Business-related: Significant joint build opportunities. May require further analysis with federal partners on some routes. Varies from CPUC recommendations in a few locations. Eastern parts of the region lack Caltrans ROW and may require further evaluation.'
LEGEND Tribal Nations/TPA Proposed NetworkGSN VERSION 3 4.22 .22
10-STOCKTONFresno9-BISHOP100 Monterey6-FRESNO190175-SAN .7-LOS ANGELESr,State & National Highways Tribal Nations/Caltrans DistrictsIGSN VERSION 3 4.22 .22
,.,., IBishop0f,I0Unserved Residential &Unserved Non-Residentialr 2,000 - 5,574 1,500 - 2,0000e 1,000 - 1,500 500 -1,000 1 - 500------------------,00.,00.s ,. -Census tract data from U.S. Census Bureau's American0Community Survey (ACS) - 201 2019 5-year estimateslnyokern 0LEGENDGr . 20--1 Percent Households Below Poverty Line0 0 State & National HighwaysTribal Nations.0 0' IGSN VERSION 3 4 22 22
.,10-WEST FRESNO11-INYOLEGENDGState & National HighwaysTribal Nations,Initial 18 TPA Projects/CalREN BackboneIGSN VERSION 3 - 4 22.22
LEGENDState & National Highways/TPA Proposed NetworkGSN VERSION 3 4 22 22
,.,., I0 ,,.f0f.-,IUnserved Residential & Unserved Non-Residential0r 2,000 - 5,574 0 1,500 - 2,0000eDe. 1,000 - 1,500 500 -1,000 1- 500J1,00.,00.s20--1 Percent Households Below Poverty Line0Census tract data from U.S. Census Bureau's AmericanCommun/1.y Survey (ACS) - 201 2019 5-yea r estimatesLEGENDGState & National HighwaysTribal Nations0 /CalREN Backbone/TPA Proposed Network 0,GSN VERSION 3 4 22 22
. 'Unserved Residential &Unserved Non-Residential 2,000 - 5,574 1,500 - 2,0000e 1,000 - 1,500 500 -1,000 1- 500,00.,020--1 Percent Households Below Poverty LineCensus tract data from U.S. Census Bureau's AmericanCommunity Survey (ACS) - 201 2019 5-yea r estimatesLEGENDGState & National HighwaysTribal Nations /CalREN Backbone/TPA Proposed Network/CPUC Anchor Builds 0GSN VERSION 3 4 22 22
LEGENDState & National HighwaysITPA Proposed NetworkIGSN VERSION 3 4.22 .22
- OLDENSTATENETREGION 3: KEY HIGHLIGHTSGeographic/Environmental: Includes densely populated urban areas and sparsely populated mountainous regions. Certain areas considered high risk fire hazard zones.Population: Forthcoming opportunities for Tule River Tribal Nation with ongoing engagement. Service affordability will be key due to socioeconomic factors in parts of the region.Technical/Business-related: Significant joint build opportunities. Existing commercial infrastructure for IRU potential solutions. Eastern parts of the region lack Caltrans ROW and may require further evaluation.'
LEGEND Tribal Nations/TPA Proposed NetworkGSN VERSION 3 4.22 .22
6-FRESNO5-SAN LUISOBISPOm7-LOS ANGELESLEGENDState & National Highways12-IRVINETribal Nations/11-SAN DIE:GCaltrans DistrictsIGSN VERSION 3 4 22 22
, I. .,- ,,,,, ,I·-'f ,fj - . ., I'." !'- 0 0 .,.,,,"1 -00 ,.r,'t , f 0 - 0 - 0 0-- Unserved Residential &Unserved Non-Residential0 2,000 - 5,574 1,500 - 2,000e 1,000 - 1,500 500 -1,000 1- 500,00.,020--1 Percent Households Below Poverty LineCensus tract data from U.S. Census Bureau's AmericanCommunity Survey (ACS) - 201 2019 5-yea r estimatesLEGENDGState & National HighwaysTribal NationsIGSN VERSION 3 4 22 22
LEGENDState & National HighwaysTribal Nations/Initial 18 TPA Projects/CalREN BackboneIGSN VERSION 3 4 22 22
LEGENDState & National Highways/TPA Proposed NetworkGSN VERSION 3 4 22 22
00bf',,., ' ,;- , "' It 0,. ,,,.a s . "000 a ,,-::;.-"'./ Unserved Residential &Unserved Non-Residential 2,000 - 5,574 1,500 - 2,000 1,000 - 1,500ee 500 - 1,000 1- 500000-2'20-1 .,Percent Households Below Poverty LineCensus tract data from U.S. Census Bureau's AmericanCommunity Survey (ACS)- 2015-2019 5-year estimatesLEGENDr,State & National Highways Tribal Nations/CalREN Backbone/TPA Proposed NetworkIGSN VERSION 3 4.22 .22
Unserved Residential &Unserved Non-Residential 2,000 - 5,574 1,500 - 2,000e 1,000 - 1,500 500 -1,000 1- 500,00.,020--1 Percent Households Below Poverty LineCensus tract data from U.S. Census Bureau's AmericanCommunity Survey (ACS) - 201 2019 5-yea r estimatesLEGENDTribal Nations/CalREN Backbone/TPA Proposed Network/CPUC Anchor BuildsGSN VERSION 3 4 22 22
LEGENDState & National Highways/TPA Proposed NetworkGSN VERSION 3 4 22 22
- OLDENSTATENETREGION 4: KEV HIGHLIGHTS' Geographic/Environmental: Portions of region are densely populated urban areas. Further analysis required for Catalina Island.Population: Service affordability will be key due to socioeconomic factors in parts of the region.Technical/Business-related: Significant joint build opportunities. Multiple telecom carriers and considerable existing fiber in some areas create opportunities forIRU alternatives. Northeast area of the region lacks Caltrans ROW and may require further evaluation.
LEGENDTribal Nations/TPA Proposed NetworkGSN VERSION 3 4.22 .22
9-BISHOP.'.6-FRESNO8-SAN BERNARDINO7 LOS ANGELES12-1LEGEND11-SAN DIEGOr,State & National Highways Tribal Nations/Caltrans DistrictsIGSN VERSION 3 4.22 .22
0eM --v,. ff00Unserved Residential &Unserved Non-Residential 2,000 - 5,574 1,500 - 2,000e 1,000 - 1,500 500 -1,000 1 - 500,00.,020--1 Percent Households Below Poverty LineCensus tract data from U.S. Census Bureau's AmericanCommunity Survey (ACS) - 201 2019 5-yea r estimatesLEGENDGState & National HighwaysTribal NationsIGSN VERSION 3 4 22 22
LEGENDr,State & National Highways Tribal Nations/Initial 18 TPA Projects/CalREN BackboneIGSN VERSION 3 4.22 .22
LEGENDState & National Highways/TPA Proposed NetworkGSN VERSION 3 - 4 22.22
Unserved Residential &Unserved Non-Residential 2,000 - 5,574 1,500 - 2,000e 1,000 - 1,500 500 -1,000 1- 500,00.,020--1 Percent Households Below Poverty LineCensus tract data from U.S. Census Bureau's AmericanCommunity Survey (ACS) - 201 2019 5-yea r estimatesLEGENDGState & National HighwaysTribal Nations/CalREN Backbone/TPA Proposed Network,GSN VERSION 3 4 22 22
Unserved Residential &Unserved Non-Residential 2,000 - 5,574 1,500 - 2,000 1,000 - 1,500ee 500 - 1,000 1- 500000-2'20-1 .,Percent Households Below Poverty LineCensus tract data from U.S. Census Bureau's AmericanCommunity Survey (ACS)- 2015-2019 5-year estimatesLEGEND Tribal Nations/CalREN Backbone/TPA Proposed Network/CPUC Anchor BuildsGSN VERSION 3 4.22 .22
LEGENDState & National Highways/TPA Proposed NetworkGSN VERSION 3 - 4 22.22
- OLDENSTATENETREGION 5: KEY HIGHLIGHTS' Geographic/Environmental: Includes densely populated urban areas as well as desert regions prone to extreme heat.Population: Significant number of Tribal Nations in the region will be positively impacted by suggestedroutes. Service affordability will be key due to socioeconomic factors in parts of the region.Technical/Business-related: Significant opportunities to connect to other major Internet hubs in the West. Multiple telecom carriers and considerable existing fiber in some areas create opportunities forIRU alternatives.
TPA Proposed Network GSN VERSION 3 4 22 22 . 0 Unserved Residential & Unserved Non-Residential 0 2,000 -5,574 1,500 -2,000 1,000 -1,500 e e 500 -1,000 1-500 000-2' 20-1 ,. Percent Households Below Poverty Line Census tract data from U.S. Census Bureau's American