Transcription
Colorectal cancer screening in Canada:results of a national surveyMJ Sewitch, PhD (1); C Fournier, MSc (2); A Ciampi, PhD (3); A Dyachenko, MSc (4)AbstractCanadian guidelines recommend colorectal-cancer (CRC) screening for individuals aged50 to 74 years. The study objective was to estimate rates of CRC screening according toindividual and geographical characteristics, and of adherence to current CRC screeningguidelines. Respondents to the 2003 Canadian Community Health Survey Cycle 2.1 (aged 50 years, without past or present CRC) participated. Fecal occult blood test (FOBT)and endoscopy utilization and screening rates were calculated. The sample included16 747 residents of Newfoundland, Ontario, Saskatchewan and British Columbia. Overall,the FOBT screening rate was 7.7% in the past year, and the endoscopy screening rate was8.8% in the past 5 years. FOBT screening rates were higher in older and male respondents;endoscopy screening rates were higher in older respondents. Individuals aged 50 to 59 andover 90 years were least likely to have been screened. Approximately 70% of respondentswere non-adherent to current CRC screening guidelines. Non-adherence rates were higherin most health regions of British Columbia. National survey data suggest CRC screening inCanada is low; younger persons and residents of British Columbia were least likely toreport CRC screening.Key words:colorectal cancer, screening, survey, FOBT, endoscopyIntroductionIn Canada, colorectal cancer (CRC) is thefourth most commonly diagnosed cancerand the second and third leading causeof cancer deaths in men and women,respectively.1 CRC screening reduces bothCRC incidence through removal of premalignant polyps and CRC deaths throughearly detection and treatment. Since 1996,several organizations have published CRCscreening guidelines for average-riskindividuals, defined as those 50 years ofage and older with average risk for thedevelopment of CRC. Canadian guidelinesrecommend fecal occult blood testing(FOBT) every 1 to 2 years2-4 whereas theUS guidelines recommend annual FOBT.5,6For other screening modalities, similarperiodicities are advocated by Canada andthe US: every 10 years for colonoscopy andevery 5 years for each of flexible sigmoidoscopy and double contrast bariumenema, although the US guidelines alsorecommend a combination of annual FOBTwith flexible sigmoidoscopy every 5 years.Despite the widespread distribution of CRCscreening guidelines, CRC screening isunderutilized. In the US, several studieshave employed national survey data andcollected information through the use ofeither random-digit-dialing or in-personinterviews. Research based on data fromthe National Health Interview Survey,7the Behavioral Risk Factor SurveillanceSystem,8 the Community Quality Index,9the California Health Interview Survey10and the Health Information National TrendsSurvey11 revealed that CRC screening ratesvary from 15% to 65% depending on thetime interval under study. In Ontario,research derived from either administrative or survey data estimates that less than25% of the screen-eligible population hasbeen screened.12-14 In Alberta, a populationbased survey revealed that only 14.3% ofaverage-risk individuals were consideredup-to-date with CRC screening.15As CRC screening advances to the forefrontof preventive health care through publicand professional awareness, rates of CRCscreening in Canada are of growinginterest. However, the extent to whichCanadians are screened for CRC accordingto guidelines remains unclear. Moreover,little is known about the characteristicsof the individuals who undergo CRC screening and the use of CRC screening procedures over time. With the launching ofseveral provincial CRC screening programsin Canada, understanding CRC screeningdisparities is pivotal to fostering effectiveplanning, implementation and functioningof CRC screening endeavors. Thus, thepurpose of this population-based study wasto estimate rates of 1) FOBT and endoscopyas CRC screening procedures; and 2) adherence to current CRC screening guidelines.MethodsData sourcesThe main data source was the StatisticsCanada Canadian Community HealthSurvey (CCHS) Cycle 2.1 (January toDecember 2003),16 which aimed to provideestimates of health determinants, healthstatus and health system utilization inCanada. This survey included householdresidents aged 12 years and older in allprovinces and territories. Residents livingAuthor References1 Department of Medicine, McGill University, Montreal, QC2 Division of Clinical Epidemiology, Research Institute of the McGill University Health Centre, Montreal, QC3 Department of Epidemiology and Biostatistics, McGill University, Montreal, QC4 Department of Epidemiology and Community Studies, St. Mary’s Hospital Center, Montreal, QCCorrespondence: Maida J. Sewitch, PhD, 687 Pine Avenue West, V Building, The Royal Victoria Hospital, Montreal QC H3A 1A1, Tel.: 514-934-1934 local 44736, Fax.: 514-934-8293, Email:maida.sewitch@mcgill.caChronic Diseases in Canada9Vol 29, No 1, 2008
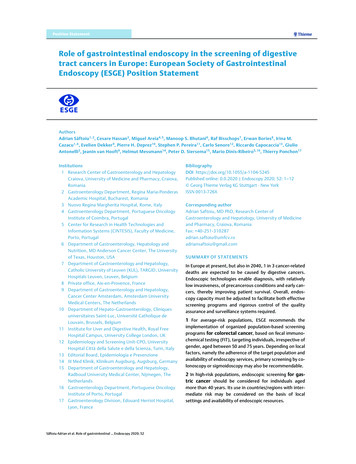
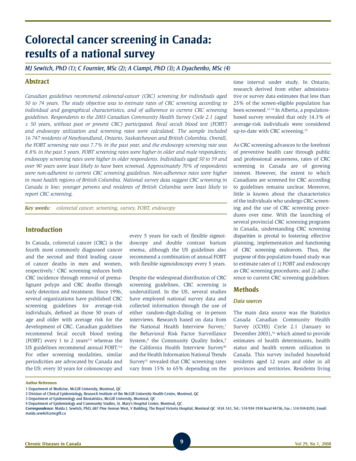
on Indian Reserves or in remote areas, andfull-time members of the Canadian ArmedForces were excluded. The CCHS Cycle 2.1survey contained basic socio-demographicinformation on all respondents in all healthregions. However, the CRC screening modulewas administered at the discretion of healthregions. Respondents to the CRC screeningmodule were from all health regions ofNewfoundland and British Columbia, andfrom 14 of 37 and 7 of 11 health regions ofOntario and Saskatchewan, respectively.17Health regions are defined by provincialhealth ministries and generally compriselegislated administrative areas representinggeographic areas of responsibility forhospital boards or regional health authorities.18 Survey data are non-nominative;respondents were not identified.Study populationThe study population included surveyrespondents who completed the CRC screening module and reported being 50 years ofage and older and without past or presentCRC. Respondents failing to provide information on when both FOBT and endoscopywere last performed were excluded. Sociodemographic characteristics included age,sex, highest level of education achievedand household income. Clinical characteristics included bowel disease (havingreceived a diagnosis of either Crohn’sdisease or ulcerative colitis from a healthcare professional). Geographical characteristics included residential area (urbanvs. rural), health region and province ofresidence.Outcome variablesFOBT and endoscopy (defined as sigmoidoscopy or colonoscopy) screeningand utilization rates were based onquestionnaire responses that assessedwhen the procedure was last performedand the indication for the procedure(screening, non-screening). Screening rateswere derived from screening procedures,which were defined as those performedfor “regular check-up”, “age”, “race”, or“family history of CRC”. The degree of anaffected family member was not assessed.Utilization rates were derived fromscreening and non-screening procedures,which were defined as those performed for“follow-up of previous problem” or “otherVol 29, No 1, 2008reason”. FOBT can be used in a nonscreening context, for example, to detectthe presence of blood in the stool of apatient with anemia. Three adherence rateswere defined according to CRC screeningguideline-recommended periodicities inplace at the time of the study. (1) Adherenceto FOBT screening guidelines was defined ashaving an FOBT in the past 2 years; (2)Adherence to endoscopy screening guidelines was defined as having an endoscopyin the past 10 years; (3) Adherence tocurrent CRC screening guidelines wasdefined as either (1) or (2). The threeadherence rates, which were based onprocedures performed for all indications,provide an estimate of the number of respondents considered up-to-date with CRC screening. The underlying assumption is thatonce the procedure is performed, repeattesting for screening purposes should followguideline-recommended periodicities.Statistical analysisDescriptive statistics were used to characterize the study population overall andaccording to screening modality. Screeningrates were calculated as the number ofrespondents reporting a screening procedure, divided by the number of respondentsreporting a screening procedure plus thosereporting never undergoing the procedure,according to the timing of the last screeningprocedure. Respondents who underwentthe procedure for non-screening purposeswere excluded. Utilization rates werecalculated as the number of respondentsreporting either a screening or nonscreening procedure divided by the totalnumber of respondents in the studypopulation, according to the timing of thelast procedure. FOBT rates were calculatedaccording to the following 5 time intervals:less than 1 year ago, 1 to 2 years ago, 2 to3 years ago, more than 3 years ago andnever. Endoscopy rates were calculatedaccording to the following 4 time intervals:within the last 5 years, 6 to 10 years ago,more than 10 years ago and never. Thesetime intervals differ from the guidelinerecommended periodicities to allow forcomparisons over time. Overall screeningand utilization rates were computed for theentire study population. Screening rateswere also computed by sex, age group,household income level, education level,10bowel disease status and geographicalareas (residential area, health region andprovince of residence).Rates were computed by aggregatingweighted data over the participating healthregions. Rates may not be representative ofthe entire province when only some healthregions are sampled. Thus, only regionalscreening rates were reported for Ontarioand Saskatchewan. By comparison, regionaland provincial screening rates were reportedfor Newfoundland and British Columbia,where all health regions were sampled.Rates for the 3 adherence outcomes werecalculated overall and according to healthregions. Although rates of adherence tocurrent CRC screening guidelines werebased on FOBT and endoscopy utilization,respondents having valid information ononly one procedure were included andclassified accordingly. Bootstrap weightsprovided by Statistics Canada wereemployed to compute a 95% confidenceinterval (95% CI) using the BOOTVARE V30program (Version 3.0).19 All analyses wereperformed using SAS statistical software.20The sizes of both the Canadian populationat survey time and the study population(i.e. number of Canadians represented bythe respondents) were estimated using theweighted design previously mentioned. Allfigures presented are weighted values, inkeeping with the policies of Statistics Canada.ResultsStudy populationThe CRC screening module was administered to 39 178 individuals (Figure 1). Ofthese, 16 747 respondents met eligibilitycriteria and were estimated to represent2 394 124 Canadians (according to weightingprocedures). The size of the Canadianpopulation aged 12 and over was estimatedat 26 578 128. Of the eligible respondents,16 545 and 16 648 provided informationon utilization of FOBT and endoscopy,respectively; 14 482 and 13 949 providedinformation on FOBT and endoscopyscreening, respectively.Chronic Diseases in Canada
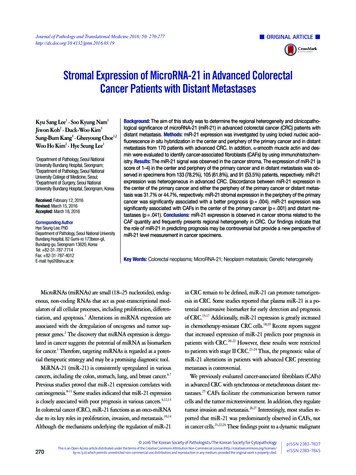
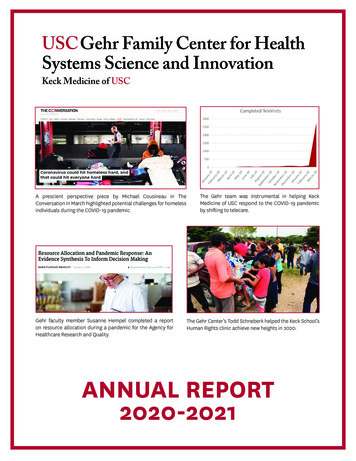
Table 1 presents the socio-demographic,clinical and geographical characteristicsof the study population overall and according to screening modality. Overall, more ofthe respondents were female, aged 50 to64, post high-school graduates, born inCanada, white, not employed, without boweldisease, living in urban areas and fromBritish Columbia. Of the 14 482 respondentswith FOBT screening information, 21.6%underwent FOBT screening in theirlifetimes. Compared to the total studypopulation, a greater percentage of thosereporting FOBT screening were aged 50 to64 and were not employed outside thehome. Of the 13 949 respondents withendoscopy screening information, 11.3%underwent endoscopy screening in theirlifetimes. Compared to the total studypopulation, a greater percentage of thosereporting endoscopy screening were notemployed outside the home and wereresidents of Ontario; a smaller percentagewere residents of British Columbia.FOBT screening ratesTable 2 presents FOBT screening ratesby time interval, according to sociodemographic, clinical and geographicalcharacteristics. Overall FOBT screeningrates were 7.7% in the past year, 5.1% 1 to2 years ago, 2.5% 2 to 3 years ago, and6.3% over 3 years ago; 78.4% never had ascreening FOBT. FOBT screening rates inthe past year and 1 to 2 years ago werehigher in males, those with bowel diseaseand those aged 65 years and older; rateswere lowest among the 50 to 59 year agegroup. No rural vs. urban difference wasobserved. Provincial FOBT screening rateswere higher in residents of British Columbiacompared to Newfoundland. Health regionalFOBT screening varied within each province(Table 3). Across the 43 health regions ofall provinces, FOBT screening rates in thepast year ranged from 2.4% to 21.5% andrates of never undergoing FOBT screeningranged from 54.3% to 89.2%. In comparison, overall FOBT utilization rates were:9.1% in the past year, 6.0% 1 to 2 yearsago, 11.8% over 3 years ago; 69.3% neverhad an FOBT (data not shown).Chronic Diseases in CanadaEndoscopy screening ratesTable 4 presents endoscopy screening ratesby time interval, according to sociodemographic, clinical and geographicalcharacteristics. Overall endoscopy screeningrates were 8.8% in the past 5 years and1.5% in the past 6 to 10 years; 88.7% neverhad a screening endoscopy. Endoscopyscreening rates in the past 5 years werehigher in respondents with bowel diseaseand those aged 65 years and older; rateswere lowest among the 50 to 59 year and90 to 100 year age groups. No rural vs.urban difference was observed. Provincialendoscopy screening rates were higher inresidents of Newfoundland compared toBritish Columbia. Health regional endoscopyscreening rates varied within each province(Table 3). Across the 43 health regions (i.e.all provinces), endoscopy screening ratesin the past 5 years ranged from 4.2% to16.5%, and rates of never undergoingendoscopy screening ranged from 81.1%to 94.3%. In comparison, overall endoscopyutilization rates were 16.7% in the past5 years and 3.9% in the past 6 to 10 years;75.6% never had an endoscopy (datanot shown).Adherence to FOBT screening guidelinesTable 5 shows that 15.1% of respondentswere adherent to FOBT screening guidelines.Figure 2 shows that rates of adherence toFOBT screening guidelines were highest inthe southern health regions of BritishColumbia and some health regions ofSaskatchewan and Ontario. Rates of neveruse of FOBT across all health regions (Figure3) were highest in eastern health regions ofBritish Columbia, the Saskatoon region, northeastern Ontario and parts of Newfoundland.FIGURE 1Study population selection from the CCHS Cycle 2.1 CRC screening module respondentsCRC screening module administrationn 39 178 respondents(7 175 026 Canadians)Aged 50 yearsn 17 696 respondents(2 558 525 Canadians)No past/present CRCn 17 498 respondents(2 529 577 Canadians)Complete information onFOBT or endoscopyn 16 747 respondents(2 394 124 Canadians)FOBT utilizationn 16 545 respondents(2 362 140 Canadians)Endoscopy utilizationn 16 648 respondents(2 380 175 Canadians)11FOBT screeningn 14 482 respondents(2 089 024 Canadians)Endoscopy screeningn 13 949 respondents(2 029 620 Canadians)Vol 29, No 1, 2008
TABLE 1Socio-demographic, clinical and geographical characteristics of the study population according to FOBT and endoscopy screening statusCharacteristicCategoryFOBT screeningaOverallEndoscopyb screeningn (2 394 124)%cn (451 669)%cn (229 578)%cmale1 140 56647.6233 37251.7112 54149.0female1 253 55952.4218 29848.3117 03751.050 to 641 429 67959.7222 47349.3122 45053.365 964 44640.3229 19750.7107 12846.7 high school630 64727.0110 67625.156 24925.0high school grad.462 20119.889 30620.342 53318.9Socio-demographicSexAgeEducationpost high schoolCountry of birthCultural/racial originHousehold incomeEmployment status(over past year)143 1396.123 7085.417 7937.9post high school grad.1 095 95347.0216 55449.2108 54448.2Canada1 653 45270.3315 68570.9171 33775.5other697 28029.7129 55429.155 54324.5white2 067 99288.0405 03791.1205 34490.8other281 34212.039 6308.920 7489.2low to low medium656 70433.2116 92531.164 07433.7upper medium685 01834.7132 54335.264 00333.6high635 22932.1126 74233.762 15232.7full-time864 38237.0126 25428.668 19330.2part-time211 8099.139 9379.021 6009.61 258 63453.9275 74762.4135 67360.2no jobClinicalBowel diseaseyes86 0803.616 6643.710 6994.7no2 305 48896.4434 42896.3218 77095.3urbanGeographicalResidential areaResidential province1 895 46279.2355 94478.8183 46579.9rural498 66320.895 72521.246 11420.1Newfoundland &Labrador155 1666.519 8594.415 6736.8Ontario889 60837.2171 56638.0111 76248.7SaskatchewanBritish Columbia168 2797.031 6037.015 5086.81 181 07249.3228 64150.686 63637.7All numbers are weightedNumbers may not be equal to the population n due to missing dataaRespondents reporting lifetime FOBT screeningbRespondents reporting lifetime endoscopy screeningcBased on valid responses (excludes missing values)Vol 29, No 1, 200812Chronic Diseases in Canada
TABLE 2FOBT screening rates by time interval according to socio-demographic, clinical and geographical characteristics (na 14 482)CharacteristicLast reported FOBT screening 1 yearRateOVERALL1 to 2 years95% CIRate2 to 3 years95% CIRate3 years95% CIRatenever95% CIRate95% 8.680.950 to 65 0 to 60 to 470 to 2.880 to 4.190 to 7.881.1SexAge (years)Residential areaEducation high schoolhigh school 0.6post high 884.4post high .177.580.8Household incomelow to low mediumupper 82.00.83.16.14.67.785.483.287.5British .879.9Bowel diseaseResidential provincecRate percentages represent weighted dataaNumber of respondents providing information on FOBT screening and representing 2 089 024 CanadiansbRespondents categorized according to the last reported date of screening FOBTFOBT performed for non-screening purposes are excludedcOntario and Saskatchewan provincial rates are not reported because data are not available for all health regionsn/a not available because non-weighted data cells contained less than 5 individuals (Statistics Canada privacy protection regulation)Chronic Diseases in Canada13Vol 29, No 1, 2008
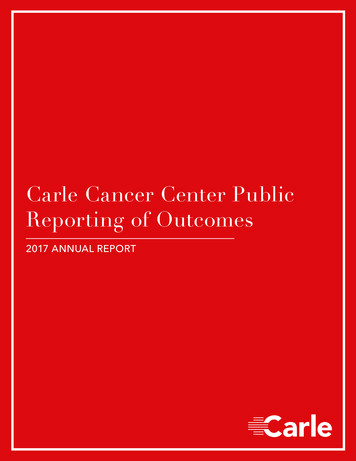
TABLE 3Summary of health regional screening rates of FOBT and endoscopy by provinceProvinceHealth regionsn (%)FOBTrangebEndoscopyrangebpast yearneverpast 5 yearsnever432.4 to 21.554.3 to 89.24.2 to 16.581.1 to 94.36 (100%)2.8 to 5.483.6 to 89.14.8 to 12.084.6 to 94.314 (37.8%)3.9 to 13.162.5 to 85.38.2 to 16.581.1 to 88.4Saskachewan7 (63.6%)3.8 to 21.554.3 to 85.57.5 to 10.882.6 to 90.8British Columbia16 (100%)2.4 to 15.156.5 to 89.24.2 to 13.483.4 to 93.8aOverallNewfoundland& LabradorOntarioaAll health regions/provinces combinedbRange values are percentagesAdherence to endoscopyscreening guidelinesA total of 20.6% of respondents wereadherent to endoscopy screening guidelines(Table 5). Figure 4 shows that healthregional rates of adherence to endoscopyscreening guidelines were highest insoutheastern British Columbia, southernAlberta, northern Ontario and parts ofNewfoundland. Rates of never-use ofendoscopy (Figure 5) were highest in BritishColumbia and parts of Newfoundland. Noclear geographical pattern emerged forSaskatchewan, as less than half of provincialhealth regions were sampled.Adherence to current CRCscreening guidelinesIn this study population, 30.1% ofrespondents were adherent and 69.9%were non-adherent to current CRC screeningguidelines (Table 5). Figure 6 shows thatnon-adherence rates were highest in mosthealth regions of British Columbia andlowest in many health regions of Ontario.Non-adherence rates for Newfoundlandand Saskatchewan varied by health region.DiscussionThe overarching goal of this Canadianpopulation-based study was to increase ourknowledge of the extent to which CanadiansVol 29, No 1, 200850 years of age and older undergo CRCscreening. Our results indicate that rates ofCRC screening by FOBT and endoscopywere low and subject to considerablegeographic variation. Provincial screeningrates (Newfoundland and British Columbia)revealed that up to 85.4% and 91.4% ofresidents had never been screened withFOBT and endoscopy, respectively. Healthregional screening rates (Saskatchewan andOntario) were also low, with up to 85.5%and 90.8% of the population having neverbeen screened with FOBT and endoscopy,respectively. The large geographical variation echoes findings from one Albertabased study21 and several US studies thatshow large regional and state level differences in CRC test use.22,23 Geographicalvariation in use of health preventive servicesis evident for other types of screening inCanada. Health regional rates of thePapanicolaou (Pap) test in Ontario reportedlyvary from 12% to 74%,24 while acrossCanada provincial rates vary between 70%to 88%.25 Similarly, survey data indicate thatCanadian provincial breast cancer screening rates vary from approximately 9% inNunavut to 67% in New Brunswick.25CRC screening rates varied by age as well.People 65 years of age and older werescreened more often by both FOBT andendoscopy compared to their younger14counterparts, similar to the findings ofothers.26-34 Individuals aged 50 to 59 wereless likely to report CRC screening,suggesting a delayed uptake of CRC screening recommendations by either or bothphysicians and younger patients, since atthe time of the survey no CRC screeningprograms were in place. Furthermore, FOBTand endoscopy screening declined in the 80to 89 year age group and, for endoscopy,dropped off dramatically in the 90 to 100year age group. These findings may reflectthe cost-effective model proposed for theCanadian population, which recommendsto stop screening at age 74.3,35No meaningful differences were found inCRC screening rates according to urban vs.rural residence, suggesting that variation inscreening was not due to availability ofhealth care resources. One might haveexpected that rural areas would have beendisadvantaged in terms of accessibility tosigmoidoscopy and colonoscopy and, consequently, more likely to have employed FOBT,which is readily available. Our findingcorroborates that reported by anotherCanadian similar study that found CRCprocedure rates in rural and urban areas.21One possible explanation for the lack ofvariability between residential areas mayrest in regional similarities in physician practice style. Since both FOBT and endoscopyare considered primary screening modalities,physicians who adhere to endoscopy screening may recommend endoscopy regardless ofwhether facilities are located outside of thepatient’s residential area.Rates of FOBT increased moderately between1 to 2 years ago and the past year, whilerates of endoscopy increased almost 6-foldin the past decade. Not only do these trendsindicate a steady rise in CRC screening,they may also depict a shift from FOBT toendoscopy for primary CRC screening.21,34,36-39These findings should alert decision- andpolicy-makers of an impending increaseddemand for screening endoscopy, sinceat the present time there are insufficientresources to meet that demand.35Chronic Diseases in Canada
TABLE 4Endoscopy screening rates by time interval according to socio-demographic, clinical and geographical characteristics (na 13 949)Last reported endoscopy screeningbCharacteristic0 to 5 yearsOVERALL6 to 10 yearsRate95% CIRate10 years95% CIneverRate95% CIRate95% 1.71.32.10.90.71.288.787.789.7SexAge (years)50 to .02.01.62.51.61.22.086.585.387.650 to 597.36.48.31.00.71.40.50.30.891.190.192.260 to 6910.49.211.61.81.22.41.00.61.486.985.688.270 to 7910.38.811.82.11.62.71.70.92.486.084.387.780 to 899.76.612.81.60.72.52.11.33.086.683.489.890 to 00.61.489.388.190.6high school grad.8.46.810.01.30.71.91.00.51.489.387.691.1post high 8.210.41.41.01.80.90.71.288.487.289.565 Residential areaEducation high schoolpost high school grad.Household incomelow to low r 21.71.00.81.289.088.389.7Newfoundland& itish el diseaseResidential provincecPercentages represent weighted dataaNumber of respondents providing information on endoscopy screening and representing 2 029 620 CanadiansRates are based on valid responses (excludes missing values)bRespondents categorized according to the last reported date of screening endoscopy (sigmoidoscopy or colonoscopy)Endoscopies performed for non-screening purposes are excludedcOntario and Saskatchewan provincial rates are not reported because data are not available for all health regionsn/a not available because non-weighted data cells contained less than 5 individuals (Statistics Canada privacy protection regulation)Chronic Diseases in Canada15Vol 29, No 1, 2008
TABLE 5Frequency of the three adherence outcomesOutcomen%aAdherence to FOBT screening guidelinesbyes356 53515.1no2 005 60584.9yes490 12820.6no1 890 04779.4cAdherence to endoscopy screening guidelinesAdherence to current CRC screening guidelinesdyes720 89930.1noe1 673 22569.9All numbers are weightedIncludes procedures for all indicationsaBased on valid responses (excludes missing values)bReported use in the past 2 years for 16 545 respondents (1.3% missing values)cReported use in the past 10 years for 16 648 respondents (0.6% missing values)dReported use of FOBT in the past 2 years or endoscopy in the past 10 years for 16 747 respondentseIncludes 1.3% of respondents classified according to only one procedureFIGURE 2.Health regional rates of adherence to FOBT screening guidelines**Utilization of FOBT in the past 2 yearsVol 29, No 1, 200816Chronic Diseases in Canada
FIGURE 3Health regional rates of never-use of FOBTFIGURE 4Health regional rates of adherence to endoscopy screening guidelines**Utilization of sigmoidoscopy or colonoscopy in the past 10 yearsChronic Diseases in Canada17Vol 29, No 1, 2008
FIGURE 5Health regional rates of never-use of endoscopyFIGURE 6Health regional rates of non-adherence to current colorectal-cancer screening guidelines**Non-use of FOBT in the past 2 years and endoscopy in the past 10 yearsVol 29, No 1, 200818Chronic Diseases in Canada
In Canada in 2003, 78.4% and 88.7% ofrespondents had never been screened byeither FOBT or endoscopy, respectively.These findings mirror those of USpopulation-based studies that found thatup to 65% of individuals had never receivedeither of these exams7,11,36 and of oneCanadian study that reported that up to77% had never been screened for CRC.14Likewise, in a 6-year follow-up study ofOntario beneficiaries, nearly 80% of CRCscreen-eligible individuals aged 50 to59 years did not receive any large bowelevaluation.12 Not only do our findings pointto the gross underuse of CRC screening,they also convey the message that CRCscreening rates are considerably lowerthan those for either breast or cervicalcancer.8,37,40 In 2003, the proportion ofscreen-eligible women who underwentguideline-recommended screening was79% for Pap test and 61% for mammography,the latter increasing from 53% in 2001.25The rise in breast-cancer screening ratesmay be explained by the increasing numberof enrollees in provincially organizedbreast-cancer screening programs, whichhave been adopted by all Canadianprovinces.41 Multimodal endeavors thatproved effective for improving breastcancer screening rates may be effectiveat boosting rates of CRC screening.Undoubtedly, providing CRC screeningwithin the context of an organized programmay prove to be advantageous by promotingawareness of CRC screening, especially inthe younger age group, and monitoringguideline-recommended CRC screening inaverage-risk Canadians.Several limitations and strengths areimportant to consider when interpretingour findings. Endoscopy screening ratesmay have been overestimated if respondentswith bowel disease indicated a screeningprocedure: since inflammatory boweldisease is a risk factor for the developmentof CRC, affected individuals are advised toundergo surveillance colonoscopy at morefrequent time intervals compared to thoseconsidered at average-risk. However, thiswould not have meaningfully affected therates of screening because less than 1% ofthe study population would have beenmisclassified (3.6% of respondents withChronic Diseases in Canada
4 Department of Epidemiology and Community Studies, St. Mary's Hospital Center, Montreal, QC Correspondence: Maida J. Sewitch, PhD, 687 Pine Avenue West, V Building, The Royal Victoria Hospital, Montreal QC H3A 1A1, Tel.: 514-934-1934 local 44736, Fax.: 514-934-8293, Email: maida.sewitch@mcgill.ca Colorectal cancer screening in Canada: