Transcription
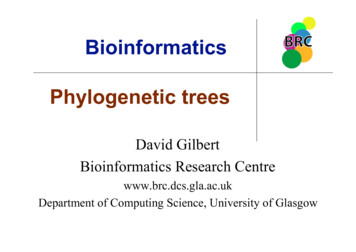
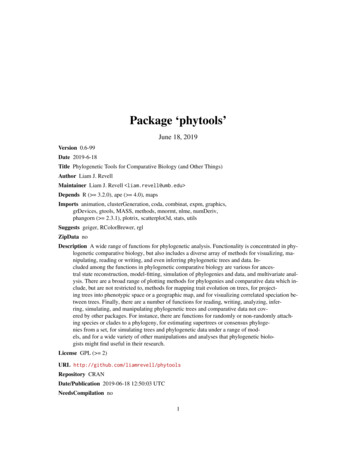
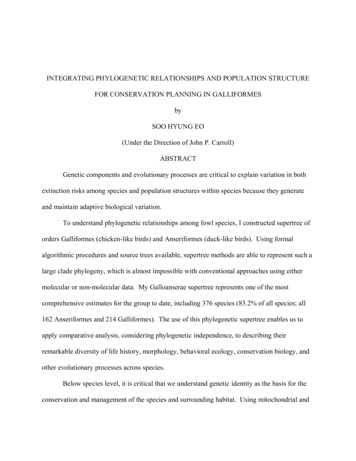
OPEN ACCESSInt. Res. J. of Science & Engineering, 2016; Vol. 4 (3-4): 65-75ISSN: 2322-0015RESEARCH ARTICLEA Study of Phylogenetic Relationships and Homology ofCytochrome C using BioinformaticsKulkarni Keya and Sundarrajan Priya*St. Xavier’s College (Autonomous), Mumbai*Corresponding author Email : priya.s@xaviers.eduManuscript DetailsReceived : 17.02.2016Revised : 22.03.2016Accepted: 26.07.2016Published: 18.09.2016ISSN: 2322-0015Editor: Dr. Arvind ChavhanCite this article as:Kulkarni Keya and SundarrajanPriya. A Study of PhylogeneticRelationships and Homology ofCytochrome C using Bioinformatics. Int. Res. Journal of Science& Engineering, 2016,4 (3-4):6575.Copyright: Author(s), This isan open access article under theterms of the Creative CommonsAttribution Non-Commercial NoDerivs License, which permits useand distribution in any medium,provided the original work isproperly cited, the use is noncommercial and no modificationsor adaptations are made.ABSTRACTCytochrome C is an essential and ubiquitous protein. It is highlyconserved across the spectrum of species and hence is used to studycladistics. In this paper, analysis of cytochrome C using bioinformaticstools has been carried out, in order to find the evolutionary relationshipbetween species. The amino acid sequences of cytochrome C were usedto establish the phylogenetic relationships of species. The phylogenyinferred from the sequence alignment of cytochrome C was confirmedby comparing its structure and function. The protein was found to befunctionally redundant. From the analysis cytochrome C, it appears thattwo different organisms which have the same or even similar proteinsequences are genealogically related. The homologous similarities ofcytochrome C are suggestive of common ancestry.Keywords: Cytochrome C, phylogenetic relationships, homology,molecular clock.INTRODUCTIONThe Cytochrome complex (cyt c) is a small hemeprotein looselyassociated with the inner mitochondrial membrane. It belongs to thecytochrome C family of proteins and is found in all organisms. Cyt c is ahighly soluble protein, unlike other cytochromes. In humans, cyt c isencoded by the CYCS gene [UniProtKB - P99999]. Cyt c is an essentialand ubiquitous protein. It has a crucial role in the electron transportchain as well as in apoptosis as shown in Figure 1).Cyt c is highly conserved across a wide spectrum of species. Thisimplies that it has changed little in millions of years of evolution. This,along with its small size (molecular weight of 12,000 Daltons), makes ituseful in studying cladistics [UniProtKB - P99999].The cyt c molecule has been studied for the glimpse it gives intoevolutionary biology. The idea of a "molecular clock" is attributed toEmile Zuckerkandl and Linus Pauling who noticed that the number ofamino acid differences in hemoglobin and cyt c between differentlineages changes linearly with time, as estimated from fossil evidence. 2016 All right reserved65
Kulkarni and Sundarrajan, 2016Figure 1: Role of Cytochrome C in the electron transport chain (Lodish et al, 2000)They suggested that the rate of evolutionary change ofany specified protein was approximately constant overtime and over different lineages [Zuckerkandl andPauling, 1962]. Knowledge of the rate of molecularevolution in certain sets of lineages also facilitatesestablishing the dates of phylogenetic events, includingthose not documented by fossils, such as the divergenceof living taxa and formation of the phylogenetic tree.[Wilson et al, 1977].Phylogeny consists of the evolutionary relationshipsbetween any set of species. Phylogeny is determinedusing a ubiquitous protein or gene. This is done toensure that the comparisons are independent of theoverall species phenotype. For example, both humansand chimpanzees have many similar anatomicalcharacters and functions, so we might expect theirproteins to be similar, regardless of whether they aregenealogically related or not. However, we can comparethe sequences of basic genes that are used by all livingorganisms, such as the cyt c gene, which have noinfluence over specific chimpanzee or humancharacteristics.In this paper, cyt c of different species is compared inorder to determine an evolutionary relationshipbetween them. Cyt c is an ancient molecule, and it hasevolved very slowly. Only one-third of its amino acidsare unchanged. This conservatism is a great help inworking out the evolutionary relationships between66distantly-related creatures. [Kumar S, 2005] Cyt c is aprotein involved in using energy in the cell. It is foundin most species. Over time, random mutations in theDNA sequence occur. As a result, its amino acidsequence also changes. Cells without usable cyt c areunlikely to survive. [Margoliash E, 1963]. Hence, therelationship between organisms can be compared byexamining the amino acid sequence of cyt c.A protein can be assessed comprehensively bycomparing its structure, function and sequence. Thesimilarities or differences in these three criteria areinter-linked. Hence, the analysis involves comparingthe above factors and thereby determining thephylogeny of certain species. Homologs are proteinsthat share a common ancestry. They are coded for bygenes that have been derived from a shared ancestry. Asubdivision of homologous proteins is called Paralogs.They are genes related through gene duplication.Another subdivision of homologs are Orthologs.Orthologs are essentially the “same” proteins indifferent species, synthesized due to passing of “same”gene from a common ancestor when new speciesdiverge from their shared ancestor. [Wilson et al, 1977]More closely related organisms will have more similarcyt c because they have more recent common ancestor.The more recent the common ancestor, the less time forDNA mutations to occur. Changes in DNA lead tochanges in mRNA leads to differences in protein aminoacid sequences.www.irjse.in
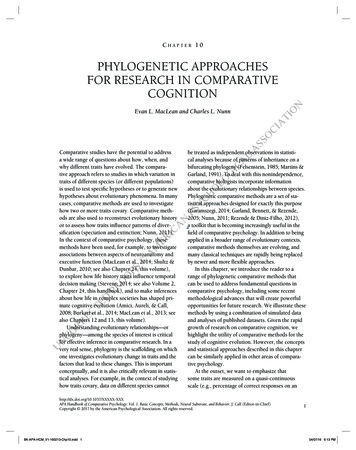
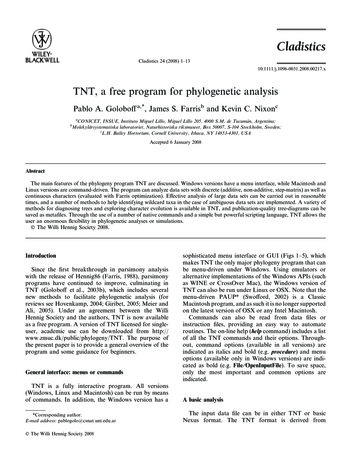
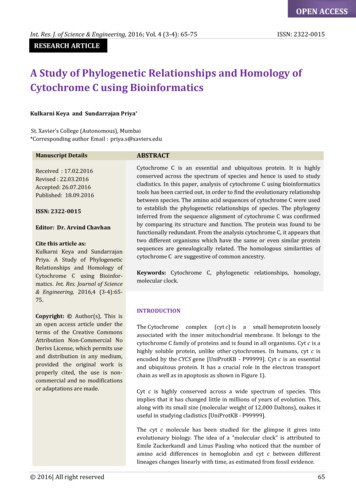
Phylogenetic Relationships and Homology of Cytochrome C using BioinformaticsMATERIAL AND METHODSDatabases used:1. Primary nucleotide sequence databases: EMBL(European Molecular Biology Laboratory) [StoesserG et al, 2002; embl.org], GenBank (maintained by theNational Centre for Biotechnology Information)[Benson DA et al, 2005; ncbi.nlm.nih.gov/genbank],and DDBJ (DNA Data Bank of Japan) [Tateno Y et al,2002; ddbj.nig.ac.jp] have been used.2. Protein sequence databases: SWISS-PROT [Bairochand Apweiler, 2000; ebi.ac.uk/swissprot]and itscomputer-annotated supplement, TrEMBL, as wellas the Protein Information Resource (PIR) [Wu CHet al, 2003; pir.georgetown.edu] have been used.3. Sequence motif databases: Pfam [Punta M et al,2012; pfam.xfam.org] and PROSITE [Hulo N et al,2006; prosite.expasy.org] are databases of proteinfamilies and domains that have been used.4. Macromolecular 3-D structure databases: ProteinData Bank (PDB) [Parasuraman S, 2012; rcsb.org]is the primary database for 3D structures that hasbeenusedalongwith SCOP(StructuralClassification of Proteins) which classifies protein3D structures in a hierarchical scheme of structuralclasses.Tools used:1. Single sequence alignment: BLAST (Basic LocalAlignment Search Tool) [Altschul, S.F. et al, 1990;blast.ncbi.nlm.nih.gov] and FASTA [Lipman, DJ et al,1985; ebi.ac.uk/Tools/sss/fasta]. Each has its ownalgorithm for comparing sequences and measuringsimilarity. BLAST results are in the form of bitscores and E-values. The bit score gives anindication of how good the alignment is; the Evalue is a parameter that describes the number ofhits one can “expect” to see by chance whensearching a database of a particular size. uence alignment] is atool that gives the percent identity of a match.LALIGN also shows the actual alignment of the W[Thompson et al, 1994; clustal.org] is a multiplesequence global alignment tool. Boxshade[ch.embnet.org/software/BOX form.html] is a toolused to display conserved domains.Homology determining tools: CLUSTALW DIST[Thompson et al, 1994; clustal.org] quantifies theevolutionary distance between sequence pairs,infers a phylogenetic tree from an alignment, andcalculates the evolutionary distances betweenspecies based on the differences between thealigned sequences. ConSurf-DB [consurfdb.tau.ac.il]provides evolutionary conservation profiles forproteins of known structure in the PDB. Theevolutionary conservation of each amino acidposition in the alignment is calculated.4.Structure viewing tool: Sirius has been used tovisualise a protein or nucleic acid structure in threedimensions [sirius.sdsc.edu].All tools used are from the Next Generation BiologyWorkbench. [Subramaniam S, 1998]RESULTS1. Structural ComparisonDomains are distinct functional and/or structural unitsof a protein. Domains are often identified as recurring(sequence or structure) units. In molecular evolutionsuch domains may have been utilized as buildingblocks, and may have been recombined in differentarrangements to modulate protein function. Conserveddomains are defined as recurring units in molecularevolution, the extents of which can be determined bysequence and structure analysis. Conserved domainscontain conserved sequence patterns or motifs, whichallow for their detection in polypeptide sequences. Thecomparative analysis of the structures of relatedproteins can reveal the effects of the amino acidsequence changes that have occurred during evolution.Previous work on individual protein families has shownthat mutations, insertions and deletions producechanges in three-dimensional structure.Database: PDBTool: SiriusStructural Analysis:Database: PDBTool: ConSurf-DBInput: The PDB id of cytochrome C (3cyt) was enteredas a query in ConSurf-DB. This tool analyses thestructure of the query protein in all the species in PDB.Output: The result is the structure of cytochrome C withvariable and conserved regions clearly marked.Multiple cytochrome C sequences are lined up againsthuman cytochrome C to determine which residues areconserved across all species. These conserved residuesare then located on the human cytochrome C structure.Int. Res. J. of Science & Engineering, 2016; Volume 4, No. 3-4, May-August, 2016.67
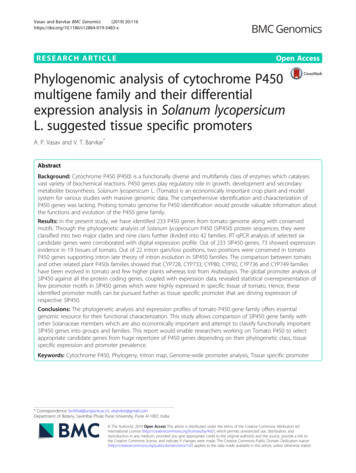
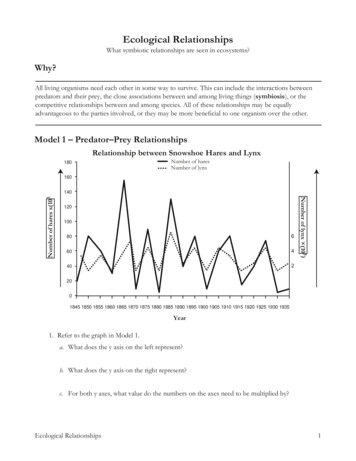
Kulkarni and Sundarrajan, 2016Fig. 2: Human cyt C protein motif; Human cyt C with each amino acid in a different colour12Key: Variable3456Average789ConservedFig. 3: Structure of cytochrome C showing variable and conserved regions2.COMPARING FUNCTIONThe function of a protein changes if the temperature ofhighest efficiency for the protein is shifted one way orthe other, or if it has enzymatic function, that a changein the activation energy needed for a reaction changes,or other such changes occur in how well or under whatconditions the protein works best. Changes in functiontend to be either selected for or selected against in eachspecies, so one can expect that such changes eitherspread to become commonplace or are eliminated fromthe population of that species. Genes and their encodedproteins that perform the same metabolic functions indifferent organisms are similar but in most cases notidentical with respect to their DNA and proteinsequences. For example, the cyt c protein that performsthe same electron transport function in horse and cowmitochondria is very similar, but not identical.68Database: SwissProtTool: SiteFiNDER 3DInput: The Accession number of cytochrome C wasentered. Homologs of cytochrome C in SwissProt werealigned and analysed by the tool. Sequence identity tothe query ranged from 22% to 91% with an average of58% and standard deviation of 17.6%.The results show that the regions involved in thefunctioning of the protein are highly conserved whilethe relatively unimportant sites are variable. Thus, theevolutionary profile obtained makes sense in view ofthe protein function: Highly conserved residuesdelineate the Heme binding site. This is in correlationwith the results of previous studies [Fitch WM,Margoliash E, 1967].www.irjse.in
Phylogenetic Relationships and Homology of Cytochrome C using BioinformaticsOutput:Figure 4: Functional amino acids of Cytochrome C are conserved across species3.SEQUENCE SIMILARITYDNA is the primary means of passing inheritedinformation from generation to generation. Becauseproteins are constructed from the information in DNA,they also are reliable indicators of inheritedinformation. The amino acid sequences of proteins areoften used to establish the phylogenetic relationships ofspecies. The variance of cytochrome C of differentorganisms is measured in the number of differingamino acids, each differing amino acid being a result ofa base pair substitution, a mutation. If each differingamino acid is assumed to be the result of one base pairsubstitution, it can be calculated how long ago the twospecies diverged by multiplying the number of basepair substitutions by the estimated time it takes for asubstituted base pair of the cytochrome C gene to besuccessfully passed on.I. SINGLE SEQUENCE ALIGNMENTDatabase: SWISSPROT.Tool: BLASTPInput: Here, only one query value was filled – with theaccession number of human cytochrome C. Hence, theamino acid sequence of human cytochrome C iscompared with the amino acid sequences ofcytochrome C of all the organisms on the database.Output: The query resulted in 181 hits, implying thatthere are 181 organisms in this database withcytochrome C protein. Here is the result of a select few:Database: SWISSPROT.In this result, the bit score of rabbit cytochrome C is thehighest (after human cytochrome C itself) while thelowest bit score belongs to euglena. This implies thathuman cytochrome C matches the best with rabbitcytochrome C, while human and euglena cytochrome Care the most different. Here, the lowest E-value is thatof zebrafish while the highest E-value belongs tohoneybee. Hence, the bit score of zebrafish cytochromeC is statistically the most significant while the bit scoreof honeybee cytochrome C has a high probability ofoccurring by chance.Table 1: Sequences producing significant alignmentsACCESSION NUMBERCOMMON NAMEBIT SCOREE- na1003e-21Int. Res. J. of Science & Engineering, 2016; Volume 4, No. 3-4, May-August, 2016.69
Kulkarni and Sundarrajan, 2016II. PAIRWISE SEQUENCE ALIGNMENTTable 2: Pairwise alignments of some 9.2-51.556.656.658.658.656.655.651.5--In pairwise alignments of cyt c sequences oforganisms with varied bit scores in the singlesequence alignment, some had a high bit score(chimpanzee), while others had a low bit score(euglena).Database: NBRFTool: BLASTInput: To compare only two sequences, bothquery boxes must be filled with the accessionnumbers of the sequences. Hence, the amino acidsequence of the first query was aligned with thatof the second query only.Identities are the number and fraction ofidentical residues in the sequence. The moreidentities there are between two molecules, themore recently they have evolved from a commonancestral molecule and thus the closer thekinship of their owners. Thus the cytochrome cof the chimpanzee is identical to that of humansexcept for one amino acid, whereas yeastcytochrome c differs from that of humans at 44positions. In this case, 92% of the amino acids(leucine and isoleucine)of human and mousecytochrome C are similar.Cladogram 1: Similarity of Cytochrome Csequence relative to humans70The cladogram drawn from cytochrome C analysis matchesthe taxonomical data. It was noted that the chimpanzee andhuman sequences taken from SWISSPROT are 97% identical,while the same sequences are 100% identical when thedatabase is NBRF. This discrepancy is due to the difference inthe algorithms of the databases. The distance of a branchindicates the number of changes that have taken place alongthe branch.III. MULTIPLE SEQUENCE ALIGNMENTIn multiple sequence alignment, all similar sequences canbe compared in one single figure or table. The basic idea isthat the sequences are aligned on top of each other in acommon coordinate system. Cytochrome C sequences ofhuman, chimpanzee, dog and horse were compared.Data from: UniProtKBSearch by: FASTATool used for aligning sequences: CLUSTALWInput: The sequences of the organisms were saved in FASTAformat. Entries that said “partial sequences” in theirdescription were avoided. No sequence was selected twice.CLUSTALW tool was selected to run the task.Output:Sequence 1: Canis familiaris 105 aaSequence 2: Equus burchelli 105 aaSequence 3: Pan troglodytes 105 aaSequence 4: Homo sapiens105 aaStart of Pairwise alignmentsSequences (1:2) Aligned. Score: 95Sequences (1:3) Aligned. Score: 89Sequences (1:4) Aligned. Score: 89Sequences (2:3) Aligned. Score: 89Sequences (2:4) Aligned. Score: 89[P00011 CYC CANLF][P00004 CYC HORSE][P99998 CYC PANTR][P99999 CYC HUMAN]Sequences (3:4) Aligned. Score: 100www.irjse.in
Phylogenetic Relationships and Homology of Cytochrome C using BioinformaticsChecking for conserved domainsTool used: BoxshadPan troglodytes MGDVEK GKKI F I MKCS QC HT V EKGGKHKT GPNL HGLF GRKT GQA PGYSYTA ANKNKGII WHomo sapiensMGDVEK GKKI F I MKCS QC HT V EKGGKHKT GPNL HGLF GRKT GQA PGYSYTA ANKNKGII WCanis familiarisMGDVEK GKKI F VQ KCAQC HT V EKGGKHKT GPNL HGLF GRKT GQA PGF SYTDANKNKGITWEquus burchelli MGDVEK GKKI F VQ KCAQC HT V EKGGKHKT GPNL HGLF GRKT GQA PGF SYTDANKNKGITWPan troglodytes G E DTL ME Y L ENP K KYI P GT KMI F VGI K KKE ER AD L I AY L KKAT NEHomo sapiensG E DTL ME Y L ENP K KYI P GT KMI F VGI K KKE ER AD L I AY L KKAT NECanis familiarisG E E TL ME Y L ENP K KYI P GT KMI F AGI K KT GER AD L I AY L KKAT K EEquus burchelli K E E TL ME Y L ENP K KYI P GT KMI F AGI K KKT ER E D L I AY L KKAT NEThe portions of the sequence that are conservedbetween all species are highlighted in black. Aminoacids that are similar, but not identical are shown witha grey background. Those that have a differentcharacter are shown with a white background. Most ofthe sequence of cytochrome C is conserved across thesefour species. There are also many amino acids whichare identical, if not similar. The non-conserved regionsare mostly found in the dog and horse cytochrome Csequences. Hence, human and chimpanzee have themaximum conserved domains.Determining the distance between sequence pairsTool used: CLUSTALW DISTOutput:Cladogram 2: Distance between sequence pairsBlack and white dashed lines indicate that thesequences are identical. [Eernisse DJ, 1998] Hence, dogand horse are more closely related to each other than tohumans or chimpanzees. Meanwhile, chimpanzees andhumans share their cytochrome C sequence, and arevery closely related. This implies that the cytochrome Csequence of an organism is similar to another speciesbelonging to the same order.IV. CLADOGRAM OF CYTOCHROME C SEQUENCES OFSOME SPECIESMultiple sequence alignments were done betweendifferent species across the three kingdoms – Plantae,Fungi and Animalia.Database: UniProtTool: CLUSTALW DISTInput: The amino acid sequences from Uniprot weresaved in FASTA format and aligned using CLUSTALW.The alignment data was used to run the task usingCLUSTALW DIST tool.Output: CLUSTALW DIST program producedphylogenetic tree inferred from this data.aThe black and white dotted line implies 100% identity.Hence, the cytochrome C residues are completelyconserved in human and chimpanzee. Comparingcytochrome C among the different species revealed thatonly 27 amino acid residues are identical. More than 60residues differ among them (this number is not exactbecause there are slight differences in the length of themolecule in some species). However, the degree ofsimilarity among amino acid sequences in cytochromeC corresponds closely to the phylogenetic relationships.[8] That is, mammalian sequences are more similar toeach other than to any reptilian sequence and viceversa.Int. Res. J. of Science & Engineering, 2016; Volume 4, No. 3-4, May-August, 2016.71
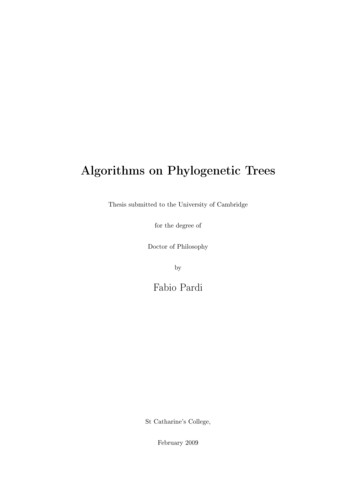
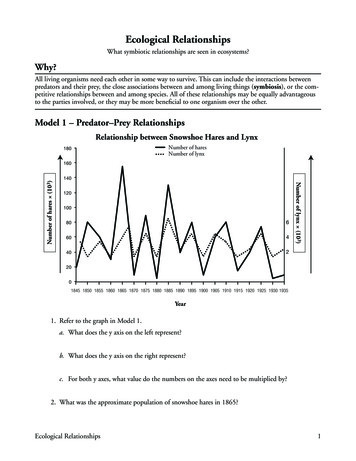
Kulkarni and Sundarrajan, 2016Cladogram 3: Phylogenetic tree of species based ontheir Cytochrome C sequencesCladogram 4: Average minimal mutation distancebased on Cytochrome C sequencesCladogram 5: Comparison between members of Cytochrome C familyV. DISTANCE MATRIXA distance matrix is a table that shows all the pairwisecomparisons between species.Database: UniProtKBTool: LALIGN (FASTA)Input: Selection of organisms was based on their bitscores in the single sequence alignment. Someorganisms selected had a high bit score (example,chimpanzee), while others had a low bit score(example, yeast). This was done to get a highlybranched cladogram, with as many clades as possible.Output:Overall, it was found that the cytochrome C sequencesof most species compared had little no change in theirbiochemical properties. There are also quite a lot ofamino acids having similar properties and charge,indicating that the change in amino acid is conservative.A pairwise score is calculated for every pair ofsequences that are to be aligned. Pairwise scores arecalculated as the number of identities in the bestalignment divided by the number of residues compared72(gap positions are excluded). Pairwise scores areinitially calculated as percent identity scores and areconverted to distances by dividing by 100 andsubtracting from 1.0 to give number of differences persite. Hence, the cladogram is constructed by thealgorithm.The cladogram below is constructed using the pairwisealignments of table 3.The tree corresponds quite well to the evolutionaryrelationships among the species. But there are someanomalies. It indicates, for example, that the bat is moreclosely related to birds than mammals. This is certainlywrong [Tsagkogeorga, 2013]. But sequence analysis ofother proteins can resolve such discrepancies.VI. COMPARISON OF CYTOCHROME C FAMILYCytochromes c are electron-transfer proteins havingone or several heme C groups, bound to the protein bythioether bonds involving sulphydryl groups ofcysteine residues. The fifth heme iron ligand is alwayswww.irjse.in
Phylogenetic Relationships and Homology of Cytochrome C using BioinformaticsTable 3: Approximate percent identity in the overlap of 105 amino acids for different kPigeonChickenBatTurtleTunaFruit 78481878993929288Tuna696871737785847473747673Fruit ndida34353432313333323434303331353539Int. Res. J. of Science & Engineering, 2016; Volume 4, No. 3-4, May-August, 2016.7359
Kulkarni and Sundarrajan, 2016provided by a histidine residue. Cytochromes c possessa wide range of properties and function in a largenumber of different redox processes. This family hasfour classes - I to IV. Class I includes the low-spinsoluble cyt c of mitochondria and bacteria, with thehaem-attachment site towards the N-terminus, and thesixth ligand provided by a methionine residue about 40residues further on towards the C-terminus. On thebasis of sequence similarity, class I cyt c were furthersubdivided into five classes, IA to IE. [Margoliash E,1963]Database: PfamTool: CLUSTAL W and CLUSTAL DISTInput: Members of the cytochrome C family werecompared in order to assess their relationship.The Cladogram 5 shows that Cytochrome C and c1 havemaximum number of same residues; Cytochrome b andb245 have nearly the same amino acid sequence.Hence, Cytochrome C and c1 belong to the same classwhile Cytochrome b and b245 belong to the same class.CONCLUSIONCytochrome C is a protein that is evolutionaryconserved across a wide spectrum of species. We havetaken advantage of this property of the molecule toestablish homology and phylogenetic relationshipsbetween species. In this paper, a cluster of homologswas identified, a multiple sequence alignment was doneand a phylogenetic tree was constructed. The aminoacid sequences of cytochrome C were used to establishthe phylogenetic relationships of species.As cytochrome C is ubiquitous, it ensures that thecomparisons are independent of the overall speciesphenotype. [Brown TA, 2002] The phylogeny inferredfrom the sequence alignment of cytochrome C wasconfirmed by comparing its structure and function. Theprotein was found to be functionally redundant i.e.,many dissimilar cytochrome C sequences form thesame general structure and perform the same generalbiological role. However, functional redundancy neednot be exact in terms of performance; some functionalcytochrome C sequences may be slightly better atelectron transport than others. Hence, from the analysiscytochrome C, it appears that two different organismswhich have the same or even similar protein sequencesare genealogically related.From the phylogenetic trees, it can be predicted thathuman and chimpanzee cytochrome C sequences74should be much more similar than, say, human andyeast cytochrome C - simply due to inheritance. Thehomologous similarities of cytochrome C are especiallysuggestive of common ancestry. The high degree offunctional redundancy of the cytochrome C moleculeand the fact that the phylogenies derived from themgenerally match other phylogenies very well indicatethat cytochrome C is molecular evidence of evolution.These results match those of Fitch and Margoliash[Fitch WM, Margoliash E, 1967]. The results also are inaccordance with the theory of common descent,proposed by Charles Darwin, which says that a group oforganisms have common descent if they have acommon ancestor [Darwin C, 1859].Cytochrome C is a protein that is evolutionaryconserved across a wide spectrum of species. We havetaken advantage of this property of the molecule toestablish homology and phylogenetic relationshipsbetween species. In this paper, a cluster of homologswas identified, a multiple sequence alignment was doneand a phylogenetic tree was constructed. The aminoacid sequences of cytochrome C were used to establishthe phylogenetic relationships of species.As cytochrome C is ubiquitous, it ensures that thecomparisons are independent of the overall speciesphenotype. [Brown TA, 2002] The phylogeny inferredfrom the sequence alignment of cytochrome C wasconfirmed by comparing its structure and function. Theprotein was found to be functionally redundant i.e.,many dissimilar cytochrome C sequences form thesame general structure and perform the same generalbiological role. However, functional redundancy neednot be exact in terms of performance; some functionalcytochrome C sequences may be slightly better atelectron transport than others. Hence, from the analysiscytochrome C, it appears that two different organismswhich have the same or even similar protein sequencesare genealogically related.From the phylogenetic trees, it can be predicted thathuman and chimpanzee cytochrome C sequencesshould be much more similar than, say, human andyeast cytochrome C - simply due to inheritance. Thehomologous similarities of cytochrome C are especiallysuggestive of common ancestry. The high degree offunctional redundancy of the cytochrome C moleculeand the fact that the phylogenies derived from themgenerally match other phylogenies very well indicatethat cytochrome C is molecular evidence of evolution.These results match those of Fitch and Margoliash[Fitch WM, Margoliash E, 1967]. The results also are inaccordance with the theory of common descent,proposed by Charles Darwin, which says that a group ofwww.irjse.in
Phylogenetic Relationships and Homology of Cytochrome C using Bioinformaticsorganisms have common descent if they have acommon ancestor [Darwin C, 3.14.15.Altschul, S.F., Gish, W., Miller, W., Myers, E.W. &Lipman, D.J. "Basic local alignment se arch tool." J.Mol. Biol., 1990; 215:403-410.Bairoch A, Apweiler R. The SWISS-PROT proteinsequence database and its supplement TrEMBL in2000. Nucleic Acids Research, 2000; 28(1):45-48.Benson DA, Karsch-Mizrachi I, Lipman DJ, Ostell J,Wheeler DL. GenBank. Nucleic Acids 3/nar/gki063.Brown TA. Genomes. 2nd edition. Oxford: WileyLiss; 2002. Chapter 16, Molecular h.gov/books/NBK21122/Darwin C The Origin of Species by Means of NaturalSelection, or the Preservation of Favoured Races inthe Struggle for Life. Penguin Books, London, 1859Eernisse DJ. A brief guide to phylogenetic software.Trends Genet., 1998;14:473–475Felsenstein J. Phylogenies from molecularsequences: inference and reliability. Ann. Rev.Genet. 1988; 22:521–565Fitch WM, Margoliash E. Construction ofphylogenetic trees. A method based on mutationdistances as estimated from cytochrome csequences is of general applicability. Science,1967;155:279–284.Hulo N, Bairoch A, Bulliard V, et al. The PROSITEdatabase. Nucleic Acids Research, kj063.Kumar S Molecular clocks: four decades ofevolution Nature Reviews Genetics, 2005; 6, 654662Lipman, DJ; Pearson, WR. "Rapid and sensitiveprotein similarity searches". Science, 1985; 227(4693): 1435–41Lodish H, Berk A, Zipursky SL, et al. Molecular CellBiology. 4th edition. New York: W. H. Freeman;2000. Section 16.2, Electron Transport andOxidative Phosphorylation. Available rgoliash E "Primary structure and evolution ofcytochrome c". Proceedings of the NationalAcademy of Sciences of the United States ofAmerica, 1963; 50 (4): 672–9.Parasuraman S. Protein data bank. Journal ofPharmacology & Pharmacotherapeutics, 20
2012; pfam.xfam.org] and PROSITE [Hulo N et al, 2006; prosite.expasy.org] are databases of protein families and domains that have been used. 4. Macromolecular 3-D structure databases: Protein Data Bank (PDB) [Parasuraman S, 2012; rcsb.org] is the primary database for 3D structures that has been used along with SCOP (Structural