Transcription
RI-SV-07UNIVERSITY OF CALIFORNIA COOPERATIVE EXTENSION2007SAMPLE COSTS TO PRODUCERICESACRAMENTO VALLEYRice Only RotationPrepared by:Randall MuttersChristopher GreerKaren M. KlonskyPete LivingstonUC Cooperative Extension Farm Advisor, Butte CountyUC Cooperative Extension Farm Advisor, Sutter, Yuba, Placer, & SacramentoCountiesUC Cooperative Extension Economist, Department of Agricultural andResource Economics, UC DavisUC Cooperative Extension Staff Research Associate, Department ofAgricultural and Resource Economics, UC Davis
INTRODUCTIONThe sample costs to produce rice in the Sacramento Valley are presented in this study. The study isintended as a guide only, and can be used in making production decisions, determining potential returns,preparing budgets and evaluating production loans. The practices described are based on productionprocedures considered typical for this crop and area but will not apply to every situation. Sample costsfor labor, materials, equipment, and custom services are based on current figures. A “Your Costs” columnin Tables 1 and 2 is provided for you to enter your costs.The hypothetical farm operation, production practices, overhead, and calculations are described under theassumptions. For additional information or explanation of calculations used in the study call theDepartment of Agricultural and Resource Economics, University of California, Davis, California, 530752-2414 or the Sutter/Yuba Counties, 530-822-7515, and Butte County, 530-538-7201, UC CooperativeExtension offices.STUDY CONTENTSINTRODUCTION . . .ASSUMPTIONS .Cultural Practices and Material Inputs . . . .Cash Overhead . . . . Non-Cash Overhead . . REFERENCES . . .Table 1.Table 2.Table 3.Table 4.Table 5.Table 6.Table 7.Table 8.COSTS PER ACRE TO PRODUCE RICE . . . .COSTS AND RETURNS PER ACRE TO PRODUCE RICE . . .MONTHLY CASH COSTS TO PRODUCE RICE . . . . . .WHOLE FARM EQUIPMENT, INVESTMENT, AND BUSINESS OVERHEAD COSTS . HOURLY EQUIPMENT COSTS . RANGING ANALYSIS . . . .COSTS AND RETURNS/BREAKEVEN ANALYSIS . . . . . .DETAILS BY OPERATION . . .23378101113151617181920Sample Cost of Production studies for many commodities are available and can be requested through theDepartment of Agricultural and Resource Economics, UC Davis, 530-752-1517. Current and somearchived studies can be obtained from selected county UC Cooperative Extension offices or downloadedfrom the department website http://coststudies.ucdavis.edu.The University of California does not discriminate in any of its policies, procedures or practices.The university is an affirmative action/equal opportunity employer.2007 Rice Cost and Return Study (Rice Rotation Only)Sacramento ValleyUC Cooperative Extension2
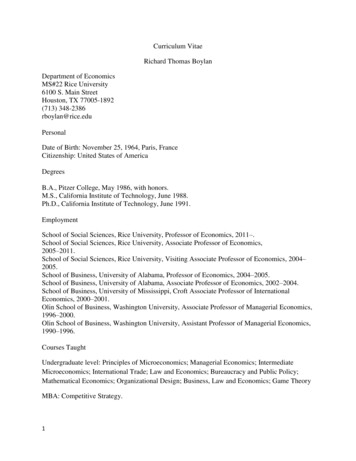
ASSUMPTIONSThe following assumptions pertain to sample costs to produce rice in the Sacramento Valley. Practicesdescribed should not be considered recommendations by the University of California, but representproduction procedures considered typical for this crop and area. Some of the costs and practices may notbe applicable to your situation or used during every production year. Other practices not indicated may beneeded. Cultural practices and costs to produce rice will vary by grower and region, and can besignificant. The practices and inputs used in this cost study serve as a sample or guide, only. The costsare presented on an annual, per acre basis. The use of trade names in this report does not constitutean endorsement or recommendation by the University of California nor is any criticism implied byomission of other similar products.Farm. This report is based on a hypothetical 630 acre farm. The grower owns 151 acres and rents 479acres. Rice is grown on 600 acres and 30 acres (7 owned acres and 23 rented acres) are roads, irrigationsystems, farmstead, and unused or unusable land. Typically, a grower with this amount of rice acreagewill have several non-adjacent fields and the cultural practices will vary among fields. Additionally, extracosts may be involved for moving equipment between fields, but are not included in this study. No othercrops are grown in rotation with the rice. Both the grower-owned and rented lands have a rice base andare eligible for farm program benefits. All operations are done on 100% of the farmed acres unless noted.Owned rice land normally ranges from 5,000 to 7,000 per acre. This study uses a value of 6,000 peracre. However, the majority of rice growers do not own much of the ground that they farm.Environmentally important rice land is valued in excess of the amount that growers can profitably affordto pay because environmental associations or governmental agencies may be willing to pay more toacquire the land. In this study only 24% of the land is owned by the grower.Rented land in this region range between 200 to 250 per are with surface water attached to the land, butthe water is not paid for by the landowner. The cost of the water is borne by the grower renting the land.A price of 225 per acre is used in this study.CULTURAL PRACTICES AND MATERIAL INPUTSLand Preparation. Most of the primary tillage which includes chiseling, discing, land leveling, laserleveling, and rolling is normally done from March through May. In this study, the permanent levees, 5%of the acres, are reworked and drains are maintained as necessary. The Endangered Species Act mayaffect the way the drains are maintained and additional costs may be incurred. All fields are chiseled twotimes to open the ground and dry the soil. This is followed by two discings to break up large clods and toincrease the soil’s drying surface. The field is then leveled and smoothed with a triplane. Laser levelingis done once every seventh year and in this study 1/7 of the cost is charged to the cultural operations eachyear. The ground is rolled using a fertilizer applicator with a corrugated roller to help incorporatefertilizer prior to flooding and planting.Fertilization. Aqua ammonia is applied preplant at 130 pounds of N per acre with an aqua fertilizerinjector 3 to 4 inches deep. At the same time, a “starter” fertilizer, ammonium phosphate (16-20-0) at 200pounds and potassium (in the form of potash) at 50 pounds of material per acre, are applied by air andincorporated with the aqua rig or roller. Zinc sulfate is applied by air to 50% of the acres. In July 75% ofthe acres are topdressed with ammonium sulfate at 23.63 pounds of N or 150 pounds of material per acre.Adding soil amendments such as calcium and sulfur should only be done if a soil test indicates a need.2007 Rice Cost and Return Study (Rice Rotation Only)Sacramento ValleyUC Cooperative Extension3
Planting. Water seeding in contrast to drill-seeding or dry-seeding is the primary seeding method inCalifornia. The soil is flooded, the seed is soaked in chlorinated water and drained, and the seed isbroadcast by air into flooded fields. Most planting is done from April 20 to May 20, but sometimescontinues into June.Irrigation. The grower purchases the majority of the irrigation water from an irrigation district and alsouses well water. The grower pays the water costs on both the rented and grower owned land. Theseasonal cost of irrigation water for this study is 80.00 per surface acre. This does not include waterneeded for rice straw management.Pest Management. The pesticides and rates mentioned in this cost study are listed in UC IntegratedPest Management Guidelines, Rice. For more information on pest identification, monitoring, andmanagement visit the UC IPM website at www.ipm.ucdavis.edu. Written recommendations are requiredfor many pesticides, and are made by licensed pest control advisers. For information on pesticide usepermits, contact the local county agricultural commissioner’s office.Several sprays are applied for developing costs in this study.Weeds. Broadleaf and grass weeds are controlled with separate aerial and ground applications. A grassherbicide is applied on 100% of the acres by air in May. An application is made in June to control theremaining broadleaf, sedges, and grass weeds using a mixture of two herbicides applied by ground to100% of the acres. The herbicides used are propanil (Super Wham or Stam) and Grandstand. Final weedcontrol is a cleanup herbicide application in June that is applied by air on 50% of the acreage.Insects. Rice water weevil control begins in May after planting, by treating 15% of the acres, whichincludes the field borders or edges, levees, and field area adjacent to these areas with Warrior insecticide.Armyworms are controlled with one insecticide application of Warrior in July on 10% of the acres.Algae and Shrimp: In May, after planting, copper sulfate is applied to 60% of the acres to control shrimpand algae.Diseases. Blast and aggregate sheath spot are controlled July through August with one application ofQuadris on 30% of the acres.Harvest. The rice crop is harvested at 22% kernel moisture (green rice) using one combine with a cutterbar header. The grower also owns a self-propelled bankout wagon. The grain is dumped from thecombine into the bankout wagon that hauls the grain to bulk grain trailers for transport to the dryer.Growers may either choose to own harvesting equipment, purchased either new or used, or hire a customharvester. Many factors are important in deciding which harvesting option a grower uses. Theseconsiderations and appropriate method of analysis are discussed in "Acquiring Alfalfa Hay HarvestEquipment: A Financial Analysis of Alternatives".Transportation. The grower pays the cost of transporting green rice from the field to the drier. Haulinggrain from the drier to storage may be considered a processing or marketing expense, but is a cost and isreflected in the price returned to the grower. In this study, the cost of transporting the rice from the fieldto the drier is included, but the hauling cost between the drier and warehouse is not. The cost oftransporting rice is based on a green weight of 95.34 hundredweight (cwt) per acre and a 0.41 per cwtfield pickup and hauling charge. In this study, green weight is the calculated weight of the harvested riceat 22% moisture, including ‘invisible shrink’ (see below).2007 Rice Cost and Return Study (Rice Rotation Only)Sacramento ValleyUC Cooperative Extension4
Drying and Storage. Drying charges increase with moisture content and most dryers use a rate schedulethat reflects the loss of moisture plus other ‘invisible’ losses in the system associated with immaturekernels, dockage and dust. The non-moisture factor varies among dryers, but ranges from about 2% to6%. Together, these losses are called ‘shrink’. Rice is assumed to be dried to 14% moisture. The dryingrate charge is multiplied by the green weight calculated above. The current cost of drying the rice in thisstudy is 0.80 per cwt. Storage is charged at 0.57 per cwt on the dry weight and is similarly increased toestimate future power costs. Most of the drying cost is related to natural gas prices, and the storage costto electricity prices.Yields. The crop yield used in this study is 8,000 pounds (80 cwt) per acre at 14% moisture. Yields havevaried over the years in the Sacramento Valley and are shown in Table A.Table A. Average Sacramento Valley rice yields by ----------------------------------------------- cwt/acre terTehamaYoloYubaWeighted 0073.89Source: County Crop Reports, 2002-2006.Returns. A selling price of 12.00 per cwt of medium grain rice is used to estimate market income. Thisstudy includes additional revenue received by rice growers from the Direct Payment (DP) but not theCounter Cyclical Payment (CCP) or the Marketing Loan Program (MLP) of the Farm Security and RuralInvestment Act of 2002 administered by the United States Department of Agriculture’s (USDA), FarmService Agency (FSA). Marketing loan gains and Counter-Cyclical Payments rise when market pricefalls to roughly offset the losses from lower market prices so total revenue is less vulnerable to declines inmarket price than without these programs. Limits apply on the DP, CCP, and MLP paid to each activelyengaged individual associated with the farm. Here we assume that these limits are binding on the farm.For this cost study we assume a two-entity farm growing rice to the approved limits. Individual farms’program income will vary depending on each farm’s acreage base and other factors. For moreinformation on these aspects and other programs or on meeting minimum requirements to comply rogramProvisions.htm. The government’s crop programsexpire in 2007.Direct Payments. The total farm DP income is calculated by taking 85% of the payment yield multipliedby the payment rate and the individual farm’s base acreage. In this study the Direct Payment yield isassumed to be 68.20 cwt per acre and the Direct Payment rate is 2.35 per cwt. Per acre program supportis calculated as 0.85 X 2.35/cwt 1.997/cwt. In practice, approximately 87% of the rice grownreceives full payment; therefore, in this study the calculated payment is multiplied by 87% to reflect theless than 100% payment. The formula (0.85 X 2.35 X 0.87) calculates the 1.738 return shown in Table2.More information on Direct Payments is available at the USDA /DirectPayments.htm. Farms are not required to grow rice2007 Rice Cost and Return Study (Rice Rotation Only)Sacramento ValleyUC Cooperative Extension5
to receive the Direct Payments, but almost all rice farms do collect this revenue and most Direct Paymentsgo to farms that continue to grow rice.Counter-Cyclical Payments. Counter-Cyclical Payments are only made to growers when the marketprice or national average loan rate is less than the target price. The payment rate is equal to the targetprice minus the Direct Payment rate minus the higher of the commodity price or loan rate. The targetprice for rice through 2007 is 10.50 per cwt. The Direct Payment rate is 2.35 and the loan rate is 6.07for California. In this study the price for the CCP is 10.50 – 2.35 – 6.50 1.65. The CCP rate is setat a maximum of 1.65 per cwt, but can be set lower depending on several factors. For this study the 10.50 target price is lower than the 12.00 per cwt price paid by mills so the CCP is not included in thereturns. The USDA internet site rCyclicalPay.htmdelves into the detail of the target price, payment rate, payment limits, timelines, and calculations.Counter-Cyclical Payments are normally made in several annual installments in order to assess the marketprice for the year. Farms are not required to grow rice to receive the CCP, but almost all rice farms doreceive this revenue and most Counter-Cyclical Payments go to farms that continue to grow rice.Marketing Loan Gains and Loan Deficiency Payments. Rice farmers are eligible to receive a loanfrom the government by putting up their production as collateral. The loan rate for rice in 2007 is 6.07per hundredweight. When market prices fall below the loan rate, farmers can repay the loans at a lowerloan repayment rate resulting in a benefit to producers. The loan repayment rate for rice is the averageworld price for rice calculated weekly by the government. The difference between the loan rate and theaverage world price is called a Marketing Loan Gain. Alternatively, eligible farmers can choose toreceive direct loan deficiency payments equivalent to the Marketing Loan Gain without having to take outthe loan and then repay it. In this study we assume that the world price is above the loan rate and somarketing loan gains are not an additional source of revenue.Assessments. Under a state marketing order a mandatory assessment fee is collected and administered bythe California Rice Research Board (CRRB). This assessment of 0.06 per dry cwt pays for rice researchfunded by the CRRB. In addition, the California Rice Commission (CRC) assesses each rice grower 0.0425 per dry cwt for its operations. Rice millers and marketers also contribute an equal amount( 0.0425 per cwt). This provides the CRC with a total budget based on 0.085 per cwt for all Californiarice produced to work on a host of issues facing the California rice industry.Straw Management. Post-harvest operations for straw management are usually done using a single orcombination of five methods. The most commonly used operations are 1) burning (up to 25% of acreswith disease), 2) chopped, disced, and flooded, 3) chopped and flooded, 4) flooded and rolled and 5)chopped and disced. In this study a combination of methods 1, 4, and 5 are used.Rice straw burning is done on 13% of the acres in the fall and/or spring for disease control. Burningpermits and fees vary for each air pollution control district. For this study, 2.75 per acre is charged foreach acre burned. A new grower may also pay a one time 20 burn fee. Check with the air pollutioncontrol office in your county for burning regulations and fees. On 60% of the acres the paddy is floodedand the rice straw is rolled with a cage roller. Winter water costs for single and continuous flooding varyby district or may be rain fed. The remaining 27% of the rice fields’ residues are managed by choppingand discing.Risk. Risks associated with rice production are not assigned a production cost. While this study makesan effort to model a production system based on typical, real world practices, it cannot fully represent2007 Rice Cost and Return Study (Rice Rotation Only)Sacramento ValleyUC Cooperative Extension6
financial, agronomic and market risks which affect the profitability and economic viability of riceproduction.Labor. Labor rates of 17.76 per hour for machine operators and for non-machine workers includespayroll overhead of 48%. The basic hourly wages are 12.00 for machine operators and for non-machinelabor. The overhead includes the employers’ share of federal and California state payroll taxes, workers'compensation insurance for field crops (code 0171), and a percentage for other possible benefits. Workers’compensation insurance costs will vary among growers, but for this study the cost is based upon theaverage industry final rate as of January 1, 2007 (California Department of Insurance). Labor foroperations involving machinery are 20% higher than the operation time given in Table 1 and 4 to accountfor the extra labor involved in equipment set up, moving, maintenance, work breaks, and field repair.Cash OverheadCash Overhead. Cash overhead consists of various cash expenses paid out during the year that areassigned to the whole farm and not to a particular operation. These costs include property taxes, intereston operating capital, office expense, liability and property insurance, rents, and investment repairs. Cashoverhead costs are included in Tables 1, 2, 3 and 4.Property Taxes. Counties charge a base property tax at the rate of 1% on the assessed value of theproperty including land, equipment, buildings, and improvements. In some counties special assessmentdistricts exist and charge additional taxes on property. For this study, county taxes are calculated as 1%of the average value of the property. Average value equals new cost plus salvage value divided by 2 on aper acre basis. Land value is assumed to remain unchanged.Interest on Operating Capital. Interest on operating capital is based on cash operating costs and iscalculated monthly until harvest at a nominal rate of 10.00% per year. It is assumed that all cashoperations are financed. A nominal interest rate is the typical market cost of borrowed funds. The costsof postharvest operations are discounted back to the harvest month using a negative interest charge.Insurance. Insurance for farm investments varies depending on the assets included and the amount ofcoverage. Property insurance provides coverage for property loss and is charged at 0.714% of the averagevalue of the assets over their useful life. Liability insurance covers accidents on the farm and costs 1,036for the entire farm or 1.64 per acre.Office Expense. Office and business expenses are estimated at 25.40 per acre. These expenses includeoffice supplies, telephones, bookkeeping, accounting and legal fees, road maintenance, and miscellaneousbusiness expenses.Rent. Cash rents range from 200 to 250 per producing acre. The grower in this study rents 479 acres ofwhich 456 are producing or planted acres and the grower pays 225 per rented producing acre to thelandlord. The rent cost is charged to the rice land (600 acres) at 180 per producing acre. The nonproducing acres are roads, irrigation system, and equipment yard.Investment Repairs. Annual cash maintenance or repair costs are associated with investments under noncash overhead. Repairs to the fuel tanks and pumps, shop building, shop tools, irrigations system, toolcarrier, and fuel wagon are calculated at 10% of new cost distributed over the investment life.2007 Rice Cost and Return Study (Rice Rotation Only)Sacramento ValleyUC Cooperative Extension7
Non-Cash OverheadNon-cash overhead is calculated as the capital recovery cost for equipment and other farm investments.This study shows the current purchase price for new equipment and then adjusts the price to 40% of newcost to indicate a mix of new and used equipment. Annual ownership costs for equipment andinvestments are shown in Tables 1, 2, and 4 as the capital recovery cost on an annual per acre basis.Capital Recovery Costs. Capital recovery cost is the annual depreciation and interest costs for a capitalinvestment. It is the amount of money required each year to recover the difference between the purchaseprice and salvage value (unrecovered capital). Put another way, it is equivalent to the annual payment ona loan for the investment with the down payment equal to the discounted salvage value. This is a morecomplex method of calculating ownership costs than straight-line depreciation and opportunity costs, butmore accurately represents the annual costs of ownership because it takes the time value of money intoaccount (Boehlje and Eidman). The calculation for the annual capital recovery costs is as follows:Capital)"%,% "),Purchase!Salvage( ' Recovery' . Salvage ( Interest .& #Pr iceValueValueRate& .* *#FactorSalvage Value. Salvage value is an estimate of the remaining value of an investment at the end of itsuseful life. For farm machinery (tractors and implements) the remaining value is a percentage of the newcost of the investment (Boehlje and Eidman). The percent remaining value is calculated from equationsdeveloped by the American Society of Agricultural Engineers (ASAE) based on equipment type and yearsof life. The life in years is estimated by dividing the wearout life, as given by ASAE by the annual hoursof use in this operation. For other investments including irrigation systems, buildings, and miscellaneousequipment, the value at the end of its useful life is zero. The salvage value for land is equal to thepurchase price because land does not depreciate. The purchase price and salvage value for certainequipment and investments are shown in Table 5.Capital Recovery Factor. Capital recovery factor is the amortization factor or annual payment whosepresent value at compound interest is 1. The amortization factor is a table value that corresponds to theinterest rate used and the life of the machine.Interest Rate. The interest rate of 7.25% is used to calculate capital recovery cost is the effective longterm interest rate in January 2007. The interest rate is provided by a local farm lending agency and willvary according to risk and amount of loan.Land. Land values range from 5,000 to 7,000. The grower in this study owns 151 acres of land that isvalued at 6,000 per acre. The cost is charged to the rice land (600 acres) at 1,510 per producing acre.Farmstead, roads, and the irrigation system are on 7 of the 151 owned acres.Irrigation System. The irrigation system in this study has the water delivered by a water district via canaland moved to the field by a portable PTO powered, low-lift pump. Many growers use well water tosupplement surface water deliveries. In this study a 75 HP electric pump with a 500 foot deep well andpumps water from an average depth of 120 feet. The water delivery system or returns system is notcalculated as a cost in this study.2007 Rice Cost and Return Study (Rice Rotation Only)Sacramento ValleyUC Cooperative Extension8
Equipment. Equipment costs are composed of three parts: non-cash overhead, cash overhead, andoperating costs. Both of the overhead factors have been discussed in previous sections. The operatingcosts consist of repairs, fuel, and lubrication. The fuel, lube, and repair cost per acre for each operation inTable 1 is determined by multiplying the total hourly operating cost in Table 5 for each piece ofequipment used for the selected operation by the hours per acre. Tractor time is 10% higher thanimplement time for a given operation to account for setup, travel and down time.Repairs, Fuel and Lube. Repair costs are based on purchase price, annual hours of use, total hours of life,and repair coefficients formulated by the American Society of Agricultural Engineers (ASAE). Fuel andlubrication costs are also determined by ASAE equations based on maximum PTO horsepower, and fueltype. Prices for on-farm delivery of diesel and gasoline are 2.30 and 2.80 per gallon, respectively.Rented Equipment. A 225 HP 4WD tractor and a chisel are rented for one month (200 hours). Thetractor is used to chisel 700 acres one time. In addition, the remaining available tractor time was used totriplane a portion of the acres. The operating expenses are included in the fuel, lube, and labor items inTable 2.Table Values. Due to rounding, the totals may be slightly different from the sum of the components.Acknowledgements. The authors appreciate the help provided by Dr. Daniel A. Sumner, Director of theAgricultural Issues Center, U.C. Davis who contributed to the sections on government programs.Appreciation is also expressed to those growers and other cooperators who provided information for thisstudy.2007 Rice Cost and Return Study (Rice Rotation Only)Sacramento ValleyUC Cooperative Extension9
REFERENCESAmerican Society of Agricultural Engineers. 2002. American Society of Agricultural Engineers StandardsYearbook. Russell H. Hahn and Evelyn E. Rosentreter (ed.) St. Joseph, MO. 41st edition.Boehlje, Michael D., and Vernon R. Eidman. 1984. Farm Management. John Wiley and Sons. NewYork, NYBlank, Steve, Karen Klonsky, Kim Norris, and Steve Orloff. 1992. Acquiring Alfalfa Hay Equipment: AFinancial Analysis of Alternatives. University of California. Oakland, CA: Giannini Information SeriesNo. 92-1. df. Internet accessed August, 2006.California Department of Food and Agriculture. 2001. 2001 Agricultural Commissioners’ c.htm. Internet accessed September, 2006.California Department of Food and Agriculture. 2002. 2002 Agricultural Commissioners’ c.htm. Internet accessed September, 2006.California Department of Food and Agriculture. 2003. 2003 Agricultural Commissioners’ c.htm. Internet accessed September, 2006.California Department of Food and Agriculture. 2004. 2004 Agricultural Commissioners’ c.htm. Internet accessed September, 2006.California Department of Food and Agriculture. 2005. 2005 Agricultural Commissioners’ c.htm. Internet accessed September, 2006.Integrated Pest Management Education and Publications. 2004. UC IPM Pest Management Guidelines:Rice. In M. L. Flint (ed.) UC IPM Pest Management Guidelines. University of California. Division stmgmt.html#PMG. Internet accessed August, 2006.Statewide Integrated Pest Management Project. 1992. Integrated Pest Management for Rice. SecondEdition. University of California. Division of Agriculture and Natural Resources. Oakland, CA:Publication 3280.Mutters, Randall, Christopher Greer, Karen M. Klonsky, Pete Livingston. 2004. Sample Costs to ProduceRice, Sacramento Valley, Rice only Rotation. University of California, Cooperative Extension.Department of Agriculture and Resource Economics. Davis, CA.For information concerning the above or other University of California publications, contact UC DANR Communications Services at 1-800-994-8849, onlineat www.ucop.edu, or your local county UC Cooperative Extension office.2007 Rice Cost and Return Study (Rice Rotation Only)Sacramento ValleyUC Cooperative Extension10
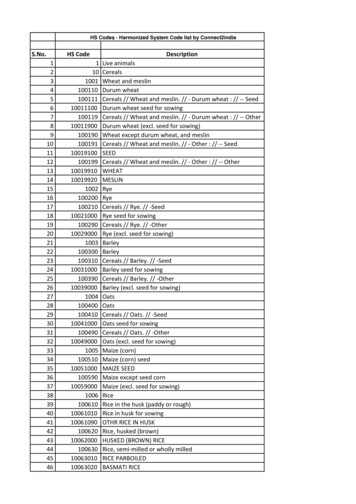
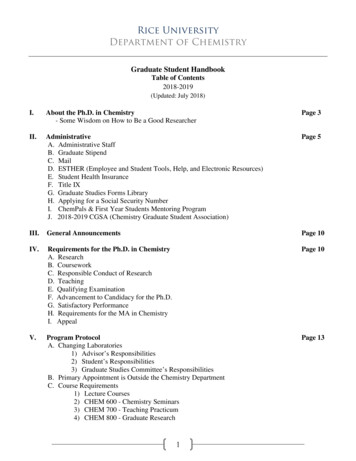
Table 1.UC COOPERATIVE EXTENSIONCOSTS PER ACRE TO PRODUCE RICESACRAMENTO VALLEY - 2007Labor Rate: 17.76/hr. machine labor 17.76/hr. non-machine laborOperationCultural:Maintain DrainsMaintain and Rework LeveesChisel 2XStubble DiscFinish Disc 2XTriplane
Farm. This report is based on a hypothetical 630 acre farm. The grower owns 151 acres and rents 479 acres. Rice is grown on 600 acres and 30 acres (7 owned acres and 23 rented acres) are roads, irrigation systems, farmstead, and unused or unusable land. Typically, a grower with this amount of rice acreage