Transcription
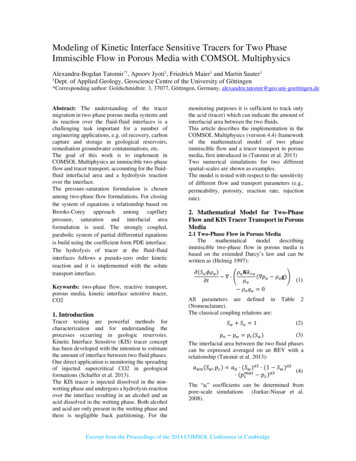
Modeling of Kinetic Interface Sensitive Tracers for Two PhaseImmiscible Flow in Porous Media with COMSOL MultiphysicsAlexandru-Bogdan Tatomir*1, Apoorv Jyoti1, Friedrich Maier1 and Martin Sauter11Dept. of Applied Geology, Geoscience Centre of the University of Göttingen*Corresponding author: Goldschmidtstr. 3, 37077, Göttingen, Germany, alexandru.tatomir@geo.uni-goettingen.deAbstract: The understanding of the tracermigration in two-phase porous media systems andits reaction over the fluid-fluid interfaces is achallenging task important for a number ofengineering applications, e.g. oil recovery, carboncapture and storage in geological reservoirs,remediation groundwater contaminations, etc.The goal of this work is to implement inCOMSOL Multiphysics an immiscible two-phaseflow and tracer transport, accounting for the fluidfluid interfacial area and a hydrolysis reactionover the interface.The pressure-saturation formulation is chosenamong two-phase flow formulations. For closingthe system of equations a relationship based onBrooks-Corey approach among capillarypressure, saturation and interfacial areaformulation is used. The strongly coupled,parabolic system of partial differential equationsis build using the coefficient form PDE interface.The hydrolysis of tracer at the fluid-fluidinterfaces follows a pseudo-zero order kineticreaction and it is implemented with the solutetransport interface.Keywords: two-phase flow, reactive transport,porous media, kinetic interface sensitive tracer,CO21. IntroductionTracer testing are powerful methods forcharacterization and for understanding theprocesses occurring in geologic reservoirs.Kinetic Interface Sensitive (KIS) tracer concepthas been developed with the intention to estimatethe amount of interface between two fluid phases.One direct application is monitoring the spreadingof injected supercritical CO2 in geologicalformations (Schaffer et al. 2013).The KIS tracer is injected dissolved in the nonwetting phase and undergoes a hydrolysis reactionover the interface resulting in an alcohol and anacid dissolved in the wetting phase. Both alcoholand acid are only present in the wetting phase andthere is negligible back partitioning. For themonitoring purposes it is sufficient to track onlythe acid (tracer) which can indicate the amount ofinterfacial area between the two fluids.This article describes the implementation in theCOMSOL Multiphysics (version 4.4) frameworkof the mathematical model of two phaseimmiscible flow and a tracer transport in porousmedia, first introduced in (Tatomir et al. 2013)Two numerical simulations for two differentspatial-scales are shown as examples.The model is tested with respect to the sensitivityof different flow and transport parameters (e.g.,permeability, porosity, reaction rate, injectionrate).2. Mathematical Model for Two-PhaseFlow and KIS Tracer Transport in PorousMedia2.1 Two-Phase Flow in Porous MediaThemathematicalmodeldescribingimmiscible two-phase flow in porous media isbased on the extended Darcy’s law and can bewritten as (Helmig 1997): (𝑆𝛼 𝜙𝜌𝛼 )𝜌𝛼 𝐊𝑘𝑟𝛼( 𝑝𝛼 𝜌𝛼 𝐠)) ((1) 𝑡𝜇𝛼 𝜌𝛼 𝑞𝛼 0All parameters are defined in(Nomenclature).The classical coupling relations are:𝑆𝑤 𝑆𝑛 1Table2(2)(3)𝑝𝑛 𝑝𝑤 𝑝𝑐 (𝑆𝑤 )The interfacial area between the two fluid phasescan be expressed averaged on an REV with arelationship (Tatomir et al. 2013):𝑎𝑤𝑛 (𝑆𝑤 , 𝑝𝑐 ) 𝑎0 (𝑆𝑤 )𝑎1 (1 𝑆𝑤 )𝑎2(4) (𝑝𝑐𝑚𝑎𝑥 𝑝𝑐 )𝑎3The “ai” coefficients can be determined frompore-scale simulations (Joekar-Niasar et al.2008).Excerpt from the Proceedings of the 2014 COMSOL Conference in Cambridge
The constitutive relationship between capillarypressure and saturation is formulated usingBrooks-Corey model:𝑝𝑐 (𝑆𝑤 ) 𝑝𝑑 1 𝑆𝑒 𝜆𝑆𝑤 𝑆𝑤𝑟𝑤𝑖𝑡ℎ 𝑆𝑒 1 𝑆𝑤𝑟(5)and for relative permeability using a BurdineBrooks-Corey approach:2 3𝜆𝜆𝑘𝑟𝑤 𝑆𝑒,2 𝜆The two-phase flow equation (1) is written foreach phase having pw, Sn as primary variables: (𝑆𝑛 𝜙𝜌𝑤 )𝜌𝑤 𝐊𝑘𝑟𝑤( 𝑝𝑤 𝜌𝑤 𝐠)) ((9) 𝑡𝜇𝑤 𝜌𝑤 𝑞𝑤 0 (𝑆𝑛 𝜙𝜌𝑛 )𝜌𝑛 𝐊𝑘𝑟𝑛( 𝑝𝑤 𝑝𝑐 ( 𝑡𝜇𝑛(6) 𝜌𝑛 𝐠)) 𝜌𝑛 𝑞𝑛 0𝑘𝑟𝑛 (1 𝑆𝑒 )2 (1 𝑆𝑒 𝜆 ) 0 .The pressure-saturation formulation is chosenamong two-phase flow formulation because it hasthe most advantages (Helmig 1997). Wettingpressure and non-wetting saturations are the twoprimary variables.2.2 Acid Tracer TransportIt is assumed that the KIS tracer is completelydissolved in the non-wetting phase and that thereis in sufficient quantity such that the fluid-fluidinterfaces will always remain saturated. KIStracer’s reaction products are acid and alcohol.For the quantification of the interfacial area it isonly necessary to add the transport equation forthe acid byproduct. Therefore, the solute transportequation for acid concentration C is:𝜙 𝐶𝑅 (𝐶𝑣𝑤 𝜙𝐷 𝐶) 𝑞𝑛 𝑤 0 𝑡(7)The hydrolysis reaction is representedaveraged over the entire elementary volume by aneffective specific interfacial area term and aneffective rate coefficient. It is assumed that thereaction follows a zero order kinetic law:𝑅𝑅𝑞𝑛 𝑤 𝑘𝑛 𝑤𝑎𝑤𝑛(8)3. Model Implementation in COMSOLMultiphysicsThe model implementation consists of two parts.The first one is the immiscible two-phase flow inporous media and the second is the KIS tracertransport in the wetting phase.3.1 Immiscible Two-Phase Flow in PorousMedia Model ImplementationThe implementation of the two-phase immisciblefluid model is done within the Coefficient FormPDE (Partial Differential Equation) interface.(10)COMSOL requires a transformation of variableswith respect to pw and Sn. The chain rule formulain calculus allows us to write: 𝑝𝑐 𝑑𝑝𝑐 𝑆𝑛𝑑𝑆𝑛(11)In COMSOL the Coefficient Form PDE equationfor the primary variable u has the followingexpression:𝑒𝑎 2𝐮 𝐮 𝑑𝑎 2 𝑡 𝑡(12) ( 𝑐 𝐮 𝛼𝐮 𝛾) 𝛽 𝐮 a𝐮 𝑓The two primary variables are:𝑝𝑤𝐮 ( )𝑆𝑛(13)Next the PDE coefficients are introduced:0 𝜙𝜌𝑤𝑑𝑎 ()0 𝜙𝜌𝑛𝐾λw ρw𝑐 (𝐾λ𝑛 𝜌𝑛(14)0𝑑𝑝𝑐 )𝐾λ𝑛 𝜌𝑛 ()𝑑𝑆𝑛(15)From equation (5) the derivative can be written:1𝑑𝑝𝑐 1( 𝑝𝑑 (1 𝑆𝑛 ) λ 1)𝑑𝑆𝑛 λ(16)3.2 KIS Tracer Transport in Wetting PhaseModel ImplementationFor the implementation of the KIS tracer transportin the wetting phase in porous media the “SoluteTransport” module is used. The number of speciesin the system is set to 1 and the concentration isassigned the symbol c.Excerpt from the Proceedings of the 2014 COMSOL Conference in Cambridge
Two couplings between the PDE module andsolute transport module were enabled. First thesolution for the flow velocity of the wetting fluid,as carrier fluid, from the PDE module is specifiedas user defined velocity in the Solute Transportmodule. Second, a reaction node is added todefine the hydrolysis of the KIS tracer over thefluid-fluid interface (Eq. (8). In doing so, thespecific interfacial area, 𝑎𝑤𝑛 is coupled with theSn from PDE module defined in Eq. (4).4. Numerical The first simulated numerical example is a 2Dhorizontal laboratory column with the dimensionsof 50cm x 3cm (Figure 12a). For this quasi onedimensional case, the gravity term is neglected.The non-wetting phase is injected together withKIS tracer on the left side of the domain at aconstant rate of 1.0e-3 kg/m2 s for 1 day. This isspecified as a “Flux/source” node in the“Coefficient Form PDE” module. For solutetransport the left boundary is initialized with azero concentration. The acid tracer concentrationis produced in the domain when the saturationsare not zero as a source term. On the right side ofthe column the boundary condition is defined asDirichlet with constant non-wetting phasesaturation 0.0, and a wetting pressure of 1 bar; asfor the tracer transport, the right boundary is setas outflow. On upper and lower boundaries we setno-flow boundary conditions. The initialconditions are 1 bar for the wetting pressure, 0.0for the non-wetting saturation, and 0 g/l tracerconcentration. The initial values specified inTable 1 are kept constant throughout the tThe second numerical example is that of a singlewell (field scale) injection. Because the domain ishomogeneous and symmetric only a quarter needsto be solved, therefore the dimensions of thesimulated domain are 100m x 80m (Figure 12b).The non-wetting phase is injected at the lower leftcorner of the domain with the distributed rate of0.01 kg/m2 s for 30 days.The boundary conditions are set no flow on lowerand left sides, and Dirichlet (pw 100 bar and Sn 0) elsewhere.5. Results and discussions5.1 Laboratory Scale ResultsThe sensitivity analysis with respect to theeffective porosity of the system is depicted infigures 1 to 3 in the form of breakthrough curves(BTCs) of acid concentration, non-wettingsaturation and specific interfacial areas. Thecenter of the column is chosen as observationpoint for plotting the results. The porosity wasvaried from a very less porous system 10% to ahighly porous system with a porosity of 30%.It can be observed that the change in porosity isaffecting the front speed, which is the expectedbehavior. The front is fastest for the least porousvalue in the system i.e. 10%. This behavior canalso be seen in the acid concentration BTC.Next we perform a sensitivity analysis toinvestigate the effect of the non-wetting phaseinjection rate on breakthrough curves of acidconcentration, non-wetting saturation and specificinterfacial area. The injection rate is varied from7.e-4 to 2.5e-3 kg/m2·s. The results are plotted inFigure 4, Figure 5 and Figure 6.Figure 7 illustrates the tracer concentration BTCsfor different reaction rates at center of the column.We can observe that a higher reaction rates leadasexpectedtohigherconcentrations.Nevertheless, some results are out of the physicalrange as the KIS tracer is never depleted at theinterface and acid is produced as long as bothphases are present (saturation is neither zero orone).5.2 Field Scale ResultsFor Field Scale evaluation we implement asensitivity analysis of two main parameters, theporosity of the system (𝜙) and the reaction rate𝑅(𝑘𝑛 𝑤).Similarly to the laboratory-scale example theresults are illustrated in the form of BTCs of acidconcentration, non-wetting saturation and specificinterfacial areas.The sensitivity analysis with respect to changingporosity of the system (from 10% to highly porousmaterial of 40%) is given in Figure 8 (specificinterfacial area), Figure 9 (non-wetting saturation)and Figure 10 (tracer concentration).Excerpt from the Proceedings of the 2014 COMSOL Conference in Cambridge
We can conclude that by increasing the porosityof the system non-wetting saturation front is beingslowed, as well as, the movement of the interfaceand that of the tracer concentration. The lessporous is the system, the interface moves faster inthe domain and reaches higher peakconcentrations (Figure 10). On the contrary, thepeak saturation and specific interfacial area is notaffected by porosity (Figure 8, Figure 9).The sensitivity analysis with respect to thereaction rate of KIS tracer over the wetting-nonwetting interface is illustrated in Figure 11. Therate is varied between 1.e0-4 and 1e-6 kg/m2·s.4. Tatomir, A. et al., Modelling of KineticInterface Sensitive Tracers for Two-PhaseSystems. In M. Z. Hou, H. Xie, & P. Were, eds.Clean Energy Systems in the Subsurface:Production, Storage and Conversion. SpringerSeries in Geomechanics and Geoengineering,Springer Berlin Heidelberg, pp. 65–74 (2013)8. AcknowledgementsThis research has received funding from theEuropeanCommunity’s7thFrameworkProgramme through the MUSTANG (Grantagreement no. 227286) and TRUST (Grantagreement no. 309067) projects.6. Summary and ConclusionsWe have introduced a mathematical model forKIS tracer transport in two-phase immiscible flowin porous media. Next we have introduced thesteps for the model implementation intoCOMSOL Multiphysics version 4.4.Two porous media systems, at laboratory- andfield-scale have been shown as numericalexamples. Several sensitivity studies haveinvestigated the behavior of the tracerconcentration, the interfacial area and fluidsaturation, with regard to several flow andtransport parameters. The simulation results helpus gain a better understanding on the behavior ofone of KIS tracer’s reaction product.Last but not least, COMSOL provides a goodenvironment to implement and simulate twophase flow and tracer transport accounting forfluid-fluid interfacial area.9. AppendixTable 1: The initial values used for the two Scale values0.21 𝑒 12 [m2]1000 [kg/m3]700 [kg/m3]22000[Pa]105 [Pa]0.01.0e-4 [kg/m2·s]𝜇𝑛𝜇𝑤𝑅𝑘𝑛 𝑤1.0e-4 [Pa·s]1.0e-3 [Pa·s]1.0e-6 [kg/m2·s]Field Scalevalues0.21 𝑒 10 [m2]1000 [kg/m3]700 [kg/m3]22000[Pa]107 [Pa]0.01.0e-3[kg/m2.s]1.0e-4 [Pa·s]1.0e-3 [Pa·s]1.0e-67. References1. Helmig, R., Multiphase Flow and TransportProcesses in the Subsurface: A Contribution tothe Modeling of Hydrosystems 1st ed., Springer,(1997)2. Joekar-Niasar, V. et al., Insights into theRelationships Among Capillary Pressure,Saturation, Interfacial Area and RelativePermeability Using Pore-Network Modeling.Transport in Porous Media, 74(2), pp.201–219(2008)3. Schaffer, M. et al., A new generation of tracersfor the characterization of interfacial areas duringsupercritical carbon dioxide injections into deepsaline aquifers: Kinetic interface-sensitive tracers(KIS tracer). International Journal of GreenhouseGas Control, 14, pp.200–208 (2013)Table 2: 𝑛𝑘𝑟𝑤Density of Wetting PhaseViscosity of Wetting PhaseIntrinsic PermeabilityPorosity (phi)Saturation of Non-Wetting PhaseSaturation of Wetting PhaseInterfacial AreaDensity of Wetting PhaseViscosity of Non-Wetting PhaseEntry pressure in Brooks CoreyBrooks-Corey ParameterRelative Permeability of Non-wettingphaseRelative Permeability of wetting phaseExcerpt from the Proceedings of the 2014 COMSOL Conference in Cambridge
��𝑖𝑛𝑅𝑘𝑛 𝑤𝑣𝑤Residual Saturation of Wetting phaseSource term volume flux (m3/s·m3)Gravity vectorPressure of Wetting phaseP
Kinetic Interface Sensitive (KIS) tracer concept has been developed with the intention to estimate the amount of interface between two fluid phases. One direct application is monitoring the spreading of injected supercritical CO2 in geological formations (Schaffer et al. 2013). The KIS tracer is injected dissolved in the non-wetting phase and undergoes a hydrolysis reaction over the interface .