Transcription
Aberdeen Key FactsCare & ProtectionNumber of children looked after by local authority on 31st July 2017There were 590 children being looked after by Aberdeen City Council at 31st July 2017, with there being moremales than females being looked after.Council AreaMaleFemaleTotalAberdeen City354236590Aberdeenshire219176395Dundee City297258555City of Edinburgh7266231,349Glasgow City1,4851,3422,827Scotland8,1216,77614,897Source: Scottish Government, Children’s Social Work Statistics 2016/17NB: Please note that figures are provisional, and table excludes children who are on a planned series ofshort term placements. A child may start and cease to be looked after more than once during theyear and will be counted once for each episode of care starting and ending.Number of children on the child protection registerAt 31st July 2017 there were 81 children on the child protection register in Aberdeen City, down from 118 in 2016.As at 31st July2014As at 31st July2015As at 31st July2016As at 31st July2017% Change2016-17Aberdeen CityAberdeenshireDundee y of Edinburgh313256288236-18.1%Glasgow ncil AreaScotlandSource: Scottish Government, Children’s Social Work Statistics 2016/17Referrals to Children's Reporter by age in Aberdeen City, 2017/18The table shows the number of children referred to the Children's Reporter in 2017/18 by age group. Youngpeople aged 16 and 17 years can be referred if they are subject to a Compulsory Supervision Order, are remittedby a court or had an open case prior to their 16th birthday. A child may be referred at more than one age in theyear. The totals count each child once. The ages of a small number of children were not recorded. Please note thatthe data definitions around this measure have been changed to exclude 'Joint to Procurator Fiscal' referrals.Age group0-3 years4-7 years8-11 years12-15 years16 years2017/1897524812117Source: Scottish Children's Reporter Administration
Number of clients receiving Social Care services in Aberdeen City, by client group, 2016This table shows the number of clients who received social care services in Aberdeen City. The highest clientgroups are frail older people, dementia, those with a physical disability, and those classed as 'other' whichincludes people with addictions, palliative care and carers.Under 65yearsOver 65yearsTotalFrail Older People04,9504,950Physical disability6804201,100Mental Health53050580Learning own20020DementiaSource: Scottish Government: Social Care Services Scotland 2016* “Other” includes addictions, palliative care and carers.Homeless applications by Local Authority, 2016/17180016001400120010008006004002000Jan-Mar 16Apr-Jun 16Glasgow CityJul-Sep 16Oct-Dec 16City of EdinburghSource: Scottish Government: Homelessness in Scotland UpdateJan-Mar 17Aberdeen CityApr-Jun 17Jul-Sep 17Dundee City
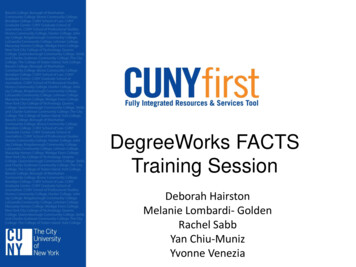
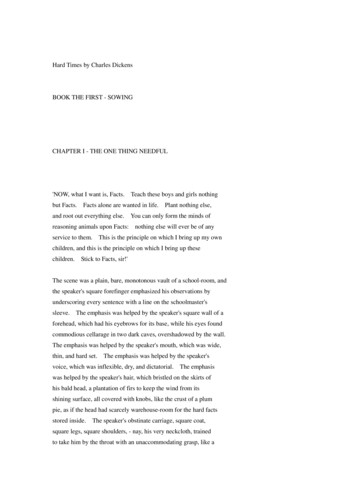
Aberdeen Key FactsCommunity SafetyAll crimes recorded by the Police, 2016-17 and 2017-18Crimes recorded by the police in Aberdeen City decreased by 10.2% from 13,934 in 2016/17 to 12,509 in 2017/18.This was in contrast to the City of Edinburgh which increased by 11.9%.Council Area2016-172017-18% Change in crimesAberdeen ndee City8,9028,9560.6City of Edinburgh29,55833,08011.9Glasgow : Scottish Government, Recorded Crime in Scotland, 2017-18Recorded crimes in Aberdeen City, 2017-18Just under half (48.1%) of the recorded crimes in Aberdeen City are classed as crimes of dishonesty (e.g. theft,shoplifting etc). This is slightly higher than the Scottish average of 46.8%. In contrast, the incidence of fire-raisingand vandalism is lower in Aberdeen City (17.5%) than Scotland (21.0%).3.0% 5.0%26.4%Non-sexual crimes of violenceSexual crimesCrimes of dishonesty48.1%17.5%Fire-raising, vandalism etc.Other crimesSource: Scottish Government, Recorded Crime in Scotland, 2017-18Crimes recorded per 10,000 population*, 2017-18Aberdeen CityNon-sexual crimesof violence16Sexualcrimes27Crimes ofdishonesty263Fire-raisingvandalism, 65265240Dundee City1841283122138602City of Edinburgh162139811594645Glasgow City2533332132186708Scotland132321195109451Council AreaSource: Scottish Government, Recorded Crime in Scotland, 2017-18*Population estimates are as of mid-year 2017 from the National Records of Scotland
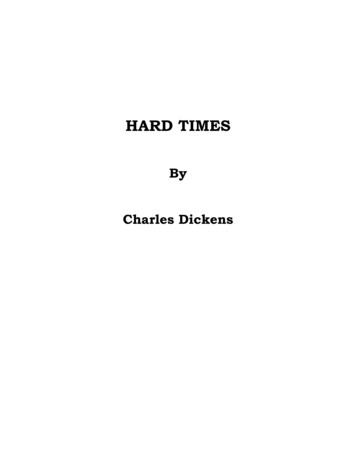
Incidents of domestic abuse recorded by the police, 2014/15 to 2016/17Incidents of domestic abuse recorded by the police in Aberdeen City decreased from 2,570 in 2015/16 to 2,522in 2016/17 - a drop of 1.9%.Council Area2014/152015/162016/17Aberdeen dee City2,5252,3652,266City of Edinburgh5,7305,5415,445Glasgow e: Scottish Government: Domestic abuse recorded by the Police in Scotland, 2016-17Dwelling fires by motive per 100,000 dwellings, 2016-17p, Local AuthorityCouncil AreaAberdeen CityAberdeenshireDundee CityCity ofEdinburghGlasgow CityScotlandNumber ��s)304.1158.0347.2Source: Scottish Fire and Rescue Service, Fire and Rescue Statistics (Table 3.b)p – provisional1- Dwellings data sehold-estimates/2016/list-of-tablesHate crime recorded by the Police, Aberdeen CityBetween 2015/16 and 2016/17 financial year (Apr-Mar), the number of hate crime recorded by thePolice in Aberdeen City reduced by 7.3%, from 261 to 242.300Number of hate crime27026124224021018015012090603002015/16Source: Police Scotland2016/17
Aberdeen Key FactsDeprivationMost deprived data zones, SIMD 2016The Scottish Index of Multiple Deprivation (SIMD) is the Scottish Government’s official tool for identifyingsmall area concentrations of multiple deprivation across all of Scotland. It is based on the small area geographyknown as data zones. SIMD 2016 is developed using 2011 based data zones whilst previous editions have used2001 based data zones. Therefore, no direct comparison is possible with the previous editions. Based on 2011data zones there are 6,976 data zones in Scotland and 283 data zones in Aberdeen City. The Scottish Governmentuses a 15% cut-off to define the most deprived data zones. By that measure, 9 of Aberdeen City’s 283 data zoneswere among the most deprived in Scotland in SIMD 2016.All data zonesIn most deprived 15% inScotland% of all data zones incouncil areaAberdeen City28393%Aberdeenshire34031%Dundee City1885529%City of Edinburgh5975910%Glasgow City74632043%6,9761,046ScotlandSource: Scottish GovernmentNumber and population of most deprived(MD) data zones in Aberdeen CityAberdeen City has 22 data zones in the most deprived 20% of all Scottish data zones. These data zones have apopulation of 18,055, which accounts for 7.9% of the City's total population. The most deprived data zones inAberdeen City are located in the Torry, Middlefield, Northfield, Seaton, Tillydrone, Woodside, Mastrick,Sheddocksley and George Street neighbourhoods.Number of data zonesPopulation of data zones% of Aberdeen City Population*MD 0-5%in ScotlandMD 5-10%in ScotlandMD 10-15%in ScotlandMD 15-20%in ScotlandAlldata zones inMD 57.9%Source: Scottish Government* Population based on 2014 small area population estimates published by the National
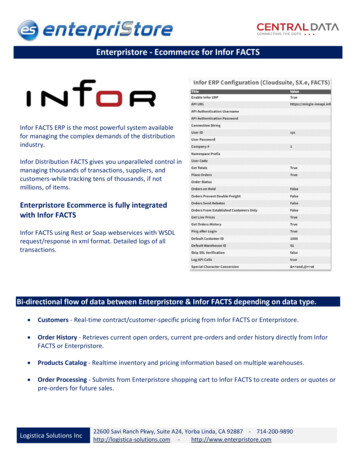
Most deprived (MD) data zones in Aberdeen City by individual domainAs deprivation can take many different forms, the SIMD combines seven different domains of deprivation. Bylooking at individual domains of deprivation, a detailed level of concentrations of deprivation in Aberdeen Citycan be identified.No. of data zones in:DomainMD 0-5%in ScotlandMD 5-10%in ScotlandMD 10-15%in ScotlandMD 15-20%in 202413IncomeEmploymentHealthEducation, Skills and TrainingAccess to ServicesCrimeHousingAll DomainsAll AberdeenCity datazones in MD0-20% inScotland198336721739822Source: Scottish GovernmentFuel poverty, 2014-2016Fuel poverty is the condition of being unable to afford to keep one's home adequately heated. Households areconsidered to be in fuel poverty by the Government if they would have to spend more than 10% of theirhousehold income on fuel to keep their home warm. Currently 23% of households in Aberdeen City are in fuelpoverty and 5% are in extreme fuel poverty.% of fuel poor households% of fuel poor householdsin extreme fuel povertyAberdeen City23%5%Aberdeenshire35%15%Dundee City35%6%City of Edinburgh20%6%Glasgow City27%8%Scotland31%8%Council AreaSource: Scottish House Condition Survey, Local Authority AnalysisFuel poverty in Aberdeen City% of households in fuel povertyApproximately a quarter of Aberdeen City households are in fuel poverty since %0%2008-2010 2009-2011 2010-2012 2011-2013 2012-2014 2013-2015 2014-2016Source: Scottish House Condition Survey, Local Authority Analysis
Income support claimants, November 2017Council AreaTotalAberdeen City1,460 25years of age34025-44years of age82045 years of age290Aberdeenshire1,170Dundee City1,9902606902203901,030570City of Edinburgh3,3305801,830920Glasgow 4,630Source: NOMIS Official Labour Market statistics, Dept. for Work and Pensions, Benefit claimants - income support claimantsNB: Figures are rounded to the nearest ten; due to rounding total figure may not matchIncapacity benefit/severe disablement, November 2017Council AreaTotal 25years of age25-44years of age45 years of ageAberdeen City220-30180Aberdeenshire230-40200Dundee City210-30170City of Edinburgh490-80420Glasgow City870-1207606,120-8105,310ScotlandSource: NOMIS Official Labour Market statistics, Dept. for Work and Pensions, Benefit claimants - incapacity benefit/severe disablementNB: Figures are rounded to the nearest ten; due to rounding total figure may not match
Aberdeen Key FactsEconomyAverage gross weekly earnings, 2017 (Workplace-based)In 2017, the median weekly earnings for a full-time worker in Aberdeen City were 583.90. For part-timeworkers, median weekly earnings were 179.10.Council AreaAll EmployeesFull-timePart-timeAberdeen City 483.80 583.90 179.10Aberdeenshire 394.00 514.60 161.70Dundee City 448.10 553.70 218.80City of Edinburgh 496.00 598.50 207.10Glasgow City 467.80 560.80 195.20Scotland 442.20 547.30 189.30Source: Office for National Statistics, Annual Survey of Hours and EarningsEconomic activity rates of those aged 16-64, April 2017 to March 2018Council AreaMalesFemalesTotalAberdeen dee City70.6%64.3%67.3%City of Edinburgh82.1%74.3%78.1%Glasgow City75.8%66.5%71.0%Scotland82.0%73.4%77.6%Source: Office for National Statistics, Annual Population SurveyEmployment by major occupation in Aberdeen City, April 2017 to March 2018Employment Type% of Male% of Female% of TotalManagers, Directors and Senior sociate Prof & Tech13.7%16.2%14.9%Administrative and Secretarial8.2%16.7%12.3%Skilled Trades13.9%2.1%8.2%Caring, Leisure and Other2.7%18.7%10.4%Sales & Customer Service3.6%6.8%5.1%Process, Plant and Machine : Nomis, Annual Population Survey*Estimate and confidence interval not available since the group sample size is zero or disclosive (0-2)
Economic status of residents aged 16-64 in Aberdeen City, April 2017 to March 2018Between April 2017 and March 2018, 74.9% of Aberdeen City residents aged 16-64 were employed,which is very similar to the Scottish average of 74.3%.90.0%80.0%Aberdeen employedUnemployedEconomically inactiveSource: Nomis, Annual Population SurveyModel based estimates of unemployment in Aberdeen City, financial year 2012/13 to2017/18As Annual Population Survey unemployment rates for local authority areas may be based on smallsamples, model-based estimates have been developed to provide a more precise estimate ofunemployment in local authority areas. The graph below shows model-based unemployment estimatesfrom 2012/13 to 2017/18.6.0%Unemployment Rate pr12-Mar13Apr13-Mar14Source: Nomis, Annual Population SurveyApr14-Mar15Apr15-Mar16Apr16-Mar17Apr17-Mar18
Claimant Count claimants by 2015 electoral ward in Aberdeen City, November 2017Ward NameNo.Proportion of residents age16-64 (%)Airyhall/Broomhill/Garthdee1451.4Bridge of Don1200.9Dyce/Bucksburn/Danestone1851.5George St/Harbour4002.6Hazlehead/Ashley/Queens ll2152.3Lower astrick North3452.9Tillydrone/Seaton/Old Aberdeen4002.9Torry/Ferryhill4502.6Aberdeen City3,1602.0Source: Nomis, Claimant CountNB: 1) Rates for 2015 electoral wards are calculated using the mid-2015 resident population aged 16-642) The claimant count includes all out of work Universal Credit claimants as well as all JSA claimants.3) All data is rounded to the nearest 5 and may not precisely add to the sumMigrant workers in Aberdeen City, country of origin, 2016/17In the financial year 2016/17, there were a total of 3,805 National Insurance Number (NINo) registrations toadult overseas nationals in Aberdeen City. Aberdeen City accounted for 18.6% of all NINo registrations inScotland during 2016/17. The most common country of origin of overseas migrants in 2016/17 was Poland,which accounted for 18.1% of all NINo registrations in Aberdeen City.CountryNo. of NI Registrations% of all NI Registrations inAberdeen 82.8%Other Countries ( 100)1,42137.3%All Countries3,805100%Source: Department of Work and Pensions, NINo Registrations
Business demography: enterprise births and deaths 2016No. of Births ofNew EnterprisesCouncil AreaNo. of Deaths ofEnterprisesAberdeen ire1,1401,2001,0451,265Dundee City480500450485City of Edinburgh3,0552,9152,3452,900Glasgow 20,980Source: Office for National Statistics, Business Demography 2016Registered enterprises in Aberdeen City by employee size band and sector, 20170 - 49employees50-249employees250 08525885670Accommodation and food service tion and communication4351020465Human health and social work activities2853045360Real estate activities3051010325Transportation and storage2353555320Financial and insurance activities75530110Education951010115Arts, entertainment and recreation951015115Mining and Quarrying601530100Agriculture, Forestry and Fishing950095Water supply; Sewerage, waste management andremediation activitiesElectricity, gas, steam and air conditioning supply10552050510Other service ional, scientific and technical activitiesWholesale and retail trade; Repair of motorvehicles and motorcyclesAdministrative and support service activitiesConstructionTotal Number of BusinessesSource: Scottish Government, Business in Scotland 2017Due to rounding within the sectors totals may not add up
Aberdeen City based companies in Scottish Top 100 companiesRank in2017CompanyTurnover mProfit m7Aberdeen Asset 2John Wood Group3,378.0593.6315Technip UK1,321.5489.4621Aker Solutions735.8346.0922National Oilwell Varco UK396.42237.2623Chevron North Sea636.1057.4043Drill-Quip (Europe)191.9057.6544Halliburton Manufacturing & Services621.0312.9850Craig Group185.1718.3651John Clark (Holdings)667.209.1155Balmoral Group Holdings134.4541.0059Archer (UK)150.1117.5460M-I Drilling Fluids UK180.5013.8963Bilfinger Salamis UK181.5513.1168Sodexo Remote Sites 36.358.1495CHC Scotia171.716.70100CAN (Holdings)82.2416.12Source: insider.co.uk, published in January 2017
Aberdeen Key FactsEducationNumber of pupils in publicly funded schools by sector, 2017PupilsCouncil AreaPrimarySecondarySpecialAll SchoolsAberdeen 1135,649Dundee City10,7597,21023818,207City of Edinburgh30,50718,50362849,638Glasgow City41,27225,3581,24067,870Source: Scottish Government: Pupil Census, Supplementary DataAverage class size of primary pupils (1), by local authority, 2017Single stageCouncil AreaP1P2P3P4P5P6P7Aberdeen dee City22.625.525.727.328.727.627.125.7City of Edinburgh22.326.625.927.327.627.827.125.4Glasgow .924.726.026.126.125.923.5Source: Scottish Government: Pupil Census, Supplementary Data(1) Data refers to the average class size of pupils in each stage, not the average class size of single stage classes.Further & higher education student numbers, 2017/18Name of InstitutionTotalFull timePart timeUniversity of Aberdeen14,79312,8141,979Robert Gordon University15,33810,3794,959North East Scotland College11,5536,7364,817Source: Aberdeen University, Robert Gordon University, North East Scotland CollegeAdult learners in Aberdeen City, January to December 2017Number of adult enrolments on activities971Number of individual adult participants517Number of participants from the 15% most deprived areas60Source: Aberdeen City Council
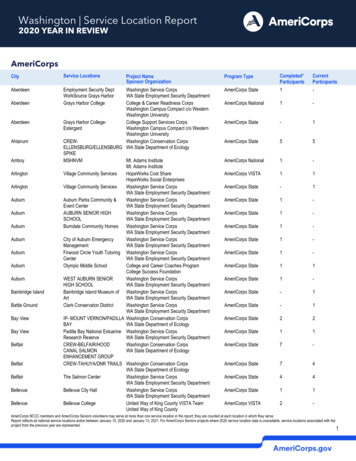
Primary 4-7* and secondary pupils registered for free school meals, 2018% of school roll registered for freemeals in Primary (4-7) School% of school roll registered for freemeals in Secondary SchoolAberdeen City11.710.4Aberdeenshire8.17.0Dundee City28.724.4City of Edinburgh13.911.5Glasgow City30.030.1Scotland**17.114.4Council AreaSource: Scottish Government: School Meals and PE supplementary data*On 5 January 2015, the Scottish Government launched the extension of free school meals eligibility toinclude all children in primary 1-3.**Scotland figures include grant maintained schoolsPercentage of school leavers by follow-up destination, 2016/17Council AreaNumberHigherFurtherof leavers Education Education TrainingEmploymentUnemployedOther*n%%%%%%Aberdeen .327.40.726.14.81.8Dundee City1,22533.129.01.226.68.12.2City of Edinburgh3,23138.921.41.428.87.52.0Glasgow .01.728.36.32.2Source: Scottish Government - Attainment and Leaver Destinations Supplementary data 2016/2017*Other includes: Activity Agreement, voluntary work and unknownFollow up destination of school leavers Aberdeen City, 2016/176%1%24%42%Higher EducationFurther urce: Scottish Government - Attainment and Leaver Destinations Supplementary data 2016/2017*Other includes: Activity Agreement, voluntary work and unknown
Working age adults with no qualifications, January to December 201716-64 yearPopulationNo. of 16-64 adults with noqualification%* of Adults with noqualificationAberdeen %Dundee City96,60012,30012.7%City of Edinburgh345,20011,0003.2%Glasgow City414,50051,60012.4%3,399,500295,4008.7%Council AreaScotlandSource: Annual population Survey, Labour Market Profile*Percentage is a proportion of the resident population of an area aged 16-64 yearsPercentage of school leavers by highest SCQF level at which one or more passes wereachieved, 2016/172016/17Highest level of qualification achieved (%)Council AreaNo passesNumberat SCQF 3 SCQF level SCQF level SCQF level SCQF level SCQF level of all leaversor better34567Aberdeen 8.929.638.021.42,681Dundee City4.52.710.124.642.215.91,231City of Edinburgh2.32.410.721.840.022.83,239Glasgow 4.941.919.351,300Source: Scottish Government - Attainment and Leaver Destinations Supplementary data 2016/2017Information on National Qualifications are obtained from the Scottish Qualifications Authority(SQA). The Scottish Credit and Qualifications Framework (SCQF) is used as the basis for reporting attainment.The SCQF levels are shown below for information.Scottish Credit and Qualifications Framework (SCQF)levels:Level 7 Advanced Higher at A-CLevel 6 Higher at A-CLevel 5 Intermediate 2 at A-C; National 5 at A-C; Standard Grade (Credit)Level 4 Intermediate 1 at A-C, National 4; Standard Grade (General)Level 3 Access 3; National 3; Standard Grade (Foundation)Level 2 Access 2; National 2Qualifications (Jan 2017-Dec 2017)Council AreaNVQ4 andaboveNVQ3 andaboveNVQ2 andaboveNVQ1 andOtherNoabovequalifications qualifications%*%*%*%*%*%*Aberdeen 785.57.07.456.472.981.65.712.7Dundee38.4Edinburgh, City of57.871.282.589.77.23.2Glasgow 96.48.7Source: Annual population Survey, Labour Market Profile*Percentage is a proportion of the resident population of an area aged 16-64 years
Qualifications data are only available from the APS for calendar year periods, for example, Jan to Dec 2005. The variables show thetotal number of people who are qualified at a particular level and above, so data in this table are not additive. Separate figures for eachNVQ level are available in the full Annual Population Survey data set (Query data). The trade apprenticeships are split 50/50 betweenNVQ level 2 and 3. This follows ONS policy for presenting qualifications data in publications. Separate counts for trade apprenticeshipscan be obtained from the full APS data set (Query data).No qualifications - No formal qualifications heldOther qualifications - includes foreign qualifications and some professional qualificationsNVQ 1 equivalent - e.g. fewer than 5 GCSEs at grades A-C, foundation GNVQ, NVQ 1, intermediate 1 national qualification (Scotland) or equivalentNVQ 2 equivalent - e.g. 5 or more GCSEs at grades A-C, intermediate GNVQ, NVQ 2, intermediate 2 national qualification (Scotland) or equivalentNVQ 3 equivalent - e.g. 2 or more A levels, advanced GNVQ, NVQ 3, 2 or more higher or advanced higher national qualifications (Scotland) or equivalentNVQ 4 equivalent and above - e.g. HND, Degree and Higher Degree level qualifications or equivalent
Aberdeen Key FactsEnvironmentHousehold waste management method, 2016As can be seen in the table, in Aberdeen City a high proportion of our waste goes to landfill. However, thereis also a high percentage (39.1%) that is recycled – which is an increase on the previous year (38.5%).HouseholdWastegenerated(tonnes)Landfilled (%)Recycled* (%)Other Aberdeen City96,12358,021 (60.3%)37,498 (39.1%)604 (0.6%)Dundee City67,9984,638 (6.8%)22,860 (33.6%)40,499 (59.5%)City of Edinburgh193,333103,590 (53.6%)86,318 (44.6%)3,424 (1.7%)Glasgow City216,873156,337 (72.1%)54,552 (25.2%)5,983 (2.7%)Council AreaSource: Scotland’s environment* recycled includes recycled, organics recycles & prepared for reuse includes waste disposed by incinerationEco schools with green flag award, 2017In 2017 the number of registered schools in Aberdeen City increased by 1 school. The number of green flagsawarded remained the same from the previous year. Please note that the Bronze and Silver awards havenow been 094692490Aberdeen CityDundee CityRegistered SchoolsSource: Keep Scotland BeautifulCity of EdinburghGreen Flag AwardGlasgow City
Aberdeen Key FactsHealth & WellbeingLife expectancy at birth, 2014-2016Life expectancy at birth is an estimate of the average number of years a new-born baby would survive ifhe/she experienced an area's age specific mortality rates throughout his/her life. In Aberdeen City, estimatedlife expectancy at birth is 76.4 years for males and 80.8 years for females - slightly lower than the respectiverates for Scotland of 77.1 years and 81.1 years.2014-2016Council AreaMalesFemalesAberdeen City76.480.8Aberdeenshire79.282.4Dundee City74.579.6City of Edinburgh78.082.2Glasgow City73.478.9Scotland77.181.1Source: National Records of Scotland: Life Expectancy for Administrative Areas within Scotland 2014-2016Long-term health problem or disability, Census 2011According to the 2011 Census, around 16% of people in Aberdeen City have a long-term illness, healthproblem or disability that limits their daily activities or the work they can do.Aberdeen City222,793Day-to-dayactivitieslimited a ,64184.5Dundee City147,26815,39010.515,32110.4116,55779.1City of ow 505,8639.6534,50810.14,255,03280.4Council AreaScotlandAll people7.0Day-to-dayactivitieslimited a little19,956%9.0Day-to-dayactivities notlimited187,17484.0%%Source: Scotland's Census, 2011 CensusEmergency hospital admissions, 2012/13 to 2016/17pCouncil Area2012/132013/142014/152015/162016/17pAberdeen 28519,91720,20019,98019,540Dundee City15,82815,83416,57116,78017,299City of Edinburgh38,73438,95440,14338,48438,193Glasgow 63,130574,223581,722584,802Source: ISD Scotland, Inpatient and Day Case Activityp provisional
Aberdeen City residents' average personal wellbeing rating 2017/18How satisfied are you with your lifenowadays?7.60What extent do you feel the thingsyou do in your life are worthwhile?7.677.717.88AberdeenScotland7.38How happy did you feel yesterday?7.502.81How anxious did you feelyesterday?2.890.002.004.006.008.0010.00Source: ONS, Personal Wellbeing estimates, 2017/18NB: Personal wellbeing data has been collected by the Office for National Statistics since 2012, four measures were identified(see graph) on a scale of 0 to 10 where 0 being the least point and 10 being the highest point.Body Mass Index of Primary 1 Children, 2016/17Body Mass Index (BMI) is a widely used method for assessing body composition. As part of the child healthprogramme provided by all Scottish Health Boards, height and weight measurements are collected in Primary1 children and recorded on the child health school system (CHSP school). The data below is for the 2016/17school year and shows the proportion of P1 children in each BMI classification (using epidemiological categories)as well as the total number of children measured. In 2016/17, 21.9% of P1 children in Aberdeen City wereclassified as being at risk of overweight or obesity. This is slightly lower than the average rate for Scotlandof 22.9%.%%%%At risk ofoverweightand obesitycombined%Aberdeen .29.322.52,901Dundee City0.877.611.310.221.51,542City of Edinburgh1.476.012.410.222.64,371Glasgow 522.951,529Council AreaAt risk ofunderweightHealthyweightSource: ISD Scotland, Child Health Systems Programme SchoolAt risk ofoverweightAt risk ofobesityNumberof childrenmeasuredn
Number of drug and alcohol related deaths, 2014-20172014Council rug*AlcoholAberdeen ndee City3142365038345732City of Edinburgh7186697690888496Glasgow 508671,2659341,120Source: National Records of Scotland, Drug-related deaths in Scotland, 2017Source: National Records of Scotland, Alcohol-related deaths in Scotland, 2017*based on New National Statistics definitionPercentage of adult smokers, 2012-2016Council Area20122013201420152016Aberdeen 32%20.89%20.47%17.90%17.45%Dundee City28.73%23.74%26.99%25.07%22.36%City of Edinburgh21.32%19.05%17.07%16.73%17.92%Glasgow .33%21.19%20.66%19.55%Source: ISD Scotland/SALSUSMental health inpatients in Aberdeen City hospitals, 2012/13 - 2015/16Admissions during yearDischarges during yearContinuous Inpatient Stays during year (CISs)Individuals discharged during year (Patients)Individuals in hospital on 31 March 3565152Source: ISD Scotland, Hospital inpatient care of people with mental health problems in Scotland: Trends up to31 March 2016
Aberdeen Key FactsHousingAverage (mean) purchase price of residential propertiesVolume of sales in Aberdeen City rose from 3,941 in 2016 to 3,991 in 2017, a rise of 1.3%.Council Area20162017Annual % changeAberdeen -0.6%Dundee City132,577135,5102.2%City of Edinburgh234,440249,6516.5%Glasgow urce: Registers of Scotland, Calendar Market Review 2017All Sectors New Build Completions Financial year time series: 2012/13 to 2016/17Council Area2012-132013-142014-152015-162016-17Aberdeen dee CityCity of EdinburghGlasgow 57716,82717,078Source: Scottish Government, Housing statistics for Scotland: All sector new buildCharacteristics
Recorded crimes in Aberdeen City, 2017-18 Just under half (48.1%) of the recorded crimes in Aberdeen City are classed as crimes of dishonesty (e.g. theft, shoplifting etc). This is slightly higher than the Scottish average of 46.8%. In contrast, the incidence of fire-raising and vandalism is lower in Aberdeen City (17.5%) than Scotland (21.0%).