Transcription
1Q22 EarningsPresentationApril 28, 2022For general public use.
Forward looking statements and non-GAAP financial measuresForward-Looking StatementsForward-looking statements include all statements that are not historical facts and can be identified by terms such as “will,” “may,” “could,” “should,” “believe,”“expect,” “estimate,” “potential” or “continue,” the negative of these terms and other comparable terminology that conveys uncertainty of future events or outcomes.These forward-looking statements involve known and unknown risks, uncertainties, assumptions and other factors that may cause actual results to differ materiallyfrom statements made in this press release, including our business strategies, our operating and financial performance and general market, economic and businessconditions. Other potential risks and uncertainties that could cause actual results to differ from the results predicted include, among others, those risks anduncertainties included under the captions “Risk Factors” and “Management’s Discussion and Analysis of Financial Condition and Results of Operations” in ourAnnual Report on Form 10-K for the year ended December 31, 2021, which is on file with the Securities and Exchange Commission and available on our investorrelations website at http://ir.assetmark.com. Additional information will be set forth in our Quarterly Report on Form 10-Q for the quarter ended March 31, 2022,which is expected to be filed in early May. All information provided in this presentation is based on information available to us as of the date of this presentation andany forward-looking statements contained herein are based on assumptions that we believe are reasonable as of this date. Undue reliance should not be placed onthe forward-looking statements in this presentation, which are inherently uncertain. We undertake no duty to update this information unless required by law.Use of Non-GAAP Financial InformationTo supplement our financial information, which is prepared and presented in accordance with generally accepted accounting principles in the United States ofAmerica, or GAAP, we use non-GAAP financial measures: net revenue, adjusted expenses, adjusted EBITDA, adjusted EBITDA margin, adjusted net incomeand adjusted EPS. The presentation of these non-GAAP financial metrics is not intended to be considered in isolation or as a substitute for, or superior to, thefinancial information prepared and presented in accordance with GAAP. We believe that the presentation of non-GAAP financial information provides importantsupplemental information to management and investors regarding financial and business trends relating to our financial condition and results of operations. Forfurther information regarding these non-GAAP measures, including the limitations thereof and reconciliations of each non-GAAP financial measure to its mostdirectly comparable GAAP financial measure, please refer to our earnings release and Form 10-Q.For general public use.2
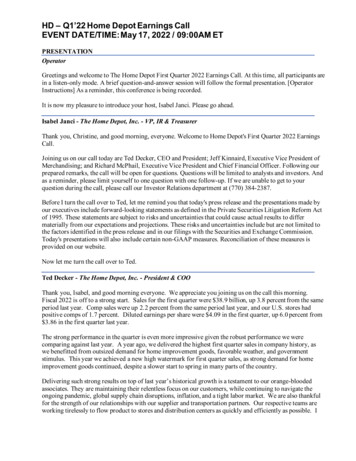
Impact of outsourcing survey shows growing value in outsourcingThree out of four advisors stated that challenges they tackle today include scaling theirbusiness for growth and spending needed time on business building activities. Outsourcingallows advisors to allocate more of their time and resources toward high-impact, highvalue endeavors, to achieve stronger client relationships and growth.Client Relationship Benefits as a Result of OutsourcingInvestment Managements83%Stronger clientrelationships68%91%reported growthin total assets84%reported higherbusiness valuation83%reported higherpersonal income82%Increased clientretention65%74%Acquisition of new/higher-quality clientsIncreased clientreferalsTangible Business Improvements as a Result of Outsourcing67%67%48%Source: The 2021 Impact of Outsourcing Study was conducted by 8 Acre Perspective, an independent research firm, using aquantitative online survey. The study analyzed responses from 757 financial advisors.For general public use.3
1Meet advisors where they areIn March of 2021, we launched AssetMark Institutional, a fully-assembled holistic solution thatprovides registered investment advisors with a comprehensive set of products, operational support,technology, and community resources to support their growth, efficiency, and scale.Sales update Continue to see strong growth within our RIA segment with the “Fee Only RIA” leading the way on theannualized production lift measure; 1Q22 AMI production lift was 19% Enterprise RIAs lead the way as they continue to recruit new advisors and leverage TAMP platform forgrowth. 6 of top 10 producing firms are Enterprise RIA’s In 1Q22, AssetMark signed agreements with 18 RIA firms Will be hosting our second annual RIA summit in June 2022Features update Upgrading Advisor Managed platform that will enhance the user experience (3Q22) Providing several starting point models to AMI advisors (3Q22)For general public use.4
2Deliver a holistic, differentiated experienceThe global market for planning and wellness has grown significantly.Voyant’s strategy focuses on expansion by geographic opportunity.United nds Hybrid model is gainingtraction, combining theself-directed and fullydelegated modelDynamicand holisticadviceRisk Management Financial wellness is agroup endeavorGrowthStrategy Voyant is the market leaderin the enterprise andindependent space Focus on ClientGo toaccelerate new businessmodels and hybrid adoptionFor general public use.CanadaUnited States Financial wellness /planning is the focal pointof client engagement in alllines of business Volatile markets are forcingfirms to re-evaluate theirvalue-added serviceproposition Increasing shift towardsproviding quality valueadded services across allincome levels Independent RIAs continueto be the preferredbusiness model Continue to grow enterprisebanking market share;deepen existingrelationships Focus on Voyant in relationto value proposition, notjust features – teaching andtraining are key drivers ofadoption Further enhancerelationships with creditunions and independentsAustralia Regulation aroundconsumer protection andincreased advisoraccountability provide anoutsized opportunity Product providers areworking to get closer to theend-client via technology Continue Australian growthvia a similar model to U.S. Emphasize wins with keyRIAs, broker-dealers, andproduct providers5
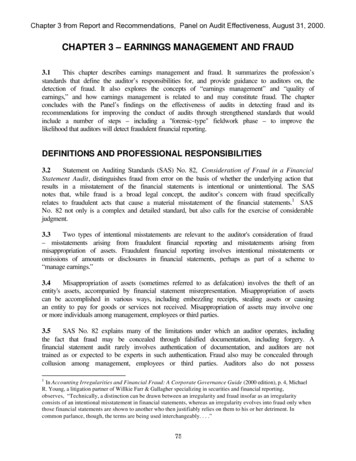
3Enable Advisors to Serve More InvestorsRetail Demand for ESG Strategies in the NextTwo to Three Years by Channel, 20214%Investor demand for ESG strategies is growing; to meet thisdemand AssetMark launched its Values-Driven Investingprogram in April.4%15%54%Values-Driven Investing59%50%ESG Oriented Portfolios42%Indepdent RIAHigh demand37%Hybrid RIAModerate demadeFaith-Based Portfolios Aris Personal Values – Social Aris Personal Values – Faith BlackRock Model Portfolio (New) Parametric Nuveen Model Portfolio (New) AllianceBernstein SMA (New) Brown Advisory SMA (New)Independent B/D Savos ESG SleeveLow demand Parametric35%Source: Cerulli; 2021 U.S. Environmental, Social, and Governance (ESG) Investing ReportFor general public use.6
4Help advisors grow and scale their businessesOnly 25% of adults have received financial savingsadvice from a professional.1 A disconnect remainsbetween how advisors are marketing and how investorswant to initially interact with an advisor. New digital tool designed to streamline prospecting forCurrent prospecting Investors want Large investment of advisor’s time(cold calling) An easy process Large investment of advisor’s money(advertising in traditional or socialmedia) Both large investment of advisor’stime and money (seminars) To choose whether they interactwith a real person To avoid having to set upusernames and passwords To avoid sharing sensitive,financial advisors and provide them with insights to drivelead conversion Low-friction discovery process to “kick-start” a warm clientengagement process, all of which potentially improves theadvisors chances of earning the prospect’s business Enables advisors to generate a unique link to use on theirwebsites, in emails or social posts, or in online advertising Advisors also are equipped with a dashboard that can helpthem organize their lead-to prospect pipeline and keep trackof the status of various engagementspersonal informationSource: 2021 Broadridge 3rd annual financial advisor marketing surveyFor general public use.7
5Pursue Strategic TransactionsM & A StrategyAugmentthe advisorexperiencethrough the addition ofhigh impact capabilitiesand at-scale infrastructure12Strategic GrowthScaleDeliver high impact capabilitiesto enable advisor practices andaccelerate organic growthMonetize at-scale infrastructurethrough buying assets undermanagementIn January 2022, AssetMark announced a 500 million five year credit facility with interestrate of adjusted SOFR 1.875%.1 Purchasing power is now 450 million.1Asof March 31, 2022For general public use.8
Platform assets – 1Q22 billionNet flowsMarketPlatform assets atbeginning of periodPlatform assets atperiod-end9.1% Net Flows as a % of Beginning-of-PeriodPlatform Assets21Asof March 31, 2022as annualized net flows of 2.1 billion divided by beginning-of-period platform assets of 93.5 billion as of January 1, 20222CalculatedFor general public use.9
Solid growth in first quarter advisor and household metricsEngaged and Total Advisors (1Q21-1Q22)Households 2Q213Q214Q211Q221Q21Engaged advisors1Q22Households(dollars in millions)1Q211Q22VPYTotal advisors8,4778,7012.6%2,6112,8157.8% 71,635 83,64316.8%190,915215,66813.0%Engaged advisorsAssets from engaged advisorsHouseholdsFor general public use.10
First quarter results highlighted by record quarterly revenueTotal revenue (1Q21-1Q22) millionNet revenue (1Q21-1Q22) n-based1Q221Q21Other d1Q22Other income(dollars in millions)1Q211Q22VPYTotal revenue 119.0 148.324.6%115.8142.122.7%-3.3NM2.62.0(25.0%) 82.2 asedSubscription-basedSpread-basedRevenue less cost of r general public use.11
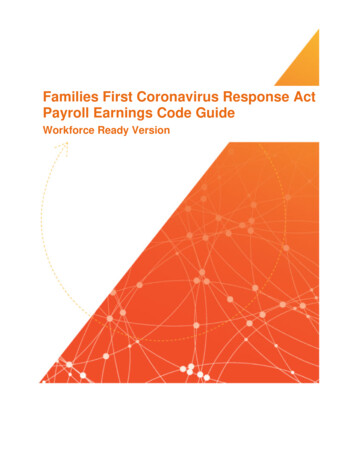
Revenue less cost of revenue – year-over-year comparisonIn millionsReduction ofon-going ABEFee compressionAsset growthSubscriptionbased revenueSpreadincomeOtherincome1Q22 revenue lesscost of revenue1Q21 revenue lesscost of revenueAsset BasedSubscription BasedSpread BasedOther income 20.4m increase due to a 19.0bin billable asset growth and 3.6min reduction of on-going ABEAddition of 3.3m ofsubscription-based revenuefrom the acquisition of Voyant,which closed July 1, 2021Decreased 0.4m year-overyear driven by yield declinefrom 0.31% to 0.22%Increased 0.4m drivenprimarily by Voyant Fee compression was 1 bpyear over yearFor general public use.12
Adjusted expenses (1Q21 vs. 1Q22)Reported ExpensesAdjusted Expenses(dollars in millions)1Q211Q221Q211Q22VPY ( )VPY (%)Asset-based expenses 36.1 41.7 36.1 41.7 5.615.5% 0.7 0.4 0.7 0.4( 0.3)(40.0%)Spread-based expenses28.2%Operating ExpensesEmployee compensation 67.3 40.3 31.0 36.4 5.417.5%SG&A1 21.7 27.8 17.2 25.3 8.247.5%Interest expense 0.8 1.2 0.8 1.2 0.450.3%Depreciation and amortization 9.5 7.5 4.4 5.7 1.431.6%Other expense 0.0 0.1 0.0 0.0 0.0NM 136.0 118.9 90.0 110.7 20.722.9%Total Operating expenses were up 28.2% year-over-year driven by a 47.5% y/y increase in SG&A and a 17.5% y/y increase in employee compensation The increase in employee compensation is driven by increased volume, merit increases and headcount (up 18% y/y; 11% ex-Voyant) The increase in SG&A is primarily driven by increased travel and events, including Gold Forum (held in person in 2022 vs. virtually in 2021)1Includesgeneral and operating expenses and professional feesNote: Percentage variance based on actual numbers, not rounded resultsFor general public use.13
Strong bottom line resultsAdjusted EBITDA and Adjusted EBITDA Margin (1Q21-1Q22)Adjusted Net Income (1Q21-1Q22) million and % 1Q222Q213Q214Q211Q221Q211Q22VPY 34.1 44.530.5%28.6%30.0%140 bpsReported net income( 8.9) 22.2NMAdjusted net income 22.2 28.829.8%Adjusted EPS1 0.30 0.3930.0%(dollars in millions, except per share data)Adjusted EBITDAAdjusted EBITDA g 1Q22 adjusted number of common shares outstanding, diluted of 73,675,000. In 1Q22, and moving forward, we use diluted GAAP shares outstanding given that our restricted stock awards fully vested in 2021.For general public use.14
Cash balance and generation continues to serve as a key positiveCash and credit facility as of 1Q22Annual cash generation1 (2019A-2022E) million million120.098.7 85-100100.092.280.047460.045.540.0375.0Cash and Cash Equivalents 1Calculated31.120.0Credit Facility0.02019A2020A2021A2022EAssetMark has 98.7 million of cash and cash equivalents on its balance sheet and 375 of available credit facility as of March 31, 2022Cash generation remains strong, as AssetMark expects to generate between 85 and 100 million of cash in 2022Priorities for cash use include M&A and investing in the businessas “Cash flows from operating activities” minus “Cash flows used in investing activities” plus “purchase price of M&A”For general public use.15
Refining 2022 outlook; Adjusted EBITDA and margin unchanged2022 Growth OutlookPlatform assetsRevenue less cost of revenueOperating expensesAdjusted EBITDACommentary8-10%1Q22 market impact net of fees was negative 4.8 million. Targeting netflows as 10% plus of beginning of period platform assets16-20%Good momentum from 2021; 2022 first quarter market volatility and Voyanttiming impacted 2022 revenue outlook by 22 million. Forecast spreadrevenue upside of 9 million due to 2022 rate increases.14-18%20% Disciplined expense growth will not outpace revenue growth. 9 million cutfrom 2022 forecastEBITDA outlook reflects overall strong 2021 momentum. Naturallydependent on the macro environment and US equity markets.Based on growth outlook above, we are targeting 2022 adj. EBITDA margin expansion of 100 bps.For general public use.16
AppendixFor general public use.17
Adjusted expense reconciliation1Q211Q22Adj. Expense VPY(dollars in millions)ExpenseAsset-based expensesTotal Adjustments Adjusted ExpenseExpenseTotal Adjustments Adjusted Expense 36.1- 36.1 41.7- 41.715.5%Spread-based expenses 0.7- 0.7 0.4- 0.4(40.0%)Employee compensation 67.3( 36.4) 31.0 40.3( 3.9) 36.417.5%SG&A1 21.7( 4.6) 17.2 27.8( 2.5) 25.347.5%Interest expense 0.8- 0.8 1.2- 1.250.3%Depreciation and amortization 9.5( 5.1) 4.4 7.5( 1.7) 5.731.6%Other income 0.0 0.0 0.0 0.1( 0.1) 0.0NM 136.0( 46.0) 90.0 118.9( 8.3) 110.722.9%Total1Includesgeneral and operating expenses and professional feesNote: Percentage variance based on actual numbers, not rounded results.For general public use.18
Adjusted net income walk(dollars in millions)1Q211Q22Revenue less cost of revenue 82.2 106.2 48.1 61.7Interest expense 0.8 1.2Depreciation and amortization* 4.4 5.7Other expense 0.0 0.0 29.0 37.6 6.8 8.823.5%23.5% 22.2 28.8Operating expenses*Adjusted Income before taxesProvision for income tax*Adjusted effective tax rateAdjusted net incomeNote: Asterisk denotes line item numbers post adjustment; numbers are rounded and totals may not sumFor general public use.19
For general public use. 2 Forward looking statements and non-GAAP financial measures Forward-Looking Statements Forward-looking statements include all statements that are not historical facts and can be identified by terms such as "will," "may," "could," "should," "believe," "expect," "estimate," "potential" or "continue," the negative of these terms and .