Transcription
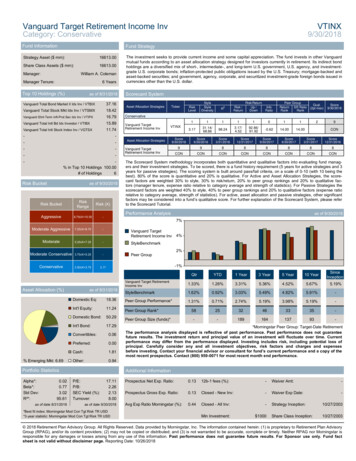
Vanguard Target Retirement Income InvVTINXCategory: Conservative9/30/2018Fund InformationFund StrategyStrategy Asset ( mm):16613.00Share Class Assets ( mm):16613.00Manager:William A. ColemanManager Tenure:6 YearsTop 10 Holdings (%)as of 8/31/201837.16Vanguard Total Bond Market II Idx Inv / VTBIXVanguard Total Stock Mkt Idx Inv / VTSMX18.42Vanguard Shrt-Term Infl-Prot Sec Idx Inv / VTIPX16.79Vanguard Total Intl Bd Idx Investor / VTIBX15.8911.74Vanguard Total Intl Stock Index Inv / VGTSX---------% in Top 10 Holdings 100.00# of Holdings6Risk Bucketas of 9/30/2018The investment seeks to provide current income and some capital appreciation. The fund invests in other Vanguardmutual funds according to an asset allocation strategy designed for investors currently in retirement. Its indirect bondholdings are a diversified mix of short-, intermediate-, and long-term U.S. government, U.S. agency, and investmentgrade U.S. corporate bonds; inflation-protected public obligations issued by the U.S. Treasury; mortgage-backed andasset-backed securities; and government, agency, corporate, and securitized investment-grade foreign bonds issued incurrencies other than the U.S. dollar.Scorecard SystemAsset Allocation StrategiesVanguard TargetRetirement Income InvR1113.1731.14/68.8698.242Risk/ReturnUp 4.00Risk /ReturnPeer GroupReturn SR RatioRankRankQual.(2pt ONCONThe Scorecard System methodology incorporates both quantitative and qualitative factors into evaluating fund managers and their investment strategies. To be scored, there is a fund history requirement (5 years for active strategies and 3years for passive strategies). The scoring system is built around pass/fail criteria, on a scale of 0-10 (with 10 being thebest). 80% of the score is quantitative and 20% is qualitative. For Active and Asset Allocation Strategies, the scorecard factors are weighted 30% to style, 30% to risk/return, 20% to peer group rankings and 20% to qualitative factors (manager tenure, expense ratio relative to category average and strength of statistics). For Passive Strategies thescorecard factors are weighted 40% to style, 40% to peer group rankings and 20% to qualitative factors (expense ratiorelative to category average, strength of statistics). For active, asset allocation and passive strategies, other significantfactors may be considered into a fund’s qualitative score. For further explanation of the Scorecard System, please referto the Scorecard Tutorial.Aggressive8.75 X 10.50-Moderate Aggressive7.25 X 8.75-Moderate5.25 X 7.25-StyleBenchmarkModerate Conservative3.75 X 5.25-Peer GroupConservative2.50 X 3.753.17Performance Analysisas of 9/30/20187%Vanguard TargetRetirement Income Inv4%2%Asset Allocation (%)-1%as of 8/31/2018Domestic Eq:18.36Int'l Equity:11.24Domestic Bond:50.29Int'l Other:0.94Portfolio Statisticsas of date 8/31/2018Score9/30/2018Vanguard TargetRetirement Income InvRisk (X)0.020.773.0295.61VTINXAsset Allocation StrategiesRiskRangeAlpha*:Beta*:Std isk Bucket% Emerging Mkt: 6.69TickerQtrYTD1 Year3 Year5 Year10 YearSinceInceptionVanguard Target RetirementIncome rk1.62%0.92%3.03%5.49%4.82%5.91%-Peer Group 63335---18916413793-Peer Group Rank*Peer Group Size (funds)**Morningstar Peer Group: Target-Date RetirementThe performance analysis displayed is reflective of past performance. Past performance does not guaranteefuture results. The investment return and principal value of an investment will fluctuate over time. Currentperformance may differ from the performance displayed. Investing includes risk, including potential loss ofprincipal. Carefully consider any and all investment objectives, risk factors and charges and expensesbefore investing. Contact your financial advisor or consultant for fund’s current performance and a copy of themost recent prospectus. Contact (800) 959-0071 for most recent month end performance.Additional InformationP/E:P/B:SEC Yield (%):Turnover:17.112.262.138.00as of date 9/30/2018*Best fit index: Morningstar Mod Con Tgt Risk TR USD*3-year statistic: Morningstar Mod Con Tgt Risk TR USDProspectus Net Exp. Ratio:0.1312b-1 fees (%):-Waiver Amt:-Prospectus Gross Exp. Ratio:0.13Closed - New Inv:-Waiver Exp Date:-Avg Exp Ratio Morningstar (%):0.44Closed - All Inv:-Strategy Inception:10/27/2003Min Investment: 1000Share Class Inception:10/27/2003 2018 Retirement Plan Advisory Group. All Rights Reserved. Data provided by Morningstar, Inc. The information contained herein: (1) is proprietary to Retirement Plan AdvisoryGroup (RPAG), and/or its content providers; (2) may not be copied or distributed; and (3) is not warranted to be accurate, complete or timely. Neither RPAG nor Morningstar isresponsible for any damages or losses arising from any use of this information. Past performance does not guarantee future results. For Sponsor use only. Fund factsheet is not valid without disclaimer page. Reporting Date: 10/26/2018
DisclosuresFund Fact SheetsPerformance data quoted represents past performance and does not guarantee future results. The investment return and principal value of an investment will fluctuate so that an investor's shares, whenredeemed, may be worth more or less than their original cost. Current Performance may be lower orhigher than the performance data quoted.The performance data quoted may not reflect the deduction of additional fees, if applicable. Additionalfees would reduce the performance quoted.Performance data is subject to change without prior notice.Performance of indexes reflects the unmanaged result for the market segment the selected stocks represent. Indexes are unmanaged and not available for direct investment.The information used in the analysis has been taken from sources deemed to be reliable, including, third-party providers such as Markov Processes International, Morningstar, firms who manage the investments, and/or the retirement plan providers who offer the funds.Every reasonable effort has been made to insure completeness and accuracy; however, the final accuracy of the numbers and information is the responsibility of the investment manager(s) of each fund and/or the retirement plan providers offering these funds. Discrepancies between the figures reported in thisanalysis, and those reported by the actual investment managers and/or retirement plan providers, maybe caused by a variety of factors, including: Inaccurate reporting by the manager/provider; Changes inreporting by the manager/provider from the time this report was prepared to a subsequent retro-activeaudit and corrected reporting; Differences in fees and share-classes impacting net investment return;and, Scriveners error by 401(k) Advisors preparing this report.Fund scores will change as the performance of the funds change and as certain factors measured in thequalitative category change (e.g., manager tenure). Fund scores are not expected to change dramatically from each measured period, however, there is no guarantee this will be the case. Scores willchange depending on the changes in the underlying pre-specified Scorecard factors.Neither past performance or statistics calculated using past performance are a guarantee of a fund’sfuture performance. Likewise, a fund’s score using 401(k) Advisor’s Scorecard SM System does not guarantee the future performance or style consistency of a fund.The purpose of this report is to assist fiduciaries in selecting and monitoring investment options. A fund’sscore is meant to be used by the plan sponsor and/or fiduciaries as a tool for selecting the most appropriate fund.Fund selection is at the discretion of the investment fiduciaries, which are either the plan sponsor or thecommittee appointed to perform that function.This report is provided solely for information purposes only and therefore not an offer to buy or sell asecurity. An offer to buy or sell a security may be made only after the client has received and read theappropriate prospectus.For a copy of the most recent prospectus, please contact your Investment Advisor/Consultant.This report is provided solely for informational purposes only and therefore not an offer to buy or sell asecurity.Contact Retirement Plan Advisory Group with any questions about this report or for the most currentmonth-end performance at (800) 959-0071.
DisclosuresFund Fact SheetsAsset Class DefinitionsLarge Cap Value (LCV)Category typically represents large capitalization companies who have lower prices in relation to theirearnings or book value.Large Cap Growth (LCG)Category typically represents large capitalization companies who have higher prices relative to theirearnings or book value, generally due to a higher forecasted or expected growth rate.Large Cap Blend (LCB)Category typically represents large capitalization companies who display both value and growth-likecharacteristics.Mid Cap Value (MCV)Category typically represents mid-capitalization companies who have lower prices in relation to theirearnings or book value.Mid Cap Growth (MCG)Category typically represents mid-capitalization companies who have higher prices relative to their earnings or book value, generally due to a higher forecasted or expected growth rate.Mid Cap Blend (MCB)Category typically represents mid-capitalization companies who display both value and growth-like characteristics.Small Cap Value (SCV)Category typically represents small capitalization companies who have lower prices in relation to theirearnings or book value.Small Cap Growth (SCG)Category typically represents small capitalization companies who have higher prices relative to theirearnings or book value, generally due to a higher forecasted or expected growth rate.Small Cap Blend (SCB)Category typically represents small capitalization companies who display both value and growth-likecharacteristics.International Equity (IE)Category typically represents primarily large capitalization foreign companies displaying both value andgrowth-like characteristics.Emerging Market Equity (EME)Category typically represents foreign companies in countries that are not considered to have fully developed markets or economies.Global Equity (GE)Category typically represents primarily large capitalization domestic and foreign companies displayingboth value and growth-like characteristics.
DisclosuresFund Fact SheetsAsset Class DefinitionsCore Fixed Income (CFI)Category typically represents domestic fixed income securities representing a broad array of fixed income securities including government, credit and mortgage backed securities.Global Fixed Income (GFI)Category typically represents a broad array of fixed income securities across many different countries.Intermediate Government (IG)Category typically represents domestic Government or Government-backed fixed income securities.U.S. Government TIPS (UGT)Category typically represents treasury inflation protected securities which are Government securitiesdesigned to offer inflation protection by adjusting the principal based on changes in the Consumer PriceIndex.High Yield (HY)Category typically represents below investment grade domestic fixed income securities, which have ahigher likelihood of default.REIT (RE)Category typically represents real estate securities traded on a stock exchange.Technology (TEC)Category typically represents a particular segment of the stock market focused on technology relatedcompanies.Natural Resources (NR)Category typically represents a particular segment of the stock market focused on natural resource related companies.HealthCare (HC)Category typically represents a particular segment of the stock market focused on healthcare relatedcompanies.Communication (COM)Category typically represents a particular segment of the stock market focused on communications related companies.Financial Services (FS)Category typically represents a particular segment of the stock market focused on financial servicescompanies.Utilities (UTI)Category typically represents a particular segment of the stock market focused on utility companies.
DisclosuresFund Fact SheetsConsider the investment objectives, risks, and charges and expenses of the investment company carefully before investing. The prospectus contains this and other information about theinvestment company. Please contact your advisor for the most recent prospectus. Prospectusshould be read carefully before investing.Investment Risks:International/Emerging Markets: The investor should note that funds that invest in international securitiesinvolve special additional risks. These risks include, but are not limited to, currency risk, political risk,and risk associated with varying accounting standards. Investing in emerging markets may accentuatethese risks.Sector Funds: The investor should note that funds that invest exclusively in one sector or industry involve additional risks. The lack of industry diversification subjects the investor to increased industryspecific risks.Non-Diversified Funds: The investor should note that funds that invest more of their assets in a singleissuer involve additional risks, including share price fluctuations, because of the increased concentrationof investments.Small-Cap Stocks: The investor should note that funds that invest in stocks of small cap companies involve additional risks. Smaller companies typically have a higher risk of failure, and are not as well established as larger blue-chip companies. Historically, smaller-company stocks have experienced agreater degree of market volatility than the overall market average.Mid-Cap Stocks: The investor should note that funds that invest in companies with market capitalizationbelow 10 billion involve additional risks. The securities of these companies may be more volatile andless liquid than the securities of larger companies.High-Yield Bonds: The investor should note that funds that invest in lower-rated debt securities(commonly referred to as junk bonds) involve additional risks because of the lower credit quality of thesecurities in the portfolio. The investor should be aware of the possible higher level of volatility , andincreased risk of default.Bond/Fixed Income Funds: The investor should note that funds that invest in bonds (fixed income securities), including government, corporate and mortgage-backed securities, involve additional risks. Interest rate risk may cause bonds to loose their value. The investor should be aware that it is possible in arising rate environment for investment grade bond strategies to loose value and experience negativereturns over certain time periods.Stable Value Funds: The investor should note that these funds invest in short to intermediate term securities that can and may loose value. These funds, while managed to protect principal, do not guarantee the investor’s principal, nor are they insured or guaranteed by the FDIC or any other governmentagency.Money Market Funds: The investor should note that these funds invest in short term securities that canand may loose value. These funds, while managed to protect principal, do not guarantee the investor’sprincipal, nor are they insured or guaranteed by the FDIC or any other government agency.Data provided by Morningstar, Inc. The information in this report is (1) proprietary to MPI, RetirementPlan Advisory Group, and/or its content providers; (2) may not be copied or redistributed; and (3) is notwarranted to be accurate, complete or timely.
VTINX 1 3.17 1 31.14/ 68.86 1 98.24 1 3.17/ 4.52 1 92.86/ 91.92 0-0.62 1 14.00 1 14.00 2 9 CON Asset Allocation Strategies Score 9/30/2018 Score 6/30/2018 Score 3/31/2018 Score 12/31/2017 Score 9/30/2017 Score 6/30/2017 Score 3/31/2017 Score 12/31/2016 Vanguard Target Retirement Income Inv 9 CON 9 CON 8 CON 8 CON 8 CON 8 CON 8 CON 8 CON DVRI .