Transcription
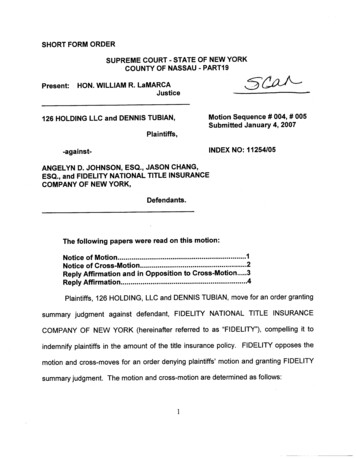
How to read your Fidelity statement for realized gains/losses and portfolioincome:We’ve included a sample statement to highlight the sections where you can viewrealized year-to-date gains/losses and portfolio income.This sample includes three different accounts. The Personal Retirement Account(page 19), is a traditional IRA and is a tax-deferred account. Thus its investmentgains and losses won’t impact the account holder’s income tax picture for 2016. TheJohn W. Doe of this sample statement, however, is 70 ½ or older, as requiredminimum distributions are estimated.We’ve highlighted the sections below to indicate where you can find theinformation you need to get a clear picture of the potential tax impacts from youraccount(s) year to date. On the sample statement, account information for eachseparate account appears on pages 6, 20, and 27. It is aggregated on page 3: The ‘Income Summary’ section provides a summary of income earned in thecurrent statement period and year to date. Under the ‘Realized Gains/Loss From Sales’ section, you will find a summaryof realized gains or loss information during the current statement periodand year to date. These figures exclude transactions where cost-basisinformation is incomplete. For Multiple Account Statements, the sections listed above still report thesame information, but are aggregated across all accounts in the portfolio onpage 3.
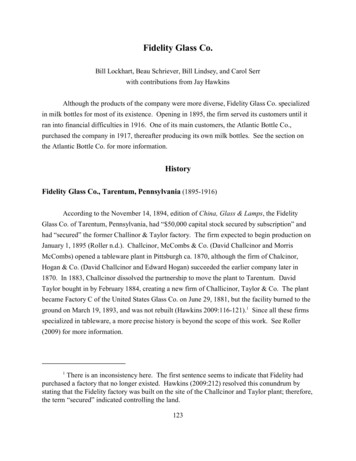
For illustrative purpose only - subject to changeABINVESTMENT REPORTJuly 1–July 31, 2015FINANCIALADVISORS123 Main Street, New York, NY 10001Envelope # 900043677John W. Doe100 Main St.Boston, MA 02201YOUR PORTFOLIO VALUE: 400,489.03PORTFOLIO CHANGE FROM LAST PERIOD: 25,202.50This Period 375,286.53AdditionsSubtractionsChange in Investment Value*Ending Portfolio Value**Accrued Interest (AI)YOUR ADVISORCONTACT YOUR ADVISORAB Financial AdvisorsAttn: John Advisor123 Main StreetNew York, NY 10001John AdvisorPhone: (888) 123-4567www.ABFinancial.comEnding Portfolio Value Incl. AIYear-to-Date 5,175.11 400,489.03 400,489.03582.57 401,071.60Appreciation or depreciation of your holdings due to price changes plus any distribution andincome earned during the statement period.** Excludes unpriced securities.*ZIf you added or removed an account to your statement-reporting household during thisperiod, the Beginning Portfolio Value and Change from Last Period are based off theaccounts that were in the statement household as of the end of the last period and thus maynot accurately reflect the updated statement household.ADVISOR MESSAGEIt is important that AB Financial Advisors and you touch base at least annually toreview any changes to your financial situation, investment objectives, risktolerance or investment restrictions on your managed account. Please contactJonathan Williams, CFP at AB Financial if you are interested in meeting or if therehave been any changes to your financial situation that may affect your investmentstrategy.Brokerage services provided by Fidelity Brokerage Services LLC,Member NYSE, SIPC (800) 544-6666. Brokerage accounts carried withNational Financial Services LLC, Member NYSE, SIPC.676588.2.01 of 33
For illustrative purpose only - subject to changeABINVESTMENT REPORTJuly 1–July 31, 2015FINANCIALADVISORS123 Main Street, New York, NY 10001PORTFOLIO SUMMARYACCOUNTS INCLUDED IN THIS REPORTNet Additions& Subtractions TChange inInvestment Value*PageAccount Type/NameAccountNumber5GENERAL INVESTMENTJohn W. Doe - Individual - TOD111-111111 120,173.95 13,838.9020PERSONAL RETIREMENTJohn W. Doe - Traditional ,604.73 375,286.53 13,838.90 11,363.60 400,489.0327TRUSTJohn W. Doe - Trust Under Agreement333-333333Separate Account Manager: ABC XYZ - Domestic Equity LG GrowthTotal PortfolioBeginning ValuezAccrued Interest (AI)Total Including AITIncludes transfers between Fidelity accounts.*Appreciation or depreciation of your holdings due to price changes plus any distribution and income earnedduring the statement period.If you added or removed an account to your statement-reporting household during this period, theBeginning Portfolio Value and Change from Last Period are based off the accounts that were in thestatement household as of the end of the last period and thus may not accurately reflect the updatedstatement household.z 1,458.33Ending Value 135,471.18142,413.12582.57 401,071.60PORTFOLIO MESSAGEOrehenie disit, etiam essed ut audandis quae nonsequis mi, comnisitisvoluptat verum eaquid moluptas et quis et plistis ipsam ut el imposti antio.Seque et omni menihit, quis as apeles quatur.2 of 33
For illustrative purpose only - subject to changeABINVESTMENT REPORTJuly 1–July 31, 2015FINANCIALADVISORS123 Main Street, New York, NY 10001PORTFOLIO SUMMARY(CONTINUED)INCOME SUMMARYREALIZED GAINS AND LOSSES FROM SALESThis rm Capital GainsLong-term Capital GainsTax-exemptDividendsInterestTax-deferredReturn of CapitalLiquidations 178.53178.53——— 372.10—372.10 500.31 4,000.00— 5,450.671,548.8110.25391.703,499.91 3,456.971,798.101,658.87 7,020.49 10,500.00Total 5,050.94 27,961.60 1,533.47(Realized gains and losses from non-retirement accounts only, may not reflect all gains andlosses due to incomplete cost basis)Net Short-term Gain/LossShort-term GainShort-term LossShort-term Disallowed LossNet Long-term Gain/LossLong-term GainLong-term LossLong-term Disallowed LossThis PeriodYear-to-Date———— 0.00—-13,992.1213,992.12- 682.58391.70-1,083.038.75 1,404.462,982.63-15,570.29 0.00 721.88Net Gain/Loss13,992.12TOP HOLDINGSDescriptionBARON GROWTH (BGRFX)PDR BARCLAYS (PNK)Value 89,139.31Percent 1276515,375.00SLM CORP SPI LKD NT (OSM)13,859.10ENSTAR GROUP LIMITED (ESGR)13,710.00NEW YORK NY CITY INDL DEV AGY REV10,744.20SPDR SER TR BARCLAYS CAP HIGH YIELD ETF (JNK) 10,165.00443APPLE INC (AAPL)DOUBLELINE TOTAL RET BD FD CL I (DBLTX)FIDELITY INSTL MMKT POT CL I (FMPXX)DELPHI CORP JR SB NTTotal 273,327.403369%3 of 33
For illustrative purpose only - subject to changeABINVESTMENT REPORTJuly 1–July 31, 2015FINANCIALADVISORS123 Main Street, New York, NY 10001PORTFOLIO SUMMARY(CONTINUED)ESTIMATED CASH FLOW(Rolling as of July 31, 2015)MonthAugust 2015SeptemberOctoberNovemberDecemberJanuary 2016FebruaryMarchAprilMayJuneJulyTotalBond & CD IncomeBond & CD PrincipalStock IncomeMutual Fund IncomeTotal Est.Cash Flow— �—————— 843193—843193—843193—843193— 444444444444444444444444 887976441,54097644887976441,54097644 4,265— 4,144 532 8,941The table above presents the estimated monthly interest and dividend income and return of principal that your current holdings may generate over the next rolling 12 months.The cash flows displayed are estimates provided for informational purposes only and there is no guarantee that you will actually receive any of the amounts displayed. Theseestimates should not be relied upon for making investment, trading or tax decisions. The estimates for fixed rate domestic bond and CD income are calculated using thesecurity's coupon rate. The estimates for domestic common stock and mutual fund income are calculated using an indicated annual dividend (IAD). The IAD is an estimate ofa security's dividend payments for the next 12 months calculated based on prior and/or declared dividends for that security. IADs are sourced from third party vendorsbelieved to be reliable, but no assurance can be made as to accuracy. There are circumstances in which these estimates will not be presented for a specific security you hold.Please refer to the Help/Glossary section of Fidelity.com for additional information on these calculations.Bond & CD Income includes interest payments for fixed rate bonds and Certificates of Deposit (CDs).Bond & CD Principal includes maturing principal payments for CDs and the following bonds: fixed rate, floating rate, variable rate, discount, and zero coupon.Stock Income includes estimated dividend payments for common stock, ADR's, and REITs.Mutual Fund Income includes estimated dividend payments for Fidelity and non-Fidelity mutual funds.The table above does not include cash flow from the following securities: preferred stocks, international stocks, exchange trade products (ETF's & ETN's), UITs, variablerate bonds, and international bonds, but may be included in future enhancements.— not available4 of 33
For illustrative purpose only - subject to changeABINVESTMENT REPORTJuly 1–July 31, 2015FINANCIALADVISORS123 Main Street, New York, NY 10001 135,471.18John W. Doe - Individual TODAccount 111-111111CORE ACCOUNT CASH FLOW 15,297.23This PeriodBeginning Account Value 120,173.95 108,247.39AdditionsDeposits 126,253.6955,000.00Change in Investment Value* 59,269.649,465.0049,804.64- 1 1,458.33Ending Account ValueAccrued Interest (AI) 135,471.18582.57Securities Transferred InSubtractionsWithdrawalsSecurities Transferred OutCards, Checking & Bill PaymentsTrans. Costs, Fees & ChargesTaxes WithheldEnding Account Value Incl. AI*Core Account: Fidelity NY Muni Money MarketYear-to-DateBeginning Core Account BalanceINVESTMENT ACTIVITYSecurities BoughtSecurities SoldDividends, Interest and Other IncomeDOther Activity71,253.69- 20.22 23,304.80Total Investment ActivityCASH MANAGEMENT ACTIVITYDepositsWithdrawalsTaxes WithheldChecking ActivityDebit Card ActivityBill PaymentsFees & ChargesMargin InterestTotal Cash Management Activity 135,471.18 136,053.75Appreciation or depreciation of your holdings due to price changes plus any distribution andincome earned during the statement period.Ending Core Account BalanceDThis PeriodYear-to-Date 27,716.36 ,987.3316,258.13594.101,641.58 8,328.23 81-6,345.05-44.37-1,673.75- ,358.77-14,958.62-325.69-19,670.87- 82,005.57 3,500.50 3,500.50Includes dividend reinvestments.Your Advisor is an independent organization and is not affiliated with Fidelity Investments.Brokerage services provided by Fidelity Brokerage Services LLC,Member NYSE, SIPC (800) 544-6666. Brokerage accounts carried withNational Financial Services LLC, Member NYSE, SIPC.5 of 33
For illustrative purpose only - subject to changeABINVESTMENT REPORTJuly 1–July 31, 2015FINANCIALADVISORS123 Main Street, New York, NY 10001ACCOUNT SUMMARYJohn W. Doe - Individual TODAccount 111-111111(CONTINUED)REALIZED GAINS AND LOSSES FROM SALESINCOME SUMMARYThis rm Capital GainsLong-term Capital GainsTax-exemptDividendsInterestReturn of CapitalLiquidations 178.53178.53——— 372.10—372.10 4,000.00— 71,658.87 8,500.00 1,533.47Total 4,550.63 16,258.13(May not reflect all gains and losses due to incomplete cost basis)Net Short-term Gain/LossShort-term GainShort-term LossShort-term Disallowed LossNet Long-term Gain/LossLong-term GainLong-term LossLong-term Disallowed LossNet Gain/LossThis 92.12 2.12 623.86—Your reported sales transactions include one or more sales of shares you acquired through an equitycompensation plan that are "disqualified dispositions" for U.S.federal income tax purposes, whichmay give rise to ordinary income instead of or in addition to capital gain or loss. This sale may causeyou to cease to qualify for favorable tax treatment of your grant. Consult your grant agreement andyour tax advisor for the rules applicable to your grant.TOP HOLDINGSValuePercent ofAccountENSTAR GROUP LIMITED (ESGR)APPLE INC (AAPL)DOUBLELINE TOTAL RETURN BOND (DBLTX)NEW YORK NY CITY INDL DEV AGY REVSPDR SER TR BARCLAYS CAP HGH YD (JNK) 888Total 59,113.4744%Description6 of 33
For illustrative purpose only - subject to changeABINVESTMENT REPORTJuly 1–July 31, 2015FINANCIALADVISORS123 Main Street, New York, NY 10001ACCOUNT SUMMARYJohn W. Doe - Individual TODAccount 111-111111(CONTINUED)ESTIMATED CASH FLOW(Rolling as of July 31, 2015)Bond & CD IncomeBond & CD PrincipalStock IncomeMutual Fund IncomeTotal Est.Cash FlowMayJuneJuly— �—————— 76193—76193—76193—76193— 444444444444444444444444 12065044120650441206504412065044Total 1,653— 1,075 532 3,259MonthAugust 2015SeptemberOctoberNovemberDecemberJanuary 2016FebruaryMarchAprilThe table above presents the estimated monthly interest and dividend income and return of principal that your current holdings may generate over the next rolling 12 months.The cash flow displayed are estimates provided for informational purposes only and there is no guarantee that you will actually receive any of the amounts displayed. Theseestimates should not be relied upon for making investment, trading or tax decisions. The estimates for fixed rate domestic bond and CD income are calculated using thesecurity's coupon rate. The estimates for domestic common stock and mutual fund income are calculated using an indicated annual dividend (IAD). The IAD is an estimate of asecurity's dividend payments for the next 12 months calculated based on prior and/or declared dividends for that security. IADs are sourced from third party vendors believedto be reliable, but no assurance can be made as to accuracy. There are circumstances in which these estimates will not be presented for a specific security you hold.Please refer to the Help/Glossary section of Fidelity.com for additional information on these calculations.Bond & CD Income includes interest payments for fixed rate bonds and Certificate of Deposit (CDs).Bond & CD Principal includes maturing principal payments for CDs and the following bonds: fixed rate, floating rate, variable rate, discount, and zero coupon.Stock Income includes estimated dividend payments for common stock, ADR's, and REITs.Mutual Fund Income includes estimated dividend payments for Fidelity and non-Fidelity mutual funds.The table above does not include cash flow from the following securities: preferred stocks, international stocks, exchange trade products (ETF's & ETN's), UITs, variablerate bonds, and international bonds, but may be included in future enhancements.— not available7 of 33
For illustrative purpose only - subject to changeABINVESTMENT REPORTJuly 1–July 31, 2015FINANCIALADVISORS123 Main Street, New York, NY 10001HOLDINGSJohn W. Doe - Individual TODAccount 111-111111CORE ACCOUNTDescriptionFIDELITY NY MUNI MONEY MARKET (FNYXX)QuantityPricePer UnitTotalMarket ValueTotalCost BasisUnrealizedGain/LossEst. AnnualIncome (EAI)Est. Yield(EY)3,500.500 1.000 3,500.50N/A———TotalCost BasisUnrealizedGain/LossEst. AnnualIncome (EAI)Est. Yield(EY) 3,824.61 531.72— 7-day yield: 0.010%Total Core Account (3% of account holdings) 3,500.50MUTUAL FUNDSDescriptionQuantityPricePer UnitTotalMarket Value1,015.328 11.190 11,361.525,025.810 1.000 5,025.81N/AN/A— 16,387.33 7,536.91 3,824.61 531.72TotalCost BasisUnrealizedGain/LossBOND FUNDSDOUBLELINE TOTAL RETURN BOND FD CL I(DBLTX) — 30-day yield: 4.83% 7,536.91c4.68%SHORT-TERM FUNDSFIDELITY INSTL MMKT PORT CL I (FMPXX)— 7-day yield: 0.01%Total Mutual Funds (12% of account holdings)EXCHANGE TRADED FUNDSQuantityPricePer UnitTotalMarket ValueSPDR SER TR BARCLAYS CAP HIGH YIELDBD ETF (SNK)250.00 40.66 10,165.00VANGUARD INTL EQUITY INDEX FDS MSCIEUROPE ETF (VJK)100.0042.974,297.005,000.00-703.00 14,462.00 15,000.00- 538.00DescriptionTotal Exchange Traded Funds (11% of account holdings) 10,000.00 c 165.00Continued on the next page 8 of 33
For illustrative purpose only - subject to changeABINVESTMENT REPORTJuly 1–July 31, 2015FINANCIALADVISORS123 Main Street, New York, NY 10001HOLDINGSJohn W. Doe - Individual TODAccount 111-111111(CONTINUED)STOCKSQuantityPricePer UnitTotalMarket ValueM APPLE INC (AAPL)25.00525.31 13,132.75M AMERCO COM (UHAL)30.00203.15ADescriptionTotalCost BasisUnrealizedGain/LossEst. AnnualIncome (EAI) 9,350.12 c 3,782.63 304.686,094.504,149.75 c1,944.75—13,710.0014,510.99 c-800.99—Est. Yield(EY)COMMON STOCKENSTAR GROUP LIMITED COM STK USD 1.00(ESGR)100.00137.10Total Common Stock (24% of account holdings) 32,937.25 28,010.86 4,926.39 304.682.32%PREFERRED STOCKBANK AMER CORP DEP SHS REPSTG 1/1200THPFD SER 5 (BMLPRL)150.00 20.230 3,034.50 2,470.16 564.34 l Preferred Stock (8% of account holdings) 10,787.40 9,365.56 1,421.84 770.51Total Stocks (32% of account holdings) 43,724.65 37,376.42 6,348.23 1,075.19M CITIGROUP INC DEP SH REP STG 1/100TH INTNON CUMULATIVE PFD SER F 8.50% (CPRM)ISIN: ityPricePer UnitTotal Market ValueAccrued Interest (AI)TotalCost BasisUnrealizedGain/LossEst. AnnualIncome (EAI)12/17/1310,000.00 100.00 10,000.00 51.25 10,250.00t- 250.00 125.00 10,000.00 10,250.00- 250.00 125.00CouponRateASSET BACKED SECURITIESFEDERAL NATL MTG ASSNCUSIP: 3136FPEX1Int. Semi-AnnuallyTotal Asset Backed Securities (7% of account holdings)1.25%Continued on the next page 9 of 33
For illustrative purpose only - subject to changeABINVESTMENT REPORTJuly 1–July 31, 2015FINANCIALADVISORS123 Main Street, New York, NY 10001HOLDINGSJohn W. Doe - Individual TODAccount 111-111111(CONTINUED)BONDSMaturityQuantityPricePer UnitTotal Market ValueAccrued Interest (AI)TotalCost BasisUnrealizedGain/LossEst. AnnualIncome (EAI)SABRATEK CORP NT CVCUSIP: 78571UAA6Int. Semi-Annually12/15/135,000.00 101.250 5,062.50 153.68 10,000.00t- 4,937.50 300.00CALPINE CORP ESCROW 4 131347BD7CUSIP: 131ESC9D9Fixed Coupon; Unrated; At 00.00-50.00125.00 15,012.50 20,000.00- 4,987.50 750.00 10,744.20 199.32 10,000.00B 744.20 500.00 10,744.20 10,000.00 744.20 500.00 5,000.00 10,000.00- 5,000.00 227.50 5,000.00 10,000.00- 5,000.00 227.50 9,900.00 10,000.00- 100.00— 9,900.00 10,000.00- 100.00— 50,656.70 60,250.00 9,593.30 1,652.50DescriptionCouponRateCORPORATE BONDSTotal Corporate Bonds (11% of account holdings)6.00%4.50MUNICIPAL BONDSNEW YORK N Y CITY INDL DEV AGY REV3/1/1410,000.000CUSIP: 64971PEN1Fixed Coupon; MBIA Insured; Moodys BAA1; S&P BBB; Int. Semi-Annually 107.442Total Municipal Bonds (8% of account holdings)5.000%OTHER BONDSTXU SR NT-PCUSIP: 873168AL2Fixed Coupon11/15/145,000.00 100.00Total Other Bonds (4% of account holdings)5.55%US TREASURY/AGENCY SECURITIESUNITED STATES TREAS BILLSCUSIP: 912796BL2Fixed Coupon11/21/13Total US Treasury/Agency Securities (7% of account holdings)Total Bonds (37% of account holdings)10,000.00 99.000.00%Continued on the next page 10 of 33
For illustrative purpose only - subject to changeABINVESTMENT REPORTJuly 1–July 31, 2015FINANCIALADVISORS123 Main Street, New York, NY 10001HOLDINGSJohn W. Doe - Individual TODAccount 111-111111(CONTINUED)OTHERDescriptionADI NET LEASE INC & GROWTH LP XIX UNITLTP PARTNERSHIP INT BASED ON MGMTSUNCONFIRMED EST OF NET ASSETSM VENTAS INC (VTR)Quantity5.000500.000PricePer Unit 291.000A10.57Total Other (5% of account holdings)Total HoldingsAccrued Interest (AI)UnrealizedGain/LossEst. AnnualIncome (EAI)unknownunknown—5,285.00unknownunknown— 6,740.00——— 135,471.18 120,163.33 41.54 3,259.41Est. Yield(EY) 582.57Total Including Accrued Interest (AI)A Investments such as direct participation program securities (e.g., partnerships, limited liabilitycompanies, and real estate investment trusts which are not listed on any exchange), commoditypools, private equity, private debt and hedge funds are generally illiquid investments and theircurrent values may be different from the purchase price. Unless otherwise indicated, the valuesshown in this statement for such investments have been provided by the management, administrator or sponsor of each program or a third-party vendor without independent verification by FidelityBrokerage Services (FBS) and represent their estimate of the value of the investor’s participationin the program, as of a date no greater than 18 months from the date of this statement. Therefore,the estimated values shown herein may not necessarily reflect actual market values or be realizedupon liquidation. If an estimated value is not provided, valuation information is not available.AI Accrued Interest Presented for domestic fixed income securities and represents interest accumulated since the last coupon date, but not yet paid by the issuer or received by NFS. AI is calculatedfor the following securities: fixed rate bonds and Certificates of Deposit (CDs). There is no guarantee that AI will be paid by the issuer. AI for treasury and GNMA securities, however, is backed bythe full faith and credit of the United States Government. AI totals represent accruals for only thosesecurities with listed AI in the Holdings section of this statement. Please refer to the Help/Glossarysection of Fidelity.com for additional information.TotalCost Basis 136,053.75EAI Estimated Annual Income (EAI) & Estimated Yield (EY) EAI is an estimate of annual income&for a specific security position over the next rolling 12 months. EY is calculated by dividing theEY current EAI for a security position by its statement closing date market value. EY reflects onlythe income generated by an investment; it does not reflect changes in its price, which mayfluctuate. For certain types of securities, EAI and EY could include the return of principal orcapital gains which would render them overstated. EAI and EY are estimates provided forinformational purposes only and should not be relied on for making investment, trading, or taxdecisions. There is no guarantee that your investments will actually generate the EAI or EYpresented. Actual income and yield might be lower or higher. EAI and EY should not beconfused with a security's 30-day Yield or 7-day Yield, if provided, as such yield quotationsreflect the actual historical performance of a security. For additional information, includingcalculation details, refer to the "Additional Information and Endnotes" section at the endof your statement.MPosition held in margin account. All other positions held in cash account.tThird party provided.—not availableB See Cost Basis Information and Endnotes for important information about the adjusted cost basisinformation provided.c Cost basis information (or proceeds from short sales) has been provided by you or a third party(such as a transferring broker) and has not been adjusted except as otherwise indicated.11 of 33
For illustrative purpose only - subject to changeABINVESTMENT REPORTJuly 1–July 31, 2015FINANCIALADVISORS123 Main Street, New York, NY 10001John W. Doe - Individual TODAccount 111-111111ACTIVITYSECURITIES BOUGHT & SOLDSettlementDateSecurity NameSymbol/CUSIPDescriptionQuantityPriceTotalCost BasisTransactionCost- 7.95Amount7/11SPDR SER TR BARCLAYS CAP HIGH YIELDBD ETFJNKYou boughtWash sale of 8/8/11: 2,805.50100 37.179007/11SPDR SER TR BARCLAYS CAP HIGH YIELDBD ETFJNKYou boughtWash sale of 8/8/11: 7,780.0410037.17900-7.95-3,725.857/11SABRA HEALTH CARE REIT INC COM USD0.01 SBRAYou bought20011.04000-7.95-2,215.957/11SPDR SER TR BARCLAYS CAP HIGH YIELDBD ETFJNKYou soldLT loss: 8,781.90LT disallowed loss: 8,781.90-20036.88200 6,000.00-7.957,368.457/11SPDR SER TR BARCLAYS CAP HIGH YIELDBD ETFJNK-50037.07180 15,500.00-7.957/11SABRA HEALTH CARE REIT INC COM USD0.01 SBRAYou soldLT loss: 5,210.22LT disallowed loss: 5,210.22You bought5011.03400-7.957/11SABRA HEALTH CARE REIT INC COM USD0.01 SBRAYou bought5011.03000-7.95-559.457/11SABRA HEALTH CARE REIT INC COM USD0.01 SBRAYou bought15011.05000-7.95-1,665.457/12SPDR SER TR BARCLAYS CAP HIGH YIELDBD ETFJNKYou boughtWash sale of 8/8/11: 2,070.585037.29900-7.95-1,872.907/18SPDR SER TR BARCLAYS CAP HIGH YIELDBD ETFJNKYou bought5038.27900-7.95-1,921.907/23MGM RESORTS INTERNATIONAL4.25000% 4/15/2015 SR CV NTTRADE EXECUTED BY MLCOYou boughtAccrued Interest: 347.445000109.00000-7.95-5,457.957/30FIDELITY INSTL MMKT PORT CL IYou bought10001.00000Total Securities BoughtFMPXX- 3,725.85-559.65-7.95-1,007.95- 95.40- 22,712.90Total Securities SoldNet Securities Bought & Sold 3,183.50Continued on the next page 12 of 33
For illustrative purpose only - subject to changeABINVESTMENT REPORTJuly 1–July 31, 2015FINANCIALADVISORS123 Main Street, New York, NY 10001ACTIVITY(CONTINUED)John W. Doe - Individual TODAccount 111-111111TRADES PENDING SETTLEMENTTradeDateSettlementDateSecurity NameSymbol/CUSIPDescriptionQuantityUnit PriceTotalCost BasisAmount7/308/2SPDR SER TR BARCLAYS CAP HIGH YIELD BDETFJNKYou bought100 37.179- 3,717.907/308/2SPDR SER TR BARCLAYS CAP HIGH YIELD BDETFJNKYou bought10037.179- 3,717.907/308/2SABRA HEALTH CARE REIT INC COM USD0.01SBRAYou bought20011.040-2,208.007/308/2SPDR SER TR BARCLAYS CAP HIGH YIELD BDETFJNK-20036.8827,376.40You soldLT loss: 5,210.22LT disallowed loss: 5,210.22Total Trades Pending Settlement- 2,267.40SECURITIES TRANSFERRED INSettlementDateSecurity Name7/31Z70-666580-17/31ENSTAR GROUP LIMITED COM STK USD ceTrans. from account 222-222222ESGRTrans. from account 222-222222Amount 39,508.64100.000 102.960Total Securities Transferred In10,296.00 49,804.64SECURITIES TRANSFERRED OUTSettlementDateSecurity Name7/31ENSTAR GROUP LIMITED COM STK USD 1.00Total Securities Transferred OutSymbol/CUSIPDescriptionESGRTrans. to account 222-222222QuantityPriceAmount- 5,000.00- 5,000.00Continued on the next page 13 of 33
For illustrative purpose only - subject to changeABINVESTMENT REPORTJuly 1–July 31, 2015FINANCIALADVISORS123 Main Street, New York, NY 10001ACTIVITYJohn W. Doe - Individual TODAccount 111-111111(CONTINUED)DIVIDENDS, INTEREST & OTHER INCOME(Including dividend reinvestments)SettlementDateSecurity NameSymbol/CUSIPDescription7/01DOUBLELINE TOTAL RETURN BOND FD CL IDBLTXDividend received7/04NEW YORK NY CITY INDL DEV AGY REV07133AEU2Muni exempt interest7/12STAR GAS PARTNERS LP SBISGUReturn of capitalQuantityPriceAmount 178.53372.104,000.00Total Dividends, Interest & Other Income 4,550.63OTHER ACTIVITYSettlementDateSecurity NameSymbol/CUSIPDescriptionQuantity7/30REFCO INC COMESCROW PAYMENT AT 0.148525 PER SHAREMER PAYOUT#REORCM0050704800000RFXMerger-40007/30REFCO INC COMESCROW PAYMENT AT 0.148525 PER SHAREMER FROM 758ESC982REORUM0050704800002RFXMerger4000Total Other ActivityPriceTotalCost BasisunknownTransactionCostAmount 594.100.00 594.10Continued on the next page 14 of 33
For illustrative purpose only - subject to changeABINVESTMENT REPORTJuly 1–July 31, 2015FINANCIALADVISORS123 Main Street, New York, NY 10001ACTIVITYJohn W. Doe - Individual TODAccount ionAmount7/1Wire transfer from bank 5,000.007/2Deposit received7/2Wire transfer from bank400.007/2Wire transfer from bank1,000.0015.007/2Wire transfer from bank1,500.007/29Wire transfer from bank 300.007/29Wire transfer from bank250.007/31Wire transfer from bank 9,465.00Total /2Wire transfer to bank- 3,000.007/2Wire transfer to bank-750.007/2Wire transfer to bank-25.00Wire transfer to bank- 1,000.007/297/29Electronic remit7/29Debit American Express-210.00Wire transfer to bank-500.00- 5,485.00Total WithdrawalsBILL PAYMENTSPayeePostDateABC Inc. P7/25AmountYTD Payments- 1,231.12- 2,455.86AAH Corp.7/25-504.78-3,605.16XYZ Mortgage Co. P7/27-4,609.15-8,897.60- 6,345.05- 14,958.62Total Bill PaymentsPCoderecurring paymentContinued on the next page 15 of 33
For illustrative purpose only - subject to changeABINVESTMENT REPORTJuly 1–July 31, 2015FINANCIALADVISORS123 Main Street, New York, NY 10001ACTIVITYJohn W. Doe - Individual TODAccount 111-111111(CONTINUED)DEBIT CARD SUMMARYBeginning BalanceCash Advances 0.00 507.00FeesTotal PurchasesVISA PLATINUM CHECK CARD (ACCOUNT .9999)Visa Platinum Rewards Ending Point Balance: 12RPTrans. DatePost DateLocation Reference/ DescriptionAmount7/17/4ATM0058 1224 JONES RD, HOUSTON, TX, 7425612ZF6JW2BKA 304.0086.587/117/15POS6600 TARGET T2066 W, HOUSTON, TX, 24251312ZF6JW2JQK 528.121,594.137/117/15STARBUCKS CORP00064139, SPRING, TX, 24161312ZF6JW2QJE 639.560.00 1,173.71Other Card ActivityTotal PaymentsDEBIT CARD ACTIVITYEnding Balance 0.00VISA Platinum Check Card (.9999) Subtotal 1,471.68RP Please refer to the Platinum Card Rewards Program Terms & Conditions for additional information about your Rewards Points, including information onexpiration. Rewards Points have no cash or dollar value. Ending point balance shown is the most current value available on the closing date of thisstatement. Please call 800-323-5353 for the most up to date balance information as amount may have changed.VISA GOLD CHECK CARD (ACCOUNT .8888)Trans. DatePost DateLocation Reference/ DescriptionAmount7/37/6ATM0213 1224 TOWN CEN, HOUSTON, TX, 9842312ZF6JW2ZAD 498.617/67/10BEST DONUTS, SPRING, TX, 5465542ASKD620ASD7/117/15MARSHALLS #0506, THE WOODLANDS, TX, 16510SKJF351321DDS 6.03-1,089.49VISA Gold Check Card (.8888) Subtotal 1,594.13Total Debit Card Activity 3,065.81Continued on the next page 16 of 33
For illustrative purpose only - subject to changeABINVESTMENT REPORTJuly 1–July 31, 2015FINANCIALADVISORS123 Main Street, New York, NY 10001ACTIVITYJohn W. Doe - Individual TODAccount 111-111111(CONTINUED)CHECKING ACTIVITYCheckNumberPayeePostDate1076ABC Inc.1542 N1548 NAmountCheckNumber7/30 430.721549DEF Corp.7/05 1,984.21MNO International7/23 /30Total Checking ActivityNAmount 17,165.00 24,432.10check number has been skipped.FEES & CHARGESDateDescriptionAmountDate7/1Advisor Fee 44.377/197/14ATM fee rebate2.25DescriptionAmount 2.25Baidu.com Inc Spon 44.37Total Fees & ChargesTAXES /11TRANSOCEAN LIMITED COM CHF15Foreign
Core Account: Fidelity NY Muni Money Market Your Advisor is an independent organization and is not affiliatedwith Fidelity Investments. CHANGE IN ACCOUNT VALUE Brokerage services provided by Fidelity Brokerage Services LLC, Member NYSE, SIPC (800) 544-6666. Brokerage accounts carried with National Financial Services LLC, Member NYSE, SIPC. This .