Transcription
ACCESS TO INSULIN:CURRENT CHALLENGESAND CONSTRAINTSUpdate March 201711ACCESS TO INSULIN FACT SHEET
ACCESS TO INSULIN:CURRENT CHALLENGESAND CONSTRAINTS12Update March 2017ACCESS TO INSULIN FACT SHEETDavid BeranGeneva University Hospitals and University of GenevaMargaret EwenHealth Action InternationalMolly LepeskaHealth Action InternationalRichard LaingBoston UniversityPublished byHealth Action InternationalOvertoom 60 (2) 1054 HK AmsterdamThe Netherlands 31 20 412 4523www.haiweb.orgDisclaimerThe ACCISS Study is supported by The LeonaM. and Harry B. Helmsley Charitable Trust and StichtingICF. The analysis included in this report is that of theauthors alone and does not necessarily reflect the viewsof the Helmsley Charitable Trust or Stichting ICF. All references and conclusions are intended for educational andinformative purposes and do not constitute an endorsement or recommendation from the Helmsley CharitableTrust and Stichting ICF.LicensingThis report is licensed under the Creative Commons Attribution-NonCommercial 4.0 International Licence. Youmay share and adapt this material if you give appropriatecredit, provide a link to the licence, and indicate if changes were made. You may not use the material for commercial purposes. To view a copy of this licence, /.
ContentsAcronyms . 3Executive Summary. 41. Background. 62. The Global Insulin Market . 62.1. Who Makes Insulin . 62.2. Which Insulin Products are Registered and Where . 82.3. Is Insulin on NEMLs? . 102.4. Use of Insulin in Type 2 Diabetes . 103. The Intellectual Property Landscape . 114. Insulin Trade . 135. The Price and Affordability of Insulin . 135.1.Management Sciences for Health data . 135.2. Government Procurement Prices .155.3. Patient Prices and Affordability . 195.4. Reimbursement Prices . 216. Taxes and Tariffs on Insulin . 237. Discussion and Possible Interventions . 238. References . 26Annex 1. List companies identified as insulin producers . 27Annex 2. List countries included in NEML analysis (year of NEML) . 29Annex 3. Registration of different insulin products by country. 31ISSUES PAPER UPDATE 2
AcronymsACCISSADFAFROAMROARVCanada DrugDatabaseCOMTRADEEli AOrange BookSEAROUMICUNRWAUSUKVATWHOWPROAddressing the Challenge and Constraints of Insulin Sources andSupplyAsthma Drug FacilityWHO Regional Office for AfricaWHO Regional Office for the AmericasAntiretroviralProduct Canadian Online Drug Product Database Online Query and itsPatent RegisterUnited Nations Commodity Trade StatisticsEli Lilly and CompanyWHO Regional Office for the Eastern MediterraneanWHO Regional Office for EuropeGulf Cooperation CouncilHealth Action InternationalHigh income countryHuman Immunodeficiency Virus / Acquired Immune DeficiencySyndromeLow income countryLower- and middle-income countriesManagement Sciences for HealthNon-communicable diseaseNational Essential Medicines ListNational Medicine Regulatory AgenciesUS Food and Drug Administration’s Orange BookWHO Regional Office for South-East AsiaUpper- middle income countryUnited National Relief and Works Agency for Palestine RefugeesUnited StatesUnited KingdomValue Added TaxWorld Health OrganizationWHO Regional Office for the Western PacificNote: All prices for insulin if not otherwise stated are standardised to 10ml of 100IU/mlinsulin in US dollars.ISSUES PAPER UPDATE 3
Executive SummaryThe Addressing the Challenge and Constraints of Insulin Sources and Supply (ACCISS) Studyhas completed its first phase of work, which aimed to gain an overall understanding of theinsulin market through different profiles. These included profiles on the insulin market,intellectual property, insulin trade, prices, and taxes and tariffs. The main lessons from thiswork are presented in this report. The full profiles are referenced and available on the HealthAction International websitea.From the insulin market profile 40 independent insulin manufacturers were identified in 17countries, however following additional discussions and reviews it would seem that there areprobably only 10 independent insulin manufacturers globally. A total of 55 countries had1,985 insulin products registered. Of these, 58 percent were human insulin, 38 percent wereanalogue insulin, three percent were animal insulin, and one percent was unknown. NovoNordisk had the highest number of registered products (719) followed by Eli Lilly andCompany (470) and Sanofi (369). Together, these companies represent 88 percent of totalproduct registrations globally. Only two countries did not list any insulin on their NationalEssential Medicines List. In looking at insulin use in people with type 2 diabetes, theliterature showed a range from 2.4 percent in Taiwan to 23.5 percent in the United States.Regarding intellectual property, no patents were found for human insulin. For analogueinsulins, 61 patents were found in the United States Food and Drug Administration’s OrangeBook and eight patents were listed in the Canadian Online Drug Product Database OnlineQuery and its Patent Register. For products already marketed in the United States andCanada, Eli Lilly and Company, Novo Nordisk, and Pfizer will have their patents expire by2023. Sanofi has an additional 10 years of protection for these products.The trade profile gives a unique insight into the overall insulin market. In looking at exportsbetween 2003 and 2013, 10 countries made up 98 percent to 99 percent of the global value ofretail insulin exports. Over this period, Denmark, France, and Germany collectively exportedbetween 85 percent to 96 percent of global retail insulin by value. Fifty percent of globalimports were to the United States, United Kingdom, Germany, and Japan. Around 60countries (mostly low- and middle income countries with no local insulin manufacturing)imported insulin from only one country for at least one year, making then vulnerable todisruptions in supply.Data from different sources were used to develop an overall understanding of the varyingprice of insulin. Data from Management Sciences for Health for 1996 to 2013 shows thatmedian supplier and buyer prices for human insulin were, on average, US 5.30 and US 4.31,respectively, for 10ml 100IU/ml of human insulin. A difference between the price of insulinversus other non-communicable disease medicines was seen when looking at the overallrange of prices for defined daily doses. Insulin had the smallest range over the period ofanalysis. Over the time period, all antiretrovirals and simvastatin were at one point higherpriced than insulin. At the end of the analysis only zidovudine remained higher priced thaninsulin. Looking at government procurement prices for 10ml 100IU/ml insulin, humaninsulin was more often procured and were lower priced (median US 5.99) than analogueinsulin (US 34.20). Procurement prices varied across countries e.g. regular/isophane(premixed) 30/70 insulin ranged from US 2.24 in Pakistan to US 32.00 in the Kyrgyzstan.Presentation of insulin also had an impact on price. Across the five insulin types with themost price points (aspart, glargine, isophane, regular, and premixed 30/70), vials (US 5.84)were lower priced than cartridges (US 17.93) and pens (US 27.31).ahttp://haiweb.org/what-we-do/acciss/ISSUES PAPER UPDATE 4
For insulin users, the median price in the public sector was US 7.64 for human insulin andUS 45.03 for analogue. A similar picture was seen in the private sector with analogue insulinhigher priced (US 39.35) than human insulin (US 16.65). Overall, insulins wereunaffordable for those on low incomes. Mean affordability in the public sector was 2.5 days’wages for human insulin, and 7.5 day’s wages for analogue insulin. In the private sector, itwas 3.5 and 9.5 days’ wages for human and analogues insulin, respectively. Reimbursementprice for human and analogue insulin was also high at US 19.14 and US 27.90, respectively.Different mark-ups along the supply chain, including tariffs and taxes, impact the final priceof insulin to individuals. The proportion of countries without tariffs on insulin has increasedsince 2004 from 52 percent to 77 percent. Global weighted average import tariffs havedecreased from slightly less than 3.5 percent (2004) to about 1.9 percent (2013). Value addedtax on insulin ranged from 0-24 percent.The profiles and other data within this report provide a unique addition to the informationpresented previously by the ACCISS Study. Although this data needs to be complemented byon-going work, it already highlights some areas of possible intervention. It also confirmsfrom different data perspectives the dominance of Eli Lilly and Company, Novo Nordisk, andSanofi with regards to the global insulin market. Although other insulin manufacturers havebeen identified based on data available, their size and market penetration seems to be low.Another factor that has again been highlighted by this work is the high price of insulin–bothfor governments when purchasing insulin and for insulin users when forced to pay out-ofpocket. The price of human insulin based on Management Sciences for Health data hasremained stable over time in comparison to other non-communicable disease medicines andthose used in the treatment of HIV/AIDS. Insulin affordability is poor in both the public andprivate sectors in many countries. Unlike for many other medicines, intellectual property isnot an issue for insulin itself.With the completion of this phase of its work, the ACCISS Study has further contributed to abetter understanding of the insulin market. And as it progresses into its final year, theinformation collected to date, as well as additional research, will assist in developinginterventions to address the challenge of access to insulin.“People with diabetes who depend on life-saving insulin pay the ultimate price whenaccess to affordable insulin is lacking.”Margaret Chan Director General of the World Health Organization (1)ISSUES PAPER UPDATE 5
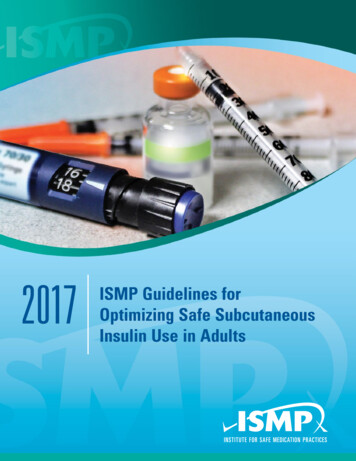
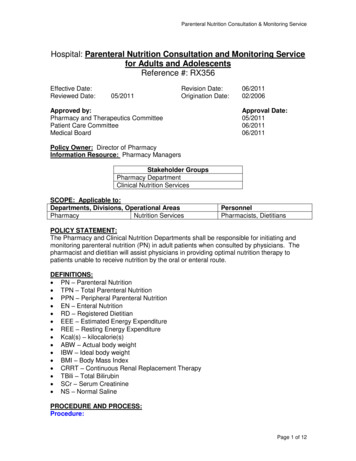
1. BackgroundInsulin for type 1 diabetes is a rare example where there is an absolute need for a givenmedicine. According to the International Diabetes Foundation, approximately 542,000children aged 0-14 have type 1 diabetes and the prevalence is increasing by three percent peryear.(2) Although global disease burden data is lacking and there are no statistics on the totalamount of people living with type 1 diabetes, it is estimated they represent five percent of thetotal diabetes burden, of 514 million, or 20.8 million people.(3) In contrast, use of insulin inthe management of type 2 diabetes is required for better control and its use is dependent oncapabilities existing within different health systems.Previous work by the Addressing the Challenge and Constraints of Insulin Sources andSupply (ACCISS) Study highlighted the poor availability and affordability of insulin.(4, 5) Thefactors leading to this included a variety of barriers at global and national level. Little isknown about why the price of insulin has remained consistently high over the years. It isthought, however, to be the result of market domination by three multi-national companies,Eli Lilly and Company (Eli Lilly), Novo Nordisk, and Sanofi.(6) This domination has alsomeant that individuals with diabetes have had to change types of insulin as these companieshave the ability to withdraw formulations from the market.(7, 8)The ACCISS Study has completed its first phase of work, which aimed to gain an overallunderstanding of the insulin market. This was achieved by profiling the insulin market,intellectual property issues, insulin trade, prices at different levels of the health system, andtariffs and taxes on insulin. Key findings from the profiles are presented in this report.2. The Global Insulin MarketThe aim of this research was to describe key aspects of the insulin market in order to betterunderstand the supply and demand of insulin globally. The Insulin Market Profile researchedand analysed data on the following topics, amongst others: identification of insulinmanufacturers; insulin formulations registered in different countries; of the inclusion ofinsulin in National Essential Medicines Lists (NEML); and two systematic reviews looking atthe use of insulin in type 2 diabetes.(9)2.1. Who Makes InsulinEach company’s role as manufacturer, licensed manufacturer, subsidiary, distributor, orother (e.g. no involvement in the insulin market) was determined from product listings, othersummary information, and references to insulin production on the company websites. Datawas collected from business market and industry reports, academic databases, and searchengines (such as Google ).In total, 40 independent insulin manufacturers were identified in 17 countries. (Figure 1)Twelve companies were located in China, four in Mexico and three in Bangladesh, Egypt,India and Russia. (Annex 1) During 2016, a number of the companies were found to bedistributors or not independent insulin manufacturers due to links with other companies (forexample through licensing agreements). Based on additional discussions and reviews itwould seem that there are probably only 10 independent insulin manufacturers globally.ISSUES PAPER UPDATE 6
Figure 1. Number of identified insulin manufacturers within each of 17 countries (country names EG3IN3ID1AR1ZA1ISSUES PAPER UPDATE 7
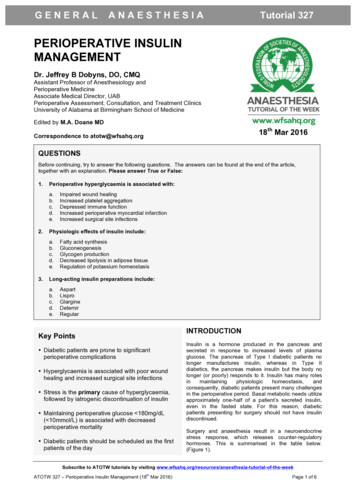
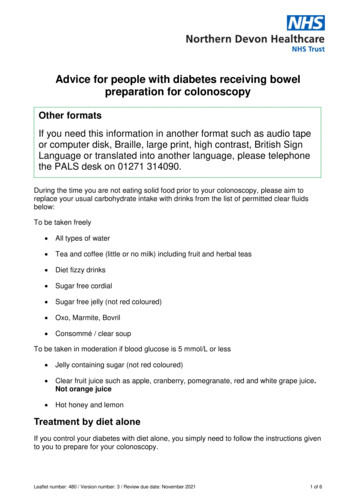
2.2. Which Insulin Products are Registered and Where?Using the list of National Medicine Regulatory Agencies (NMRA) websites available from theWorld Health Organization (WHO), each NMRA website was searched for information oncurrent marketing authorisations for insulin products (i.e. registration status). A total of 55countries had 1,988 insulin products registered. Of these, 58 percent were human insulin, 38percent were analogues, three percent were animal insulin and one percent were not stated.(Annex )On average, there were 36 products registered per country. Looking at numbers of registeredproducts per WHO region, on average the WHO Regional Office for Africa (AFRO) countriesand WHO Regional Office for the Americas (AMRO) countries had 28 products; WHORegional Office for the Eastern Mediterranean (EMRO) countries had 35, WHO RegionalOffice for Europe (EURO) countries 39, WHO Regional Office for the South-East Asia(SEARO) countries 29, and WHO Regional Office for the Western Pacific (WPRO) countries52. (Figure 2) Proportions of different insulin formulations also varied across country incomegroups. (Figure 3) The percentage of registered human insulin products decreased withincreasing national wealth based on World Bank income groups (68 percent in low- incomecountries (LICs); 62 percent: upper- middle income countries (UMICs) and 50 percent: highincome countries (HICs)). In contrast, the percentage registration of analogues increasedwith increasing national wealth (29 percent: LIC; 47 percent: UMICs, and 43 percent: HICs).Figure 2. Number of insulin products registered by type and WHO Region.Number of insulin products 00Human1000AFROAMROEMROEUROSEAROWPROWHO RegionISSUES PAPER UPDATE 8
Number of insulin products registeredFigure 3. Number of insulin products registered by type and World Bank country Human2000LICLIUMICUMICountry income groupHIHICIn looking at manufacturers, Novo Nordisk had the highest number of registered products(719), followed by Eli Lilly (470) and Sanofi (369). Together, these three companies represent88 percent of total product registrations. (Figure 4)ISSUES PAPER UPDATE 9
Figure 4. Percentage of registrations by company.Novo tUMI33%27%Wanbang Biopharmaceuticals17%MJ BiopharmaTonghua DongbaoLaboratorias PisaGan & Lee PharmaHI48%26%Incepta Pharma Ltd25%Popular Pharma LtdProbiomedVasceraAristopharma LtdTotal41%27%21%JulpharShreya Life SciencesUnited Laboratories Co Ltd0%20%40%60%80%100%In LICs and UMICs, Eli Lilly, Novo Nordisk, and Sanofi represented a combined total of 76percent and 77 percent of total products registered, respectively. Twelve other companies hadproducts registered in UMICs, and 14 in LICs. In HICs, 91 percent of registered insulinproducts were made by Eli Lilly, Novo Nordisk, and Sanofi, with only one other company(Wockhardt) having products registered in this income group.2.3. Is Insulin on NEMLs?Only human insulin is included on the WHO’s model EML. A total of 100 NEMLs wereidentified (using Ministry of Health/country contacts when most recent list not available onWHO website).(Annex ) Soluble insulin was listed by 98 countries and 97 countries listedintermediate-acting human insulin. Syria was excluded from the insulin analysis since it didnot specify any insulin type. Burundi and Djibouti from the WHO AFRO and EMRO regionswere the only two countries that did not list soluble insulin injection on their NEML. Acrossthe 100 countries, Bangladesh, from the WHO SEARO region, is the only country that doesnot list intermediate-acting human insulin. Of these countries, nine included a rapid-actinganalogue and 13 included a long-acting analogue on their NEML.2.4. Use of Insulin in Type 2 DiabetesAs noted by Holden et al. (10) in 1991 in the United Kingdom (UK) most insulin was used bypeople with type 1 diabetes. However, by 2010 type 2 diabetes represented about 90 percentof diabetes cases, and most insulin was being used by people with type 2 diabetes. To uncovermore about the use of insulin in people living with type 2 diabetes, PubMed was used toISSUES PAPER UPDATE 10
identify relevant literature including cross-sectional database studies, case series and cohortstudies containing outcome data for the period between 2000 and 2015.Use of these studies was challenging, as many were not specific between use of insulin inpeople with type 1 and type 2 diabetes. There were no clear trends in insulin consumptionlevels across the six WHO regions. While two publications regarding countries in the WPROregion showed low consumption levels (Malaysia 6.5 percent and Taiwan 2.4 percent), allother regions with more than one publication had large variations between studies. Forexample, in the United States (US), values ranged from 15.1 percent to 27.1 percent, andEuropean studies ranged from 6.9 percent in France to 40.5 percent in Italy. Countries in theSEARO region also exhibited a significant range of values, with a low of 2.8 percent inThailand to a high of 36.8 percent in Indonesia. Use of insulin specifically for type 2 diabeteswas found to range from 2.4 percent in Taiwan to 23.5 percent in the US.3. The Intellectual Property LandscapeTo investigate the insulin patent landscape in the Insulin Patent Profile, the US Food andDrug Administration’s Orange Book (Orange Book) and the Canadian Online Drug ProductDatabase Online Query and its Patent Register (Canada Drug Product Database) were used,searching the word “insulin”.(11,12) In identifying the companies who had patents for insulin,the search was extended to include the World Intellectual Property Organization PatentScopedatabase, the European Patent Office’s International Patent Documentation database, andvarious country-specific patent offices to give a more global view of the issue.In general, the search found no patents listed for human insulin. For analogue insulins, 61patents were found in the Orange Book and eight patents were listed in Canada Drug ProductDatabase.(13) The detail of these, by company, is given in Table 1.Table 1. US and Canadian patents on analogues by company.CompanyUS patentEli Lilly45Novo Nordisk13Pfizer0Sanofi3Canadian patent3212Data from the global databases show that most patents on insulin are filed in HICs andUMICs, with very few in low- and middle-income countries (LMICs).In looking at the expiry of patents, an analysis was done for insulin products alreadymarketed in the US and Canada (Figure 5). Three companies (Eli Lilly, Novo Nordisk, andPfizer) will have many of their patents expire by 2023. Sanofi has an additional 10 years ofpatent protection for their products. For products in development, Novo Nordisk and Sanofiboth have patents that will expire in the early 2030s, whereas Pfizer and Eli Lilly’s patentsexpire in 2023 and 2024, respectively. (Figure 6)ISSUES PAPER UPDATE 11
Figure 5. Cumulative percent of patent expiries of insulins marketed in the US and Canada bycompany.Figure 6. Cumulative percent of patent expiries of insulins under development and/or notmarketed in the US and Canada by company.This data shows that for insulin products already on the market, key patents on analogueinsulin have already expired. This was reinforced by the recent work of Luo and Kesselheim(14) and Beall et al. (15) in the US, which found that intellectual property cannot be seen as abarrier to entry for biosimilar manufacturers. In looking at patents in the US, Luo andKesselheim found 19 active patents on insulin in 2014, with 10 filed by Novo Nordisk, six bySanofi, and three by Eli Lilly. Of concern was that more than half of these patents were forinsulin delivery devices, rather than the insulin itself.ISSUES PAPER UPDATE 12
4.Insulin TradeTo create the Insulin Trade Profile, insulin imports and exports by value and volume wereanalysed by country from 2003-2013 using the United Nations Commodity Trade Statistics(COMTRADE) database. Insulin is a unique case for medicines, as a specific category existsto track global trade.In looking at exports over the time period 2003-2013, 10 countries made up 98 percent to 99percent of the global value of retail insulin exports. Denmark, France, and Germanycollectively exported between 85 percent to 96 percent of global retail insulin by value. In2013, Germany represented 46 percent of total insulin by value, Denmark 24 percent andFrance 15 percent. Brazil and Italy increased their exports over this time period, but theyremained low at 6.5 percent and 3.7 percent respectively in 2013.For imports, 20 countries made up 85 percent to 87 percent of the global value of retailinsulin imports from 2004-2013. Fifty percent of global imports were to the US, UK,Germany and Japan. Imports to UK, Germany and Japan remained constant from 20032013, but doubled over the same period in the US and increased in China and India as well.Based on this trade data, certain vulnerable countries were identified. Around 60 countries,mostly LMICs with no local insulin manufacturing, imported insulin from only one countryfor at least one year. This data also showed that only 17 percent of sub-Saharan Africancountries purchased insulin every year during the period 2004-2013. Worryingly, 29 percentof countries did not report buying insulin at all over this period.5. The Price and Affordability of InsulinTo create the Insulin Price Profile, different resources were used to gain as much informationas possible on the price of insulin at different levels of the health system. These sourcesincluded: Management Sciences for Health (MSH) data from 1996-2013 (from the onlineInternational Drug Price Indicator Guide); government procurement prices (from nationalmedicine procurement officers in 26 countries and two organisations: Gulf CooperationCouncil (GCC) and the United Nations Relief and Works Agency for Palestine Refugees(UNRWA); patient prices (via list serv requests, contacts and other informants from 43countries) and reimbursement prices (from publicly-accessible databases on national socialinsurance schemes from 28 countries).Procurement prices were adjusted, according to the INCO term, to cover costs to thenational central store. All prices were standardised to 10ml of 100IU/ml insulin in USdollars. Where more than one price was recorded for a product, the mean price was taken.Based on median patient prices, affordability was expressed as the number of days thelowest paid unskilled government worker would have to work to buy 10ml of insulin(approximately 30 days’ supply).5.1. Management Sciences for Health DataBetween 1996 and 2013, prices for 11 different suppliers were listed and purchaseswere made by 18 countries and the Organisation of Eastern Caribbean States. Boththe supplier list and the buyer list included four human insulins. Overall, the mediansupplier and buyer prices were US 5.30 and US 4.31, respectively. While in someyears the range in supplier and buyer prices was wide, median prices of each werefairly steady over the 17 years.Figure 7 presents this for buyer prices.ISSUES PAPER UPDATE 13
Figure 7. Range of adjusted buyer prices from 1996-2013 (in US ) for all types of insulinstandardised to a 10ml 100IU vial.Price per 10 ml 100 IU vial of insulinin 1996 USUS 20.00 18.00 16.00 14.00 12.00 10.00 8.00 6.00 4.00 2.00 0.00It is interesting to note that buyers in the WHO AFRO region, and those from LMICs, hadmedian prices above the overall median price for seven and eight years, respectively, asshown in Figure 8.Figure 8. Adjusted median buyer prices by World Bank Income Group from 1996-2013 (inUS ) for all types of insulin standardised to a 10ml 100IU vial.Price per 10 ml 100 IU vial of insulinin 1996 USUS 14 12 10Low Income 8Lower Middle Income 6Upper Middle IncomeHigh Income 4 0092010201120122013 0The buyer price for insulin in cartridges was about three times the price of insulin in vials.There was little difference in median buyer prices for the different types of human insulin.ISSUES PAPER UPDATE 14
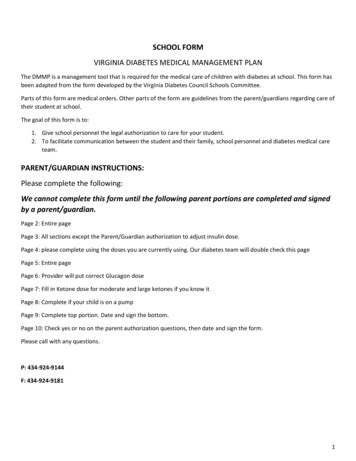
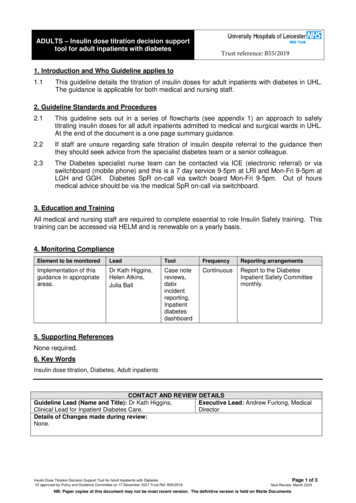
A difference between the price of insulin versus other non-communicable disease (NCD)medicines was seen when looking at the overall range of prices for defined daily doses.Insulin had the smallest range over the period of analysis as shown in Figure 9. This data ispresented using the median prices at logarithmic base 10 for easier presentation. Over thetime period, all antiretrovirals (ARV) and simvastatin were at one point higher priced thaninsulin, but by 2013 only zidovudine remained higher priced than insulin.Adjusted price per year of treatment log10Figure 9. Price ranges for defined daily doses for selected medicines (adjusted prices at Logbase 10).4.003.503.002.502.001.501.000.500.00-0.505.2. Government Procurement PricesHuman insulins were more often procured and lower priced (median US 5.99) thananalogues (US 34.20). UNRWA (US 2.92) and GCC prices (US 4.20) for human insulinwere lower than the median national prices. Procurement prices varied across countries e.g.regular/isophane (premixed) 30/70 insulin ranged from US 2.24 in Pakistan to US 32.00 inKyrgyzstan (Figure 10 shows government procurement price for insulin type). Presentationof insulin also had an impact on price. Across the five insulin types with the most price points(aspart, glargine, isophane, regular and premixed 30/70), vials (US 5.84) were lower pricedthan cartridges (US 17.93) and prefilled pens (US 27.31). Not all analogue insulinformulations are included in Figure 10.ISSUES PAPER UPDATE 15
IsophaneRegularHuman InsulinRegular/Isophane 30/70AspartAspart/Protamine Detemir30/70GlargineGlulisineAnalogue insulinISSUES PAPER UPDATE 16Lower Middle (1)High (2)Upper-Middle (1)High (1)Lower Middle (3)Upper-Middle (2)High (2)Lower Middle (2)High (1)Lower Middle (1)Upper-Middle (2)High (1)Lower Middle (1)Upper-Middle (2)High (2)Low (3)Low (2)Lower-Middle (10)Upper-Middle (5)High (1)Low (4)Lower Middle (11)Upper-Middle (7)High (3)Low (3)Lower Middle (10)Upper-Middle (6)High (2)Figure 10. Price ranges government procurement prices for insulin types by country income group, US (number of countries reporting). 90.00 80.00 70.00 60.00 50.00 40.00 30.00 20.00 10.00 -Lispro
According to the data, significant savings would result in some countries if they onlypurchased human insulin e.g. Iran would save US 49 million (Table 2). An analysis ofgovernment procurements in Iran, Dominican Republic, Moldova, and Kyrgyzstan showedanalogue insulin made up only 27 percent, three percent, nine percent and six percentrespectively of their insulin purchases by volume, but represented 75 percent, seven percent,38 percent and 34 percent, respectively, of value.ISSUES PAPER UPDATE 17
Table 2. Expenditure and potential savings on insulin purchases in four countries.4 235 000US 18 479 8461 569 000US 56 029 0085 804 000US 74 508 85427%75%US 4.36US 25 305 440US 49 203 414DominicanRepublic200 400US 495 4055 200US 35 786205 600US 531 1913%7%US 2.47US 507 832US 23 35966.0%4.4%IranVolumeVal
median supplier and buyer prices for human insulin were, on average, US 5.30 and US 4.31, respectively, for 10ml 100IU/ml of human insulin. A difference between the price of insulin versus other non-communicable disease medicines was seen when looking at the overall range of prices for defined daily doses.