Transcription
Proceeding of the UJNR 5th Earthquake Research Panel Meeting, 20041Low-frequency tremor and slow slip around the probable source region of the Tokai Earthquake– A new indicator for the Tokai Earthquake prediction providedby unified seismic networks in Japan –Noriko Kamaya (Seismological and Volcanological Department, JMA),Akio Katsumata (Meteorological College, JMA)andYuzo Ishigaki ( Seismological and Volcanological Department, JMA)AbstractEnhancement of seismic networks in the Japan Islands of these years revealed occurrence of deeplow-frequency continuous tremors of a belt distribution in the southwest Japan, where the subductingPhilippine Sea plate reaches depths of 25–40 km. The source region of the tremor is assumed tocorrespond to boundary region between oceanic and island crusts close to mantle wedge. The eastend of the belt tremor distribution is adjacent to the probable source region of the Tokai Earthquake.A slow-slip event has continued in the west of the source region of the Tokai Earthquake since 2000.Synchronous activation of the tremor and slow-slip speed was observed in 2003. This suggests somerelationship between the slow-slip and the tremor activity. We expect that the tremor activity couldbe a new valuable indicator for the Tokai Earthquake prediction. The long duration of the tremorindicates existence of fluid relating to its generation. The most probable fluid is considered to be waterproduced by dehydration of chlorite and formation of clinopyroxene in the oceanic crust on the basisof data from high pressure and temperature experiments. The northern border of the belt distributionis possibly rimmed by the edge of the mantle wedge because serpentine formation absorbs fluid water.1IntroductionSince Oct. 1997, short-period seismic records obtained at most of stations in the Japan Islandshave been transmitted to the Japan Meteorological Agency (JMA). The JMA has processed thoserecords to make a comprehensive seismic catalogin Japan. The short-period instruments includethose installed by universities, the National Research Institute for Earth Science and DisasterPrevention (NIED), the JMA, other national institutes, and local governments. This integratedprocessing lowered the detectable magnitude ofearthquakes. Moreover, deployment of the Hi-net[e.g., Okada et al., 2000], which is a dense network of highly sensitive short-period instrumentsinstalled by the NIED, improved the detectivityremarkably. Hi-net data has been included to produce the seismic catalog since Oct. 2000.Fig. 1 shows stations which contribute the current unified seismic catalog. Seven cable-typeocean-bottom seismometry systems are includedin the network.Fig. 2 shows magnitude-time distribution since1965. The magnitudes are determined from maximum displacement or velocity amplitudes [Tsuboi, 1954; Katsumata, 2004; Funasaki et al., 2004]. Itis recognized that the lowermost magnitude hascontinued to decrease year by year since 1970s.More than 130,000 hypocenters are located in andaround the Japanese Islands in 2003. Fig. 3 showsnumbers of hypocenter determinations in a year inthe JMA (1926–Sep. 1997) and the unified (Oct.1997–) seismic catalogs. A level of one thousand ayear had continued until mid of 1970s. Since then,introductions of high-sensitive seismometers, automated digital processing systems and denselydistributed seismic networks have increased thenumber of located hypocenters.The enhanced detection ability revealed occurrence of low-frequency microearthquakes atdepths of 20–40km in the Japan Islands. TheJMA has distinguished those deep low-frequencyearthquakes in the seismic catalog since Oct.1999. The deep low-frequency earthquakes are indicated by red symbols in Fig. 2. Magnitude ofmost of those events are less than magnitude 2.0,and many of those are less magnitude 1.0. Occur-
2Proceeding of the UJNR 5th Earthquake Research Panel Meeting, 200445 N40 N35 N30 N25 N0125 E130 E500135 E1 0 0 0 km140 E145 EFigure 1: Stations which contribute the current unified seismic catalog.JMAN I EDUn i v e r s i t i e sGS JJAMS TECOt he r s
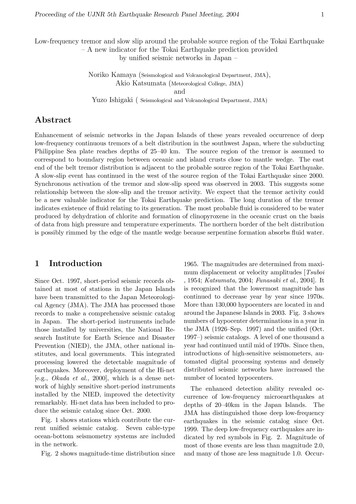
Proceeding of the UJNR 5th Earthquake Research Panel Meeting, 2004rence of low-frequency events around the Mohodiscontinuity in the areas away from volcanoesbecame recognized based on the seismic catalog[Nishide et al., 2000]. Although seismicity of lowfrequency events beneath volcanoes has been wellknown [e.g., Hasegawa et al., 1991; Hasegawa andYamamoto, 1994; Ukawa and Obara, 1993], seismic activities away from volcanic areas had notbeen noticed.Nishide et al. (2000) recognized low-frequencyseismic activities in the east of Aichi Prefecture(34.8 35.3 N, 137 138 E. See Fig. 8),which was recognized as a part of belt distributionof deep low-frequency tremor along the strike ofthe subducting Philippine Sea plate [Obara, 2002;Katsumata and Kamaya, 2003] after deploymentof the Hi-net.work. We describe the activity of the deep tremor,and discuss its source characteristics in this article. In addition to the deep tremor, low-frequencyearthquakes around the Moho discontinuity werefound not only in volcanic regions but also innon-volcanic areas. We use a term of deep lowfrequency earthquake (LFE in this article) to describe such activities.2N umb e r o f E a r t h q u a k e sThe deep low-frequency tremor (LFT in this article) is the most notable phenomena which wasfound by the recently deployed dense seismic net1061051041031021011001930 1940 1950 1960 1970 1980 1990 2000Ye a rFigure 3: Number of earthquakes listed in the JMA(1926–Sep. 1997) and the unified (Oct. 1997–) seismiccatalogs.Seismicity of DeepFrequencyTremorsEarthquakesLowandIn this section, we describe spacial and temporalcharacteristics of the LFT in the southwest Japan.Activities of LFE in volcanic and non-volcanic regions are also explained.2.1Figure 2: Magnitude-time distribution since 1965in the JMA and the unified seismic catalogs. Redsmall circles denote the events labeled as the deep lowfrequency earthquakes.3Source Locations of Deep LowFrequency Tremors in the Southwest JapanThe JMA estimates the source locations of LFTby an ordinary hypocenter determination methodbased on the onset times of enlarging parts ofthe tremors. This is different from the method ofObara (2002) who estimated the locations of LFTby applying S-wave velocity model to envelopesof tremor waveforms. Fig. 4 shows examples ofthe observed tremor waveforms. Broken curves inthe figure denote calculated arrival times basedon locations estimated by the JMA. Onsets of thetremor are close to the calculated S travel times.Corresponding onsets of P-waves are seldom seeneven on the vertical component. Lack of P-wavearrival data makes accuracy of source depths poor.Although most of LFT do not show onsets of Pwave, a small number of LFT segments do showonsets of P-wave. Depth of those events are ratherprecise. Fig. 5 shows an epicenter map and a crosssection of the deep low-frequency events with relatively small estimation errors in the southwestJapan. In the figure, orange circles show eventsoccurring within 10 km (epicentral distance) fromthe centers of volcanoes which have been active inthe Quaternary [Committee for Catalog of Quaternary Volcanoes in Japan, 1999], and blue circlesshow events away from volcanoes. The estimateddepths of the most of non-volcanic events were distributed from 25 to 40 km. and the average depthis about 30 km.
4Proceeding of the UJNR 5th Earthquake Research Panel Meeting, 2004T i me08 :40 :00008 :40 :30N/S08 :41 :000 8 : 4 1 : 3 0 ( JST )Ep i c e n t r a l D i s t a n c e ( km)NU . S TN10ND . TOE20ND . MSKYASUOKLG . HRNND . KSH30ND . ACHND . TNRTAK I SAND . SMY40ND . KGWND . HTN50PS PSPSFigure 4: Example of LFT observed on June 3, 2001. Waveforms are arranged in epicentral distance orderfrom an estimated source location. Broken lines show calculated P and S travel times for enlarging parts of thetremor. Station code are denoted on the right side. ND, NU, and LG signify the NIED, Nagoya University, andlocal government, respectively. YASUOK and TAKASA are stations of the JMA.Fig. 6 show source locations of LFT (blue circles) from September, 1999 to September, 2001beneath eastern Shikoku (133.6 – 134.5 E) projected onto the vertical structural cross-sectionfrom Kurashimo et al. (2002), which is based onseismic velocities. The LFT are located in boundary region between oceanic and island crusts closeto the mantle wedge. It is notable that theLFT are not distributed boundary regions between oceanic crust and mantle wedge.2.2Temporal Characteristics of theDeep Low-Frequency Tremor ActivitiesFig. 7 (b) shows time-space distribution of LFT.Most event show episodic activity. Active periodcontinues for several hours – several days.Fig. 7 (c) and (d) show accumulated numbersof events and quiescent periods of the tremor activities in partitioned areas shown in (b). Thequiescent period in the figure is defined as a timeinterval without any detected tremor events morethan two days.It is recognized from Fig. 7 (b) and (c) that thetremor activities are not stationary. Accumulatednumbers and quiescent periods changes with sometrends.In the region (2) (Fig. 7 (b)), shortening ofquiescent periods started late in 2002. Short qui-escent periods have been kept for about half yearfrom the 4th quarter of 2003 to the 1st quarter of2004. Then quiescent periods were prolonged in2004, but they are still short compared with theaverage in 2002. The period of 2003–2004 corresponds to periods of relatively fast slow-slip inTokai area, which is discussed in a latter section.In the region (4), short quiescent periods havebeen kept since middle of 2004. It seems thatthere has been some activity in the region.In the regions (8), (9) and (10), shortening ofquiescent periods appear relatively regularly. Ittakes about a few months from starting of shortening to returning to regular quiescent period ofabout several tens of days.In the regions (11) and (12), state of shortquiescent periods was kept for a few months in2003. The shortening started from the beginningof 2003, and prolonging had continued until beginning of 2004. Slow-slip events were observed inthe period by Hirose and Obara (2003) in the region. The graph of accumulated number of eventsalso show a unusual rate in the period.The activity of LFT should indicate some stateof plate coupling. But its mechanism is to be investigated.
5Proceeding of the UJNR 5th Earthquake Research Panel Meeting, 2004(a)(b)1999 / 09 / 01 - 2004 / 08 / 23E1234536 N6789101105 0 1 0 0 km12W132 E2000(c)11122231Qu i e s c e n t P e r i o d ( d a y )3387A c c umu l a t e d N umb e 45678910111220002004Figure 7: Temporal variation of the deep low-frequency tremor activities. (a) Epicenter map; (b) time-spacedistribution; (c) accumulated number; (d) quiescent period. Accumulated number of events and quiescent periodare shown for regions of which numbers are denoted on the right of (b).
Proceeding of the UJNR 5th Earthquake Research Panel Meeting, 200461999 / 01 / 01 - 2004 / 08 / 23HonshuShikokuKiiChan.KiiBPenin.A 6TQWIJKyushu0CPMCK30 N02 0 0 km135 E01020Figure 6: Source locations of LFT (blue circles) from304050( km )Figure 5: Distribution of LFT and LFE in the southwest Japan (Jan. 1999 – Aug. 2004). Blue circles,orange ones and red triangles show source locations ofnon-volcanic LFE and LFT, LFE close to volcanoes,and active volcanoes in the Quaternary, respectively.The line segments A and B indicate Tonankai andNankaido profiles for which Hyndman et al. (1995)estimated geotherms, respectively.2.3Deep Low-Frequency Earthquakesin the Northeast JapanDeep low-frequency earthquakes have been foundin wide area in the Japan Islands [Kamaya andKatsumata, 2004]. Fig. 8 shows epicenters of theLFE. Orange circles show LFE occurring within10 km (epicentral distance) from the centers ofvolcanoes which have been active in the Quaternary [Committee for Catalog of Quaternary Volcanoes in Japan, 1999], and blue circles show LFEaway from volcanoes which include LFT. The estimated depths of the most of non-volcanic eventswere distributed from 25 to 40 km, and the average depth is about 30 km. Active volcanoes andthe Quaternary volcanoes are shown by red triangles. In the figure, contours show the tops ofthe Pacific and the Philippine Sea plates whichwere estimated as upper limits of seismicity in theplate.LFE in the northeast Japan are distributed onlyin the back-arc side of the volcanic front which isalmost coincides with a 110 km depth contour ofthe Pacific plate. There is no activities in thefore-arc side of the volcanic front. The distribution indicates the LFE in the northeast Japan areSeptember, 1999 to September, 2001 beneath easternShikoku (133.6 – 134.5 E) projected onto the verticalstructural cross-section from Kurashimo et al. (2002),which is based on seismic velocities. The horizontalaxis represents the distance from shot J2 of Kurashimo,et al. (2002) which was located near the south coastof Shikoku Island. Black dots denote ordinary earthquakes.related to volcanic activity even in the cases awayfrom volcanoes. If we include regions with igneousrocks in the Tertiaries, all LFE-active regions inthe northwest Japan are covered.2.4Deep Low-Frequency Earthquakesin the Southwest JapanIn addition to deep low-frequency tremor activities, there are some spot distributions of LFE inthe southwest Japan (gray-filled circles in Fig. 7(a)). Some of those clusters are distributed alongthe volcanic front of the Philippine Sea plate. Butsome clusters are distributed in fore-arc side of thevolcanic front (clusters in 133 –136 E and 35.1 –35.7 N).Fig. 9 (a) and (d) show waveform and spectrum of a horizontal (NS) component from a lowfrequency earthquake obtained at a station inTannan (DP.TNJ, 35.0313 N, 135.2137 E) for anevent which occurred in Kyoto Pref. (hypocenter:35.1185 N, 135.5775 E, 34.7km) at 01:41:41.1,July 30 2000 JST. Waveforms of events in thisregion usually show a clear onsets and long duration. This is similar to waveforms of LFE involcanic regions.The bold spectrum curve corresponds to the 30swaveform segment indicated by the bold line inthe waveform. The thin spectrum curve corresponds to the noise level as calculated for the 30s
7Proceeding of the UJNR 5th Earthquake Research Panel Meeting, 20041999 / 01 / 01 - 2004 / 08 / 2345 N2502 0105 010050,CRCP 6TGPEJ40 N25030043 002035 N606400203020KMCPC0QWIT6 J0130 E135 E5 0 0 km140 E145 EFigure 8: Distribution of epicenters of low-frequency events near the Mohorovicic discontinuity under theJapan Islands as determined by the Japan Meteorological Agency (JMA) from September, 1999 to August 23,2004. Orange circles show events within 10km of active volcanoes and volcanoes which have been active in theQuaternary [Committee for catalog of Quaternary volcanoes in Japan, 1999], and blue circles show events awayfrom those volcanoes. Active volcanoes and the Quaternary volcanoes are shown by red triangles. Also shownare parts of depth contours for the upper surfaces of the Pacific Plate and the Philippine Sea Plate. The contoursare labeled with depth in km.
8Proceeding of the UJNR 5th Earthquake Research Panel Meeting, 2004(a)2 0 0 0 / 0 7 / 3 0 0 1 : 4 1 H : 3 4 kmMI D KYOTO PREFDP . TN J NS DLT 3 4 . 1 km2.80s㨰㩖m /P- 30- 20- 100S10203040(s)(b)2 0 0 1 / 0 6 / 0 3 0 8 : 4 0 H : 3 2 kmNU . S TN NS DLT NE A I CH I PREF4 . 6 km580 . 30nm / sP- 30- 20- 10S100203040(s)203040(s)(c)1 9 9 9 / 1 0 / 1 0 1 3 : 4 6 H : 3 0 kmNORTHERN AK I TA PREFTU . G JM NS DLT 2 1 . 6 km1.5Ǵm /0sP- 30- 20- 10(e)(d)2 0 0 1 / 0 6 / 0 3 0 8 : 4 0 H : 3 2 kmNU . S TN NS DLT 10-810-910S p e c t r a l Amp l i t u d e2 0 0 0 / 0 7 / 3 0 0 1 : 4 1 H : 3 4 km MI D KYOTO PREFDP . TN J NS DLT 3 4 . 1 kmS p e c t r a l Amp l i t u d eS100-1100101F r e q u e n c y ( Hz )10210-810-910NE A I CH I PREF4 . 6 km- 1010-1100101F r e q u e n c y ( Hz )102(f)S p e c t r a l Amp l i t u d e1 9 9 9 / 1 0 / 1 0 1 3 : 4 6 H : 3 0 km NORTHERN AK I TA PREFTU . G JM NS DLT 2 1 . 6 km10 -710-810-910-1100101F r e q u e n c y ( Hz )102Figure 9: Spectra of deep low-frequency events in the Japan Islands. a) and d) A waveform and its spectrum ofhorizontal (NS) component from a low-frequency earthquake obtained at a station in Tannan (DP.TNJ, 35.0313N,135.2137E) for an event which occurred in Kyoto Pref. at 01:41:41.1, July 30 2000. The bold spectrum curvecorresponds to the 30s waveform segment indicated by the bold line in the waveform. The thin spectrum curvecorresponds to the noise level as calculated for the 30s waveform segment indicated by the thin line in thewaveform. H and DLT denote the focal depth and epicentral distance. b), c), e) and f) show waveforms andspectra for a low-frequency tremor in southwestern Japan and a low-frequency earthquake away from volcanoesin northeastern Japan, respectively. The records were obtained at Shin-Toyone (NU.STN, 35.1355N, 137.7437E)and Gojome (TU.GJM, 39.9520N, 140.1160E).
Proceeding of the UJNR 5th Earthquake Research Panel Meeting, 2004waveform segment indicated by the thin line in thewaveform. The seismic wave from the event haspower in the frequency rage of 1–10 Hz. (b), (c),(e) and (f) in Fig. 9 show waveforms and spectrafor a low-frequency tremor in southwestern Japanand a low-frequency earthquake away from volcanoes in northeastern Japan, respectively. Thespectra of these events do not show no effectivespectral contents in a frequency range lower than1 Hz. It is interesting that the deep tremor andLFE has common characteristics in spectrum.3Tokai Slow-SlipTremorand9tremor activity. We consider that the deep tremoractivity would be a indicator of some status of thecoupling between the plates.theFigure 11: Vertical component of crustal deformationdue to the Tokai slow-slip observed by the GEONET,GPS Earth Observation Network of the GeographicalSurvey Institute.SurugaTroughA great earthquake is expected to occur alongthe Suruga Trough where the Philippine Sea platesubducts beneath the Eurasian plate. The earthquake is named Tokai Earthquake prior to its occurrence. Fig. 10 shows the probable source region of the Tokai Earthquake.Probable Source Region ofthe Tokai EarthquakeFigure 12: Temporal variation of location of theHamakita GEONET station.Figure 10: Probable source region of the Tokai Earthquake and epicenters of deep low-frequency events.In the west of the probable source area, slowslip events has been observed since 2000. Fig.11 shows the vertical displacement measured byGEONET, GPS Earth Observation Network ofthe Geographical Survey Institute of Japan. Fig.12 shows temporal variation of crustal deformation observed at Hamakita GEONET station.Relatively high-speed deformation is seen in2003–2004 in Fig. 12. Active state of the deeptremor has been continuing in the northwest region of the slow-slip area since 2003 (the region 2in Fig. 7). The fast crustal deformation in 2003–2004 is simultaneous with the abnormal tremor activity since 2003. We suspect that there would besome interactions between the slow-slip and deep44.1Source Characteristics of LFTSource Force Direction of LFTIt is important to know the source mechanism ofthe tremor to understand this phenomena. S-waveis dominant on the tremor waveforms. It is considered that some kind of shear force causes thetremor.We estimate source-force direction from particlemotions of S-waves with a method by Ukawa andOhtake (1987). We get S-wave polarization directions from particle motions of every two secondswith overlapping of one second as shown in Fig.13. Lower panel in Fig. 13 show particle motionson radial-transverse (R-T), vertical-radial (Z-R)
10Proceeding of the UJNR 5th Earthquake Research Panel Meeting, 2004and vertical-transverse (Z-T) planes. Polarizationdata indicated by circles on the upper-right corners of the chart of particle motions are used toestimate source mechanism.We estimate source force directions for timeintervals with enough number of polarizationdata. Source force directions were estimated forsingle-force and double-couples models. Fig. 14shows an example of a solution. Red line segments show observed polarization directions, andcolor map show residual distribution. Region ofsmall residual is rather concentrated. This indicates that this kind of analysis can bring out informations on the tremor source mechanism.S F T : 1 N s t : 1 3A IC : 2 9 . 1 4DC T : 1 N s t : 1 3A IC : 2 8 . 1 7TAKNDI SA. MKBND . KGWND . NUKND . HOUND . TOE ND . SMYNU . TYDNU . S TNND . ASHND . HTNYASUOKND . ACHTAKNDI SA. MKBND . KGWND . NUKND. HOUPND . TOE ND . SMYNU . TYDNU . S TNND . ASHND . HTNYASUOKTND . ACHLOW364963Re s ( d e g )LOW324456Re s ( d e g )Do u b l e Co u p l e37 N36 N35 N34 N33 N02 0 0 km132 E 133 E 134 E 135 E 136 E 137 E 138 E 139 E 140 E 141 E( L ow e r h em i s p h e r e )Figure 15: Inferred P- or T-axes for a double-couplemodel projected on a lower hemisphere of each region.Regions are shown with yellow rectangles.S i ng l e Fo r c e37 N36 N35 N34 N33 N02 0 0 km132 E 133 E 134 E 135 E 136 E 137 E 138 E 139 E 140 E 141 E( L ow e r h em i s p h e r e )Figure 14: Source force directions inferred from particle motions for single-force (SF) and double-couples(DC) models projected on lower hemispheres.Inferred P/T axes or force directions are shownin Figs. 15 (double-couple mode) and 16 (singleforce model), respectively. In this analysis, P/Taxes are not distinguished because initial motionpolarities are not used. Solutions of single force(Fig. 16) show relatively clear foci than those fordouble couple model. Source force directions ofthe tremor are distributed along NW-SE directionwhich is parallel to the direction of the PhilippineSea plate motion. This indicates that the motionof the Philippine Sea plate related to the tremoractivities.On the other hand, many of source-force directions of events around Mt. Fuji (138.7 E, 35.3 N)are nearly vertical. Those of events in the westernTottori area (around 133.3 E, 35.3 N) show similar tendency. Source-force direction of the tremoris clearly different from that of LFE in volcanicareas.It is also notable that non-volcanic LFE insouthwest Japan around 135 E, 35 N show similarFigure 16: Inferred force direction for a single-forcemodel projected on a lower hemisphere of each region.Regions are shown with yellow rectangles.distribution as those in volcanic LFE. Althoughthe region is in the fore-arc side of the volcanicfront and in non-volcanic areas, the mechanismof LFE in the region would be similar to that involcanic regions.4.2Source Spectrum of the TremorIt is well-known that LFT show peak spectrumaround 2–3 Hz. Fig. 17 shows an example of spectrum of the tremor. The spectrum is calculateddirectly from ground velocity record obtained witha broadband instruments (STS-1) without instrumental response correction. The black bold andblue thin curves show spectra of tremor-activeperiod and period without tremor, respectively.Spectrum level is clearly different in a frequencyrange of 1–10 Hz. But no clear difference is seenin other frequency ranges. In the frequency rangeof 0.1–1 Hz, high-level ground noise due to micro-
11Proceeding of the UJNR 5th Earthquake Research Panel Meeting, 20042 0 0 1 / 0 6 / 0 3 0 8 : 4 0 H : 3 0 kmYASUOKNSNE A I CH I PREFYASUOKD 2 (3P ) . 9 km A 3(4S ) . 3 d e gS0.05.0EW(P)10 . 0(S)15 . 020 . 025 . 030 . 035 . 040 . 045 . 015 . 020 . 025 . 030 . 035 . 040 . 045 . 0S0.05.0UD(P)10 . 0(S)S0.05.010 . 015 . 013220 . 0547625 . 0981110131230 . 01514171635 . 019182120232240 . 0252427262831302 R1 0 8 . 1 TR3 R1 1 6 . 9 TR4 R1 2 2 . 7 TR5 R1 2 0 . 0 TR6 R- 4 2 . 5TR7 R1 3 0 . 3 TR8 R- 4 2 . 4TRTTTTTTTTZZRZRZ2 0 ( nm )369 R0 . 7 TR1 0 R- 2 6 . 5TRTRRZT1 0 ( nm )TZZT1 0 ( nm )3437RZT35ZRZT2 0 ( nm )ZRZT2 0 ( nm )ZRZT2 0 ( nm )ZRZT2 0 ( nm )ZRZT5 0 ( nm )Z33321 R1 3 2 . 6 TRZ1 0 0 ( nm )45 . 029T1 0 ( nm )T1 0 ( nm )Figure 13: Particle motions of the tremor. The upper panel shows waveforms of three components, and thelower panel shows particle motions on radial-transverse (R-T), vertical-radial (Z-R) and vertical-transverse (Z-T)planes of every two second period with overlapping of one second.seisms is recognized. In the range of 0.01–0.1 Hzin which the ground noise is low enough, power ofthe tremor is not recognized.Hirose and Obara (2003) found slow-slip eventssimultaneous with deep tremor activities. Iftremor is directly due to a slow-slip event, spectrum level at low frequency is higher than thatat high frequency based on source spectrum models [e.g., Aki, 1967]. But no power is observedat frequency ranges of 0.01-0.1Hz. This indicatesthat there would be different power source for thetremor from the slow-slip.5Fluid Generation inTremor Source RegiontheThe continuous tremors remind us of volcanictremors, which are caused by some kinds of fluid[e.g., Chouet, 1996]. Deformation of ductile material may also show long duration like tremor.Since a large quantity of water is conveyedby subduction of the Philippine Sea plate, waterwould be related to the deep tremor, directly or in-directly. Water would alter physical properties ofminerals, and may cause tremor directly by moving or vibration.We assume some possible sources of the waterwhich is related to the deep tremor.1. Extraction of interstitial water from oceaniccrust.2. Dehydration from minerals in the oceaniccrust.3. Dehydration from minerals in the mantle ofthe Philippine Sea plate.4. Dehydration from minerals in the mantlewedge.Although extraction of interstitial water fromthe oceanic crust might be a possible source, itwould be difficult to explain why the extractionoccurs at the restricted depth range of 25–40km.Since extraction of interstitial water should occurgradually, the limited depth range of water supplyis considered to be related to limited pressure andtemperature condition.
Proceeding of the UJNR 5th Earthquake Research Panel Meeting, 2004S p e c t r a l Amp l i t u d e ( m / s )2004 / 06 / 27 16 :00 - - 17 :0010in the region to the right of line ”A”, water isreleased by dehydration of chlorite along this line.On the other hand, the temperature profile beneath Kii Peninsula crosses a thick line ”B” atsimilar depth. Crossing this line, clinopyroxeneappears. Because clinopyroxene is not a hydrousmineral, the total water content of the basalt decreases.-910- 1010- 1110- 1210-410-310 -210 -1F r e q u e n c y ( Hz )12100101Figure 17: Spectrum of LFT observed at Asahi sta-NortheasternJapantion (Fig. 18) of the F-net installed by the NIED. Theblack bold and blue thin curves show spectra of tremoractive period and period without tremor, respectively.As ah isulaBeninKii PikokuShA35 N137 E137 30 ’E138 EFigure 18: Station of Asahi (F-net of the NIED) andepicenters of LFT in June 2004 (red circles).Fig. 19 shows the phase relationships forwater-saturated mid-ocean ridge basalt obtainedby Schmidt and Poli (1998). This phase relationships are applicable to minerals in a oceanic crustin a subducting slab. The broken curves in thefigure show geotherms at the top of the subducting Philippine Sea plate estimated by Hyndmanet al. (1995) for Tonankai and Nankaido profiles,respectively (Fig. 5). Depth contours in Fig. 8were used to convert distance from the trench axisinto depth at the top of the slab. The Philippine Sea plate subducts with a steeper incline beneath Kii Peninsula than beneath Shikoku. Thegeotherms cross the phase boundary shown by theheavy solid curve. Because chlorite can not existFigure 19: Phase relationships for water-saturatedmid-ocean ridge basalt [Schmidt and Poli, 1998] andtemperature profiles for the upper surfaces of the Pacific Plate under northeastern Japan [Iwamori, 1998]and the Philippine Sea Plate beneath the Kii Peninsulaand Shikoku [Hyndman et al., 1995] in southwesternJapan: amph amphibole, chl chlorite, cld chloritoid, cpx jadeitic or omphacitic clinopyroxene, epi epidote, gar garnet, law lawsonite, zo zoisite.The temperature profile for the Philippine Sea Platebeneath Shikoku crosses a thick line ”A” at a depthof about 40km. On the other hand, the temperatureprofile beneath Kii Peninsula crosses a thick line ”B”at similar depth.Fig.20 shows Phase diagram for watersaturated average mantle peridotite, modifiedfrom a figure by Schmidt and Poli (1998), andtemperature profiles for the top of the PacificPlate under northeastern Japan [Iwamori, 1998]and the Philippine Sea Plate beneath the KiiPeninsula and Shikoku [Hyndman et al., 1995] insouthwestern Japan. Serpentine and some otherhydrous minerals including chlorite and amphibole in the mantle peridotite also dehydrate under
13Proceeding of the UJNR 5th Earthquake Research Panel Meeting, 2004the conditions of 600–700 C and 30–50 km. Thisindicates a possibility that hydrous minerals inthe descending mantle wedge along with the slabwould also release water. Though, temperature atthe top of the mantle wedge beneath Shikoku wasestimated at about 450-500 C by Hyndman et al.(1995). The temperature is considered too low forserpentine in the mantle wedge to release much ofwater.breakdownof chlbreakdownof chlNortheasternJapanbreakdown of serpbreakdownof serpKii Pand the mantle wedge due to a different mechanical condition from that between the inland crustand the oceanic crust.When the Philippine Sea plate reach at thedepth around 50km, melting of the slab wouldstart. On the other hand, the lowest part ofthe mantle wedge, which consists of hydrous peridotite, descends with slab and release water because of dehydration of serpentine and chlorite ataround the depth of 60-80km. At deeper point,the hydrous peridotite starts melting partially.Such high temperature fluid or magma wouldcause LFE.Fig. 21 s
Proceeding of the UJNR 5th Earthquake Research Panel Meeting, 2004 4 N / S 0 m 1 0 2 0 l 3 0 4 0 5 0 E p i c e n t r a D i s t a n c e (k) 0 8 : 4 0 : 0 0 0 8 : 4 0 : 3 0 0 8 : 4 1 : 0 0 0 8 : 4 1 : 3 0 ( JST ) T ime P S P S P S LG. HRN ND . ACH ND . HTN ND . KGW ND . KSH ND .MSK ND . SMY ND . TNR ND . TOE NU . STN TAKI SA YASUOK Figure 4 .