Transcription
WHO WANTSTO BE AMILLIONAIRE?MATSON MONEYINVESTOR EDUCATION SERIES
TABLE OF CONTENTSpage 3WHO WANTS TO BE A MILLIONAIRE?page 4MILLIONAIRE FACTSpage 6“I’LL CATCH UP LATER”page 7THE MAGIC OF COMPOUNDINGpage 9THREE RULES OF SUCCESSFUL INVESTINGpage 1071 WAYS TO BECOME A MILLIONAIREpage 11THE 20 MUST-ANSWER QUESTIONS This booklet is based on the views of Matson Money, Inc. Other persons may analyze investments and the approach to investing froma different perspective than that reflected in this booklet. Nothing included herein is intended to infer that the approach to investingespoused in this booklet will assure any particular results.All investing involves risks and costs. Your adviser can provide you with more information about the risks and costs associated with specificprograms. Your adviser is not affiliated with Matson Money, Inc. No investment strategy (including asset allocation and diversificationstrategies) can ensure peace of mind, guarantee profit, protect against loss, or make you a millionaire.Index performance returns do not reflect any management fees, transaction costs or expenses. In addition, each index is unmanagedand not available for direct investment; therefore its performance does not reflect the expenses associated with the management of anactual portfolio. Actual results of accounts under Matson Money’s management may have been materially different. Performance resultsand comparative indices assume reinvestment of dividends and income. 2005-2017 McGriff Video Production, LLC., an Ohio limited liability company and a wholly-owned subsidiary of Matson Money, Inc.2
WHO WANTS TO BE A MILLIONAIRE?What would you do with 1,000,000?No investment strategy (including asset allocation and diversification strategies) can ensure peace of mind, guarantee profit, protect against loss, or makeyou a millionaire.3
MILLIONAIRE FACTS There are 3.1 million millionaires in the United States. More than one third of millionaires own theirown businesses. Over a third have a professional practice orwork in the corporate world. Only 5% of millionaires inherited their wealth. 1 in 100 Americans are millionaires.Who Wants To Retire?What kind of lifestyle do you want whenyou retire?4Source: ning-lottery-beat-odds-200242995.htmlAnnual World Wealth Report, Merrill Lynch and Capgemini, 2010“US Has Record Numbers of Millionaires” by Robert Frank“10 things Millionaires Won’t Tell You” by Daren Fonda and Lisa ScherzerAmerican Express/Harrison Group Survey, 2009
How much money will you need toretire comfortably?When do you want to retire?What have you done so far to preparefor your retirement?SO ABOUT RETIREMENTThe average American spends 20 years in retirement.Experts estimate that you will need 70% of yourpre-retirement income to maintain your standard of living.Only 42% of Americans have calculated howmuch they need to save for retirement.Source: US Department of Labor5
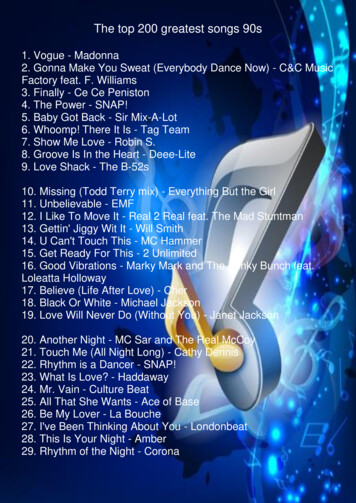
“I’LL CATCH UP LATER” 250,000.00 200,000.00 150,000.00 100,000.00 50,000.00 0.00Total Contributions: 12,000Saving 100 fromage 23-33 andstopping* 36,000Saving 100 fromage 23-33 andstopping*You might, but it gets muchmore difficult.*Assumes 8% annual rate of return. This rate is for illustrative purposes only and is not indicative of the performance for any particular investment. Actualrates and principal value will fluctuate. This does not assume taxes or possible penalties that would be applicable to the tax-deferred investment uponwithdrawal. Investments with higher return potential typically include a higher degree of risk to principal. Investors should consider their personal risktolerance before choosing investments.6
THE MAGIC OF COMPOUNDINGThe good news:You can do it.and it doesn’thave to hurt that much. 200Age: 30 84,000 592,770This chart is for illustrative purposes only and is not indicative of the performance for any particular investment. Actual rates and principal value willfluctuate. This does not assume taxes or possible penalties that would be applicable to the tax-deferred investment upon withdrawal. Investmentswith higher return potential typically include a higher degree of risk to principal. Investors should consider their personal risk tolerance before choosinginvestments.7
IF YOU MAKE 30,00010% Contribution by you 3,000In 30 years you could have:5% 199,316.547% 283,832.3610% 493,482.07IF YOU MAKE 60,00010% Contribution by you 6,000In 30 years you could have:5% 398,633.097% 566,764.7210% 986,964.148This chart is for illustrative purposes only and is not indicative of the performance for any particular investment. Actual rates and principalvalue will fluctuate. This does not assume taxes or possible penalties that would be applicable to the tax-deferred investment upon withdrawal.Investments with higher return potential typically include a higher degree of risk to principal. Investors should consider their personal risktolerance before choosing investments.
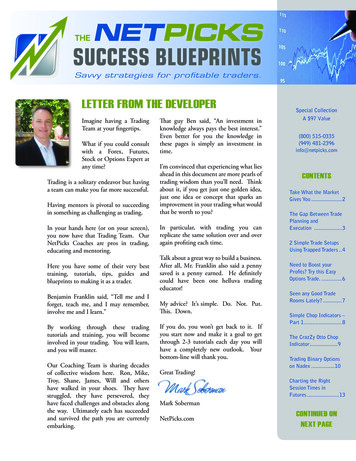
THE THREE RULES OF INVESTING:1. Own Equities2. Diversify Globally3. Rebalance RegularlyYou probably aren’t going to “save” your way to 1,000,000.you are going to have to save and invest your way there.What Diversification andEfficiency Could Look Like:This chart illustrates the diversification of Matson’s Long-Term Growth Portfolio, a 75-25% diversified asset allocation portfolio actually offered andmanaged by Matson Money, Inc. Each asset class is represented either by segments of a family of mutual funds managed and sponsored byMatson Money or by an unaffiliated money market sweep account. Each Matson Money mutual fund invests in shares of other mutual funds for thepurpose of optimizing portfolio diversification. The unique holdings identified above are a result of investing in several different mutual funds. Yourassets will be invested in accordance with your investment policy statement and no representation is made that your portfolio will match the assetallocation illustrated here. No investment strategy (including asset allocation and diversification) can ensure investing peace of mind, guaranteeprofit or protect against loss.9
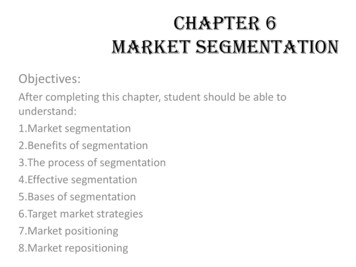
71 WAYS TO BECOME A MILLIONAIREIt’s never too soon to start.Invest early. Invest often.Account Value for Growth at Age 65Monthly Cont. 1,500 26,351,027 14,856,633 8,346,039 4,658,343 2,569,578 1,386,471.03 716,342 336,771 121,776 1,400 24,594,292 13,866,190 7,789,636 4,347,787 2,398,273 1,294,040 668,586 314,319 113,658 1,300 22,837,556 12,875,748 7,233,234 4,037,231 2,226,968 1,201,608 620,830 291,868 105,539 1,200 21,080,821 11,885,306 6,676,831 3,726,675 2,055,663 1,109,177 573,073 269,417 97,421 1,100 19,324,086 10,894,864 6,120,429 3,416,118 1,884,357 1,016,745 525,317 246,965 89,302 1,000 17,567,351 9,904,422 5,564,026 3,105,562 1,713,052 924,314 477,561 224,514 81,184 900 15,810,616 8,913,980 5,007,623 2,795,006 1,541,747 831,883 429,805 202,062 73,066 800 14,053,881 7,923,537 4,451,221 2,484,450 1,370,442 739,451 382,049 179,611 64,947 700 12,297,146 6,933,095 3,894,818 2,173,893 1,199,136 647,020 334,293 157,160 56,829 600 10,540,411 5,942,653 3,338,416 1,863,337 1,027,831 554,588 286,537 134,708 48,710 500 8,783,676 4,952,211 2,782,013 1,552,781 856,526 462,157 238,781 112,257 40,592 400 7,026,940 3,961,769 2,225,610 1,242,225 685,221 369,726 191,024 89,806 32,474 300 5,270,205 2,971,327 1,669,208 931,669 513,916 277,294 143,268 67,354 24,355 200 3,513,470 1,980,884 1,112,805 621,112 342,610 184,863 95,512 44,903 16,237 100 1,756,735 990,442 556,403 310,556 171,305 92,431 47,756 22,451 8,118Age202530354045505556% of allWorkers haveless than 25,000 ininvestments. 160Past performance is no guarantee of future results. These returns assumes a 12.04% annual return, and does not reflect any portfolio managed byMatson Money Inc. This chart illustrates back-tested historical returns of various indices representing each asset class of the hypothetical portfolio. Itincludes reinvestment of dividends and capital gains. The endnotes contain more information on the inherent limitations of back-tested performanceand the representative indices used to generate the hypothetical portfolio. No representation is made that your investments will achieve results similarto those shown.10
THE 20 MUST-ANSWER QUESTIONS FORYOUR JOURNEY TOWARD INVESTINGPEACE OF MIND 1. Have you discovered your True Purpose for Money, that which is more important than money itself?qYESqNO2. Are you invested in the Market?qYESqNO3. Do you know how markets work?qYESqNO4. Have you defined your Investment Philosophy?qYESqNO5. Have you identified your personal risk tolerance?qYESqNO6. Do you know how to measure diversification in your portfolio?qYESqNO7. Do you consistently and predictably achieve market returns?qYESqNO8. Have you measured the total amount of commissions and costs in your portfolio?qYESqNO9. Do you know where you fall on the Markowitz Efficient Frontier?qYESqNO10. When it comes to building your investment portfolio, do you know exactly what you are doing and why?qYESqNO11
11. Are you working with a financial coach versus a financial planner?qYESqNO12. Do you have a customized lifelong game plan to guide all of your investing and spending decisions?qYESqNO13. Do you have an Investment Policy Statement?qYESqNO14. Have you devised a clear-cut method for measuring the success or failure of your portfolio?qYESqNO15. Do you fully understand the implications and applications of diversification in your portfolio?qYESqNO16. Do you have a system to measure portfolio volatility?qYESqNO17. Are you aware of the costs associated with purchasing commission-based products?qYESqNO18. Do you know the three warning signs that you may be speculating with your money versus prudentlyinvesting it?qYESqNO19. Can you identify the cultural messages and personal mind-sets about money that destroy your investing peaceof mind?qYESqNO20. Are you ready to shift your personal experience of money and investing from a scarcity mode to anabundance mode - where you can live your life rather than obsess about your assets?qYESqNOWhen you have achieved the ability to answer “yes” to all of thesequestions, you will be on your way to a high level of investing peace of mind.All investing involves risks and costs. No investment strategy (including asset allocation and diversification strategies) can ensure peace of mind,guarantee profit, or protect against loss.12
NOTES13
14
15
ENDNOTES1. This Presentation includes historical back-tested performance information from various global stock markets and registered open-endinvestment companies or “mutual funds”. Slide 61 illustrates a well-diversified assets derived from various market indices. The Portfolio wasdesigned recently with the benefit of hindsight after the performance of the markets during the relevant time period was already known. Backtested results assume that asset allocations would not change over time or in response to market conditions, which might have occurred in thecase of actual account management. This Presentation also includes historical mutual fund data and hypothetical back-tested fund portfolios.Back-tested performance has inherent limitations and does not reflect the performance of actual accounts managed by Matson Money. MatsonMoney began managing clients’ funds in 1991. Because back-tested performance does not represent actual trading in client accounts, it maynot reflect material economic and market factors, as well as the impact of cash flows, liquidity constraints, investment guidelines or restrictionsand fees and expenses that would apply to actual trading. Back-tested results assume that asset allocations would not change over time orin response to market conditions, which might have occurred in the case of actual account management. The Hypothetical Portfolio is forpedagogical purposes only and intended to educate investors on the potential benefits of long-term investing in well-diversified portfolios. Noinference is made that clients would have had the same performance results if Matson Money managed their assets for any part of this period.Hypothetical Portfolio returns generally exceed the results of client portfolios managed by Matson Money due to several factors, including thefact that actual portfolio allocations differed from the allocations represented by the market indices used to create the hypothetical portfolioover the time periods shown, new research was applied at different times to the relevant indices, and index performance does not reflectthe deduction of any fees and expenses. Both the back-tested Hypothetical Portfolio and Matson Money’s own asset allocation formulasmay change as additional economic research becomes available. The annual return information of the hypothetical portfolio assumes thereinvestment of dividends and capital gains. Mutual fund return data reflects the deduction of all fund fees and expenses. Advisory fees chargedto Matson Money clients, whether directly or indirectly through a mutual fund, are described in Part 2 of Matson Money’s Form ADV and arediscussed more fully in endnote 4, below. Past performance is no guarantee of future results.A. Historical stock market information is derived from returns software created by Dimensional Fund Advisors LP (DFA) as updated throughDec. 2016. DFA is a registered investment adviser that, among other things, specializes in and sells statistical market research and mutualfund management. DFA obtains some of its market data from the Center for Research & Security Pricing (CRSP), part of the University ofChicago’s Booth School of Business (Chicago Booth).B. Mutual fund performance information is from 2 sources: the CRSP Survivor-Bias-Free US Mutual Fund Database and Dalbar, Inc.’s 2017Quantitative Analysis of Investor Behavior (QAIB) study.The CRSP Survivor-Bias-Free US Mutual Fund Database is the only complete database of both active and inactive mutual funds and servesas a foundation for research and benchmarking mutual funds. Developed by Mark M. Carhart of Goldman Sachs Asset Management for his1995 Chicago Booth dissertation entitled, “Survivor Bias and Persistence in Mutual Fund Performance,” to provide survivor-bias-free data notpreviously available, the database has been maintained by CRSP since its creation. For more database information, see http://www.crsp.com/products/mutual funds.htm.Dalbar, Inc. (Dalbar) is a leading independent expert for evaluating, auditing and rating business practices, customer performance, productquality and service. QAIB uses data from the Investment Company Institute, Standard & Poor’s (S&P) and Barclays Capital Index Productsto compare mutual fund investor returns to relevant benchmarks. Using monthly data on mutual fund sales, redemptions and exchanges,Dalbar created a measure of investor behavior it calls the “average investor”. The “average investor” analysis is used to calculate “averageinvestor return” for various periods, which is then compared to relevant index returns. Mutual fund investor returns were prepared by Dalbarusing data supplied by the Investment Company Institute which takes into account all fund fees and expenses. See 2017 Dalbar Study, n.4 at p. 29.162. Asset Class ComponentsU.S. Large Company Stocks – represented by the S&P 500 IndexU.S. Small Company Stocks – represented by CRSP 9-10 IndexInternational Large Company Stocks – represented by MSCI EAFE IndexInternational Small Company Stock – represented by DFA index described in endnote 3.D., belowU.S. Small Company Value Stocks – represented by Fama/French US Small Value Research indexU.S. Large Company Value Stocks – represented by Fama/French US Large Value Research index5 Year Government Portfolio – represented by Morningstar Five-Year US Treasury Notes IndexOne Year Fixed Income – represented by Bank of America Merrill Lynch 1-Year US Treasury Notes Index
3. RELEVANT INDICES – Segments of market performance information are represented by the following market indices:A. S&P 500 – an unmanaged, market-weighted stock index based on the market capitalizations (cap) of 500 leading companies publiclytraded in the U.S. stock market, as determined by S&P Dow Jones. It is one of the most commonly followed equity indices. Roger G. Ibbotsonand Rex A. Sinquefield performed groundbreaking work on this data in Stocks, Bonds, Bills, and Inflation: The Past and the Future, DowJones, 1989. Ibbotson Associates, Chicago.B. CRSP Stock File Capitalization Decile Indexes – CRSP calculates indices for five groups of U.S. stock markets (NYSE, AMEX andNASDAQ separately, NYSE/AMEX combined and NYSE/AMEX/NASDAQ combined) in which all securities other than ADRs are rankedby their market cap and then divided into 10 deciles with an equal number of securities in each decile. Starting with the NYSE, CRSP firstsorts all stocks on the NYSE by market cap and breaks the universe into ten equal groups, called “deciles,” by number of names. Decile 1represents the largest stocks on the NYSE and decile 10 represents the smallest NYSE stocks. CRSP then includes all equivalently sizedAMEX and NASDAQ stocks into the NYSE size decile in which they fit by market cap. This Presentation uses market data from the followingCRSP indices:1. CRSP 1-10 Index: Representing the entire market cap of the NYSE and other exchange equivalents.2. CRSP 1-5 Index: The largest half of NYSE stocks by name and all equivalents from other exchanges, covering Large Cap through MidCap stocks.3. CRSP 6-10 Index: The smallest half of NYSE stocks by name and all equivalents from other exchanges, sometimes referred to as “smallcap” stocks. Similar in size to the Russell 2000 Index.4. CRSP 9-10 Index: The smallest fifth of NYSE stocks by name and all equivalents from other exchanges, sometimes referred to as“micro-cap” stocks.C. Morgan Stanley Capital International (MSCI) Europe, Australasia, Far East (EAFE) Index – The MSCI EAFE is an unmanaged, free floatadjusted market cap index designed to measure the equity market performance of developed markets, excluding the US & Canada. As of12/31/12, it consists of the following 22 developed market country indices: Australia, Austria, Belgium, Denmark, Finland, France, Germany,Greece, Hong Kong, Ireland, Israel, Italy, Japan, the Netherlands, New Zealand, Norway, Portugal, Singapore, Spain, Sweden, Switzerland,and the United Kingdom.D. DFA International Small Company Stock Index – created as follows for various time periods: January 1994 - Present: Simulated by DFA from Bloomberg securities data. Returns computed from the average of four staggered, marketcap-weighted annually rebalanced portfolios of small company securities. Small companies defined as the bottom 10% of the marketranked by market cap. REITs are excluded. Maximum index weight of any one company is capped at 5%. Countries included are Australia,Austria, Belgium, Canada, Denmark, Finland, France, Germany, Greece, Hong Kong, Ireland, Italy, Japan, Netherlands, New Zealand,Norway, Portugal, Singapore, Spain, Switzerland, Sweden, United Kingdom. July 1981 - December 1993: Simulated by Dimensional from Style Research securities data. Includes securities of MSCI EAFE countriesin the bottom 10% of market capitalization, excluding the bottom 1%. All securities are market capitalization weighted. Each country iscapped at 50%. Rebalanced semiannually. January 1970-June 1981: 50% Hoare Govett Small Companies Index (hgsmall.ind), 50% Nomura Small Companies Index (nomura.ind).E. Fama/French US Large Value research data and Fama/French US Small Value research data – developed by Eugene Fama and KennethR. French, the U.S. Large Value strategy relies, in part, on the CRSP 1-5 Index and the U.S. Small Value strategy relies, in part, on the CRSP6-10 Index, both of which are described above.17
F. Barclays U.S. Government/Credit Index (formerly a Lehman Brothers Index) – the nonsecuritized portion of the Barclays U.S. AggregateIndex, including Treasuries, government-related issues and corporates to reflect the performance and characteristics of the underlying market.The Barclays U.S. Aggregate Bond Index reflects the broadest measure of the taxable U.S. bond market, including most Treasury, agency,corporate, mortgage-backed, asset-backed, and international dollar-denominated issues, all with maturities of 1 year or more and covers theUSD-denominated, investment-grade (rated Baa3 or above by Moody’s), fixed-rate, and taxable areas of the bond market.G. Morningstar Five-Year US Treasury Notes Index (formerly Ibbotson Intermediate Five Year Treasury Notes data derived from Stocks,Bonds, Bills and Inflation, referenced above).H. Bank of America Merrill Lynch 1-Year US Treasury Notes Index – an unmanaged index comprised of a single outstanding two-yearTreasury Note purchased at the beginning of the month and held for a full month. The Note selected at each month-end rebalancing is onethat matures closest to, but not beyond, one year from the rebalancing date.I. T-Bill Data – developed by Roger G. Ibbotson and Rex A. Sinquefield in Stocks, Bonds, Bills, and Inflation, referenced above.J. Consumer Price Index (CPI) – the CPI is produced and published monthly by the U.S. Bureau of Labor Statistics to reflect changes in theprices paid by urban consumers for a representative basket of goods and services and is commonly used as a measure of domestic inflation.4. Fee and Expense InformationA. Market Indices – Investors cannot invest in a market index directly, the performance of an index does not represent any actual transactionsand its performance does not reflect the deduction of any fees or expenses associated with actual investing. Market performance informationis included in this Presentation solely to demonstrate the potential benefits historically associated with long-term investing in a portfolio ofwell-diversified asset classes and does not represent or suggest results Matson Money would or may have achieved when managing clientportfolios.B. Mutual Funds – The performance history of a mutual fund includes all embedded fees, costs and expenses of the fund, such as themanager’s advisory fee, brokerage commissions associated with the acquisition of portfolio securities and fund operating costs like legaland accounting fees. These fees are reflected in each fund’s expense ratio and are deducted from the value of each fund share. However,commissions associated with the sale of fund shares are not included. Fund investors who also engage an investment adviser to managetheir assets generally also pay a separate advisory fee to this manager.C. Matson Clients - In the case of the Matson Money mutual fund advisory program, clients generally do not pay any additional fee to MatsonMoney beyond the embedded fund advisory fee. Instead, clients generally pay a separate advisory fee to an unaffiliated adviser that servesas a co-adviser to the clients in conjunction with Matson Money’s mutual fund asset allocation program. Mutual funds created and managedby Matson Money are designed as “funds-of-funds” and invest in, among other things, mutual funds managed by DFA which include DFA’smanagement fee. In addition, clients enter into an agreement with a custodian that works with the Matson Money mutual fund platform andseparately pay the custodian’s fee. With respect to any hypothetical portfolio, Matson clients should deduct from any performance numbersillustrated a maximum amount of .51% representing all embedded fund fees and expenses since maximum co-adviser fees are below the 2%fee already deducted from the hypothetical portfolios.18
PAST PERFORMANCE IS NO GUARANTEE OF FUTURE PERFORMANCE.All investing involves risk and costs. Your adviser can provide you with more information about the risks and costs associated with specificprograms. No investment strategy (including asset allocation and diversification strategies) can ensure peace of mind, guarantee profit, orprotect against loss.75% Equity/25% Fixed Income Globally Diversified Strategy Allocations:19
INVESTOR EDUCATION SERIES18760 N Pima Rd. Scottsdale, Arizona 85255 5955 Deerfield Blvd. Mason, Ohio 45040 513.204.8000IES MillionaireWBv05232017(3)
strategies) can ensure peace of mind, guarantee profit, protect against loss, or make you a millionaire. . There are 3.1 million millionaires in the United States. More than one third of millionaires own their own