Transcription
London Borough of SouthwarkPension Fund Annual ReportFinancial Management Serviceswww.southwark.gov.uk
CONTENTSPageOverviewManagement & Financial Performance ReportInvestment Policy & Performance Report12-56-14Scheme Administration Report15-17Statement of the Actuary18-19Governance Compliance Statement (Commentary)20-22Fund Account & Net Assets Statement23-30Statement of ResponsibilitiesAuditor’s Report3132-33Implementation of Funding Strategy Statement34Implementation of Statement of Investment Principles35Application of Communications Policy Statement36Further Information37GlossaryAppendix 1: Participating Employers38-4041
Appendix 2: Pension Fund Risk Register42Appendix 3: Governance Policy Statement43-44Appendix 4: Governance Compliance Statement45-48Appendix 5: Funding Strategy Statement49-54Appendix 6: Statement of Investment Principles55-70- Assessment of Compliance with Myners PrinciplesAppendix 7: Pension Services Communication Strategy71-72
OVERVIEWThe London Borough of Southwark Pension Fund is part of the Local Government Pension Scheme (LGPS).The LGPS is a statutory funded scheme, governed by the Local Government Pension Scheme Regulations1997 and subsequent amendments and regulations. This means its benefits are set out and guaranteed inlaw.The Council is the administering authority. The finance director is responsible for fund investment andadministration and for the preparation of the Fund’s Statement of Accounts in accordance with the CIPFACode of Practice. The costs of administration and of paying pensions and benefits are charged to thepension fund.The Southwark Fund administered by Southwark Council covers the pension entitlements of all eligibleemployees. A number of other bodies are also members and they include admitted bodies, scheduledbodies and community bodies.Employees can now choose to join, remain within the scheme or make their own personal pensionarrangements.The scheme has to be fully funded or have a plan to become so. It is financed by contributions fromemployers and employees and by earnings from investments. Funds not immediately required to meetpensions and other benefits are invested in a selection of securities, equities and property. The pension fundmust be sufficient to meet the future pension entitlements of both past and present employees. This isachieved by adjusting the level of employers’ contributions every three years following an actuarial review ofthe Fund by its actuary, Hewitt Associates.Contributions & BenefitsLegislation requires regular three yearly actuarial valuations of local authority pension funds to determine theannual contributions to be made by the employing bodies. The valuation on which the employers’contributions for 2008/09 were based was carried out as at 31 March 2007 and will apply for the three yearsfrom 1 April 2008. The next actuarial valuation will be carried out as at 31 March 2010.From 1 April 2008 the rules of the new LGPS Scheme have applied. Previously employees generallycontributed to the scheme at a rate of 6% of pensionable pay. Under the new scheme tiered contributionrates apply based on pensionable pay.The administering authority is also required to enable employees to make additional voluntary contributions(AVCs) to obtain enhanced pension benefits. The AVC provider for the Southwark Pension Fund is ScottishEquitable.The LGPS is a defined benefit “final salary” scheme. The annual pension and the retirement lump sum arebased on length of service and usually the final twelve months of pay.1
MANAGEMENT & FINANCIAL PERFORMANCE REPORTScheme Management and AdvisersAdministering AuthorityLondon Borough of SouthwarkPensions Advisory PanelMembership 2008/09Councillors:Tim McNally (Chair)Toby EckersleyFiona ColleyOfficers:Duncan Whitfield (Finance Director)Dave Howes (Asst. Finance Director)Bernard Nawrat (Head of HR)Observers:Roy Fielding (GMB)Euan Cameron (Unison)Advisers:Emily McGuire (Hewitt)Graham Wood (WM Company)ActuariesHewittProperty SolicitorsDibb Lupton AlsoppTodds MurrayAVC ProvidersScottish EquitableAuditorsAudit CommissionPerformance MonitoringWM CompanyCustodiansJP MorganBNP Paribas Securities LtdInvestment ManagersBarclays Global InvestorsAlliance BernsteinNewton Investment ManagementHenderson Global Investors2
Risk ManagementThe Finance Director has overall responsibility for all aspects of the administration and investments of theFund. The Pensions Advisory Panel (PAP) act in their role as advisers to the Finance Director, taking intoaccount the advice they receive from the Fund’s external advisers. They make recommendations to theFinance Director on matters relating to the management of the Fund. The management of risks is a keyfactor in all recommendations made by the Panel, thereby ensuring any risks to the Council arising from theFund are kept to an acceptable level.The Pension Fund’s risk register can be found at Appendix 2 of this report. The key risks facing the Fundare: Poor investment performance could lead to a larger deficit and therefore a requirement for higheremployer contributionsAsset/liability mismatch - assets could fail to rise at the same rate as liabilities resulting in a higherdeficit.Inaccuracy of financial information - leading to qualification of accountsReliance on third party providers for investment management and custodial services - failure ofthese parties could have a serious financial impact on the FundFailure to comply with existing/new regulations - resulting in legal sanctions and detrimental effect onCouncil's reputation.Admitted/Scheduled Bodies: Failure of body/deficits on termination of contracts - could lead to anincrease in the Council’s contribution level to cover shortfall.Failure to control and monitor costs resulting in higher running costs for the FundThe risk register sets out the controls in place to manage the above risks.Financial PerformanceActual/Forecast Cash Flows 2008/09 – INCOMEEmployer ContributionsEmployee ContributionsTransfers InTOTAL ,2096,929,50052,432,674EXPENDITUREPensions PayableRetirement & Death BenefitsTransfers OutAdministration CostsInvestment Management ExpensesTOTAL NET CASH INFLOW FOR YEARReceipt of ContributionsAll contributions due from admitted and scheduled bodies have been received within the statutory deadlinesduring the year. The requirement has not arisen to levy interest on overdue contributions.3
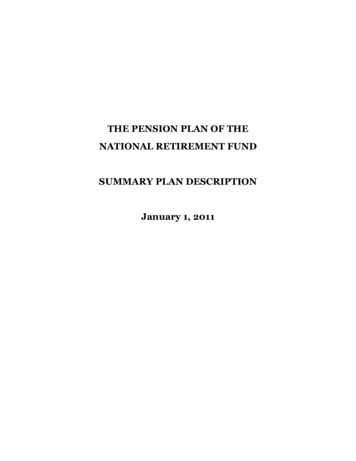
Management PerformanceKey Administration Performance IndicatorsPensions Services works to an agreed (by peer London Boroughs) set of targets based on the number ofworking days between the date all of the information is available to Pensions Services and the date the caseis authorised/finalised. The authorised/finalised date is when the benefits are set up for payment orinformation requested is sent out. The following table sets out performance against benchmark for each ofthe key tasks:TargetDays101012101510555StartersTV In (Actual)TV Out (Actual)RefundPreserved BenefitEstimate (Benefit)RetirementDeath in ServiceDeath on 10750345442202076219% .903.001.004.34Scheme MembershipDuring 2008/09 the number of pensioners increased from 5,956 at 31 March 2008 to 6,002 at 31 March2009. At the same time, the number of contributors within the Fund increased from 6,588 to 6,777. Themembership levels for the last 5 years and the membership split at 31 March 2009 are shown in the s Pensioners Deferred Pensioners4
Age Profile of Scheme Members at 31 March 20091,6001,400No of 909495- 100 99AgePensionersDependantsContributorsDeferredOf the pensioners, 1,304 received enhanced benefits because of ill-health and 578 received enhanced earlyretirement benefits during 2008/09.Participating EmployersAppendix 1 lists the admitted and scheduled bodies participating in the Fund at 31 March 2009.Contributions paid by employers and employees are shown and employee contributions are split bycontribution bands.5
INVESTMENT POLICY & PERFORMANCE REPORTREPORT OF THE FINANCIAL ADVISERInvestment Review to 31 March 2009The ‘year’ (twelve months) to 31 March 2009 was one of the worst on record for local authority pensionfunds. In September 2008 many banks in the UK, US and Europe came close to collapse and required majorgovernment support. The deepening financial crisis, triggered in 2007 by problems in the US sub-primemortgage market, hit the real economy and pushed the world into economic recession. The slide intorecession weighed heavily on all investments except government bonds. In order to stem the recessionarypressures, central banks in the major economies cut interest rates to all time lows as well as embarking onthe process known as ‘quantitative easing’ which injects money into the financial system and the economy asa whole.As economic conditions deteriorated investors shunned equities. In local currency terms, markets fell heavily;returns of -50% were common. However, a sharp drop in the value of sterling against other major currenciessoftened the falls for UK investors. UK equities, as measured by the FTSE All Share Index, recorded a returnof -29.3%. North America fell almost 40% in US dollar terms but the sharp rise in the value of the dollarmoderated the fall to -14.0% in sterling terms. Similarly the sterling return from Japan was held at -10.6% asthe Yen rose by over 39% against the pound. Continental Europe gave a return of -31.1% for the UK investordespite a 16.2% rise in the value of the euro against sterling. For the UK investor the Pacific ex Japan fell 23.1% while Emerging Markets were down -26.3%.Fears over the economy also affected the bond markets with investors assuming that there would be a waveof defaults on corporate bonds. Government bonds were viewed as a safe haven and this led to the UK GiltsAll Stocks Index returning 10.3% for the year; performance varied widely with medium dated issues returning14.6% compared to 8.7% for short dated and 8.6% for long dated. The fears over corporate failures resultedin the Merrill Lynch Corporate Bond Index showing a return of -5.9% for the year. Index-linked also posted anegative return, -1.3%, as fears of deflation emerged.Property values continued their rapid fall with the IPD index showing a return of -25.5% for the twelvemonths.In summary this was a bad ‘year’ for all investors. The typical Local Authority pension fund, as representedby the WM Local Authority Universe average, returned -19.9%. This compared with retail price inflation of 0.4% and earnings inflation of 1.1%.At the end of March 2008 Local Authority pension funds had an average exposure of about 62% to equities;they remain supportive of equities generating good investment returns over the long term. Bonds and cashrepresented almost 25% of the average fund’s investments. Property and alternatives; private equity, hedgefunds, active currency, commodities and GTAA (Global Tactical Asset Allocation), comprise the balance.Compared to the average LGPS fund, the Southwark fund’s asset allocation has a tilt toward real assets,equities and property, and as a result is underweight in monetary assets. In the very difficult marketconditions experienced over the last year the asset allocation held back performance. In addition, three ofthe Fund’s active managers underperformed their benchmark indices. Overall, the Southwark Fund recordeda negative return of -20.9% against the -19.9% of the average Local Authority fund. The Fund’s returnndranked in the 62 percentile of Local Authority results.Long TermOver the long term, the expectation is that equities and property will deliver better growth than bonds; this isan investment reward for accepting the higher degree of risk inherent in these investments. Local Authoritypension funds are long-term investors and as such can access these higher returns. Considering the Fund’smembership profile and the long-term investment return required, the Fund maintains a higher commitmentto property than the average Local Authority fund.6
In the ten years to the end of March, the Fund’s return of 2.1% per annum is broadly in line with LocalAuthority average of 2.0% per annum. Inflation over the ten years was 2.6% per annum as measured by theRetail Prices Index and 3.7% as measured by the National Average Earnings Index.Over the last three years the Fund returned -5.8% per annum against the -5.9% per annum attained by theLocal Authority average. Over this period retail price inflation was 2.7% per annum while average earningsgrew at 2.9% per annum.Report prepared by Graham Wood, The WM Company.Information on the average Local Authority comes from the WM survey of local authority pension funds.7
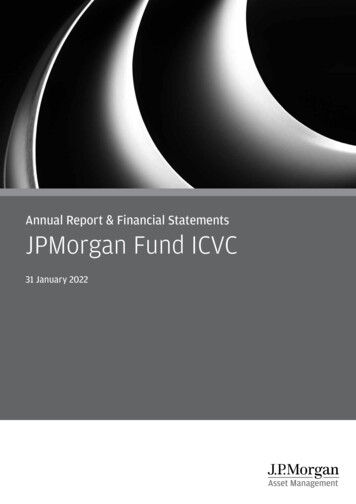
Asset Allocation StrategyThe Fund’s assets are invested in various different investment products with the objective to generatereturns to increase its funding level. Responsibility for investment is given to specialist fund managers whoinvest the funds in equities, bonds, property and other asset classes according to the investment mandatethey are given. The following table lists the fund managers, the types of mandates they manage and thevalue of their holdings at 31 March 2009 in value and percentage terms:Value at 31 March 2009( m)Fund ManagerMandateBarclays Global InvestorsBalanced exProperty324.7054.50Alliance Bernstein (Growth)Equities - Global58.639.84Alliance Bernstein (Value)Equities - Global47.798.02Newton InvestmentManagementEquities - Global49.258.27Henderson Global InvestorsProperty115.3819.37595.75100.00Total% of FundDuring the year an investment strategy review was carried out. The fund’s investment advisersrecommended to the Pensions Advisory Panel that a proportion of the allocation to gilts be reallocated tocorporate bonds (as per the change in benchmark allocation in the table below). It is believed that in theshort term corporate bonds represent a more attractive investment opportunity for the Fund than either Giltsor Index Linked Gilts. This new strategy is expected to enhance the overall return by 0.2% per annum andwas implemented in October 2008. The table below shows the benchmark allocation compared to actualasset allocation at 31st March 2008 and 31 March 2009:Broad Asset ClassEquityBondsSub Asset ClassGlobal PassiveTotalActualAllocation31 October2008%ActualAllocation31 March2009%Variance2009%030300Global Unconstrained3030030300Total Equity6060060600Passive Index-Linked Gilts151507.580.5Passive Fixed Income Gilts5502.52-0.5Passive Corporate Bonds000101002020020200Total BondsPropertyBenchmarkAllocationat 31March 2008%Property2020020200100100010010008
Asset Allocation by Major Asset Class3%18%6%UK equitiesOverseas equitiesFixed interestIndex linked11%Corporate bonds8%52%2%PropertyCashEquities – Geographical Split7%1%7%9%UK8%North AmericaEurope (Ex UK)JapanAsia Pacific (ex Japan)Latin America47%21%9Emerging Markets
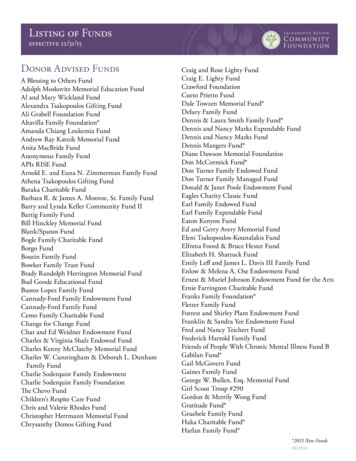
Investment PerformanceThe following chart shows the total fund value over the last 3 years:850800Value ( m)750700650600ApM r-06ayJu -06nJu 0 6Au l-0g 6Se -06pO -06ctN -06ovD -06ecJa -06nFe -0b- 7M 07aAp r-07M r-07ayJu -07nJu 0 7Au l-0g 7Se -07pO -07cN t-07ovD -07ecJa -07nFe -0b- 8M 08aAp r-08M r-08ayJu -08nJu -0 8Au l-0g 8Se -08pO -08ctN -08ovD -08ecJa -08nFe -0b 9M -09ar-09550Performance Against BenchmarkEach manager has been given a performance benchmark, the constituents of which are detailed below:ManagerBenchmarkOutperformance of BenchmarkMeasured over 3 Year Periods% per annumBarclays GlobalInvestors (multi asset)FTSE All World IndexFTSE UK Gilts 15 yrsFTSE UK Index-Linked All StocksIndexMatch IndexAlliance BernsteinValueFTSE All World Index4% gross of fees over rolling 3 yearsAlliance BernsteinGrowthFTSE All World Index3% gross of fees over rolling 3 yearsNewtonFTSE All World Index3% net of fees over rolling 3 yearsHendersonIPD All Properties1.00Total Fund1.00Source: WM Company10
Performance Against Benchmark By Investment ManagerBarclays Global InvestorsAlliance Bernstein GrowthAlliance Bernstein ValueNewton InvestmentManagementHenderson Global InvestorsPortfolioBenchmarkRelative ReturnPortfolioBenchmarkRelative ReturnPortfolioBenchmarkRelative 0.4-24.5PortfolioBenchmarkRelative ReturnPortfolioBenchmarkRelative Return-23.5-20.4-3.9-24.3-25.51.63 years% pa-1.1-1.105 years% pa5.95.80-8.3-8.40.13.41.91.510years %pa3.63.60Relative ReturnNote: Returns are shown depending on date of inception of each investment laysGlobalInvestorsAllianceBernsteinGrow thAllianceBernsteinValueNew tonInvestmentManagementHendersonGlobalInvestors12 Months3 years% pa5 years% pa10 years% paSource: WM Company11
Performance Against Benchmark By Asset ClassThe following table shows the performance against benchmark for each of the major asset classes and thechart shows the impact of that performance on the total fund performance.Total EquitiesUK BondsUK 0.13years% s% pa2.74.4-0.95.05.5-0.25.55.60.03.81.90.310years% tive Return %0.0-0.512 Months3 years% pa5 years% pa10 years% pa-1.0Total Equities-1.5UK Bonds-2.0UK Index-Linked-2.5Property-3.0-3.5-4.0-4.5The Fund return was in the 62nd percentile of local authority results and 17th out of 30 London boroughsSource: WM Local Authority League Tables – year to 31 March 200912
TOP 20 EQUITY HOLDINGSStockMarket Value at31 March 2009Exxon Mobil5,368,631Pfizer3,966,196Wal-Mart ,942,514Roche2,688,394Vodafone2,622,150Sprint Nextel2,549,013Microsoft2,369,210Credit Suisse2,121,150Deutsche Telekom2,025,254Goldman Sachs1,977,275Merck & Co1,950,380IBM1,911,578Altria Group1,898,392Millicom International Cellular1,874,975TOTAL1,829,787CISCO Systems1,812,363Pepsico1,701,69413
Membership of External BodiesNational Association of Pension Funds (NAPF)The NAPF is a leading voice of workplace pensions in the UK. They represent 1,200 pension schemes withsome 1.5 million members and assets of around 800 billion.Contact DetailsNAPF LtdNIOC House4 Victoria StreetLondon SW1H 0NXTel: 020 7808 1300Fax: 020 7222 7585Email: napf@napf.co.ukWebsite: http://www.napf.co.ukLocal Authority Pension Fund Forum (LAPFF)LAPFF exists to promote the investment interests of local authority pension funds, and to maximise theirinfluence as shareholders whilst promoting corporate social responsibility and high standards ofcorporate governance amongst the companies in which they invest.Formed in 1990, the LAPFF Forum brings together a diverse range of local authority pension funds withcombined assets of over 80 billion.Contact DetailsDavid Sellors CFA FSIPChief Operating OfficerLAPF ForumEmail: David.Sellors@lapfforum.orgTelephone: 44(0) 7920 809 515Keith BrayForum OfficerLAPF ForumEmail: info@lapfforum.orgTelephone: 44(0) 1633 265 3705Website: http://www.lapfforum.org/14
SCHEME ADMINISTRATION REPORTFINANCE DIRECTOR’S REPORTThe year to 31 March 2009 was one of the worst on record for local authority pension funds. Due principallyto the poor market background and some underperformance, the fund lost value during the year, with a 20.9% return which was 1% lower than the average local authority fund.It was another busy and challenging year for the Pensions Advisory Panel. It continued to closely monitorthe investment performance and administration of the Fund. A strategy review was conducted with theoutcome being an investment in corporate bonds.There are many challenges facing the Fund in the next few years. In particular, as we approach the 2010actuarial valuation, we will work with our actuaries to ensure that contributions are kept at an affordable levelwhilst maintaining a robust funding strategy and to protect member interests.We will continue rigorous monitoring of the Fund to mitigate the impact of recession and will bring forward afull review of our funding strategy to ensure we have the best arrangements in place to protect the value ofthe Fund.We are confident that we are well positioned to meet the increasing challenges facing the Fund in both theshort and long term and will need to ensure that we have the proper resources and strategies in place tomeet these challenges.Duncan WhitfieldSeptember 200915
CHAIR OF PENSIONS ADVISORY PANEL REPORTDuring this year I have chaired the Pensions Advisory Panel, supported by my colleagues Cllr TobyEckersley and Cllr Fiona Colley, meeting regularly with officers and trades union representatives.The global recession has had an impact on all parts of Southwark’s investment portfolio. Whilst the moneyflowing into the fund from members and the council’s contributions currently exceed the benefits being paidout this will not be the case forever so we continue to monitor the funding levels.Throughout the year we have reviewed underperforming investments and are now committed to a strategicreview of our investments to ensure the fund performs well into the future.Going forward we have a long-term aspiration to return to being a fully funded scheme, and recognise that inturn Government has to face up to the challenge faced by public sector pensions in general.Cllr Tim McNally FBCS FRSA FRI CITPExecutive Member for ResourcesLibDem Member for Chaucer Ward16
Review of AdministrationArrangements for Scheme Member & Pensioner AdministrationPension benefit administration is carried out by Pensions Services which is an internal business unit withinSouthwark’s HR service. Administration is run differently in London than in the rest of the country as eachLondon Borough is both the administering authority and the employing authority. As such, Pensions Servicesacts in both these roles at the same time. There are a number of Scheme employers within the Southwarkfund consisting of admission agreements and scheduled bodies, for members in these arrangements it istheir employer that is responsible for employer decisions, etc.There is another group of members who work in Southwark’s schools who are employed and administeredby Southwark but are not paid through Southwark’s payroll system. This means that Pensions Services donot have direct access to contractual information that has relevance to pension membership. PensionsServices have to rely on the schools, admitted bodies and scheduled bodies to provide information onstarters, leavers and amendments. Approximately one in five scheme members work in this group.Experience has shown that these bodies do not, generally, provide adequate or timely data so theconfidence in the quality of data for those staff is not high. As a result, proportionately high levels of PensionsServices’ resources are taken by this group of staff as they are more onerous to administer than staff onSouthwark’s payroll system.The administration of the pension payments is also undertaken by Pensions Services and the payroll is runon the Council’s SAP system. The service provides for twelve monthly payments each year with a payslipposted to home addresses.Internal Dispute Resolution Procedure (IDRP)IDRP is a two stage system with Stage 1 being considered by the Pensions Manager or an independent peerif the Pensions Manager has been responsible for the decision being appealed about. A notification of theright to access IDRP is included with any notification of decisions made by Pensions Services such asbenefit notices. Experience shows that members are not inclined to accept the decision of the first stage andare generally referred to Stage 2. This stage is heard by either member of the Pensions Review Panel. In2008/09 nine cases have been managed with the original decision being upheld on seven occasions andoverturned on two occasions.Key Uses of TechnologyPensions Services have direct access to the payroll records of the majority of scheme’s active membersthrough the Payroll/HR module of the Council’s main information system SAP. This allows for a monthlyinterface from SAP to the Council’s Pensions Administration system AXISe. The interface makes acomparison of information on the two systems so that validation checks can be made to keep information upto date. Examples of such information are totalling pension contributions and picking up contractual changessuch as changes in hours or grade. For members that are not paid through SAP, such as staff working inschools or for external bodies that have an admission agreement with the Council, Pensions Services haveto rely on outside bodies to provide the data.Pensions Services have the document imaging module of the AXISe system meaning that documentsreceived are imaged and linked to the individual’s AXISe record so that ‘paperwork’ is instantly available tocaseworkers with no need to retain and find paper files when needed which also fits in well with the Council’s‘paper-lite’ policies. This imaging system went live within Pensions Services in 2003, since then over 650,000pages of documents have been scanned within the office.Members of the scheme can access a version of their own AXISe records over the internet which enablesthem to maintain an active link to their membership of the scheme. This access allows members that requesta PIN number access code to check and, in some cases, amend details on the record and they may contactPensions Services if they have any queries on the data held. As at 31 March 2009 Pensions Services haveissued 1252 PIN numbers to members.Scheme Administration CostsTotal Administration Cost for yearCost per scheme member 796,000 42.9617
STATEMENT OF THE ACTUARYFor the year ended 31 March 2009IntroductionThe Scheme Regulations require that a full actuarial valuation is carried out every third year. The purpose ofthis is to establish that the London Borough of Southwark Pension Fund (the Fund) is able to meet its liabilitiesto past and present contributors and to review employer contribution rates. The last full actuarial investigationinto the financial position of the Fund was completed as at 31 March 2007, in accordance with Regulation 77(1)of the Local Government Pension Scheme Regulations 1997.Actuarial Position1.Rates of contributions paid by the participating Employers during 2008/09 were based on the actuarialvaluation carried out as at 31 March 2007.2.The valuation as at 31 March 2007 showed that the funding ratio of the Fund had improved since theprevious valuation with the market value of the Fund’s assets at that date (of 756.7M) covering 82%of the liabilities allowing, in the case of current contributors to the Fund, for future increases inpensionable remuneration. The main reasons for the improvement in the funding ratio since 31 March2004 were higher than expected investment returns on the Fund's assets, along with additionalemployer contributions paid to reduce the deficit revealed at the 2004 valuation. These had beenpartially offset by the impact of changes in the actuarial assumptions used to reflect higher priceinflation expectations and longevity improvements.3.The valuation also showed that the required level of contributions to be paid to the Fund byparticipating Employers (in aggregate) with effect from 1 April 2008 was as set out below: 14.5% of pensionable pay to meet the liabilities arising in respect of service after the valuationdate.Plus 6.4% of pensionable pay to restore the assets to 100% of the liabilities in respect of service prior tothe valuation date, over a recovery period of 18 years from 1 April 2008.Less 3.2% of pensionable pay in respect of assumed additional investment returns over the period to 1April 2011.These figures are based on the Regulations in force, or enacted by Parliament and due to come intoforce, at the time of signing the valuation report and, in particular, allowed for the following changes tothe Fund benefits since the previous valuation: The Rule of 85 retirement provisions were reinstated, and subsequently removed again.Transitional protections for some categories of member were extended to widen their coverage. Changes were made consistent with the Finance Act 2004. A new scheme has been put in place which came into effect as at 1 April 2008. All existingmembers transferred to the new scheme as at that date.The cost of future benefit promises had increased compared with the costs identified in the previousvaluation. This was due to the combined impact of benefit changes, changes in economic conditionsand increased life expectancy.4.The majority of Employers participating in the Fund pay different rates of contributions depending ontheir past experience, their current staff profile, and the recovery period agreed with the AdministeringAuthority.18
The rates of contributions payable by each participating Employer over the period 1 April 2008 to 31March 2011 are set out in a certificate dated 28 March 2008 which is appended to our report of thesame date on the actuarial valuation.If the assumptions are borne out in practice, the rate of contribution for each employer would increaseas at 1 April 2011 due to the cessation of t
CONTENT. S . Page Overview 1 Management & Financial Performance Report 2-5 Investment Policy & Performance Report 6-14 Scheme Administration Report 15-1 7 Statement of the Actuary 18-19 Governance Compliance Statement (Commentary) 20-2 2 Fund Account & Net Assets Statement 23-30 Statement of Responsibilities 3 1 Auditor's Report 32-33 Implementation of Funding Strategy Statement 3 4