Transcription
RESEARCH ARTICLEInference of Population Structure using Dense HaplotypeDataDaniel John Lawson1, Garrett Hellenthal2, Simon Myers3#, Daniel Falush4,5#*1 Department of Mathematics, University of Bristol, Bristol, United Kingdom, 2 Wellcome Trust Center forHuman Genetics, Oxford, United Kingdom, 3 Department of Statistics, University of Oxford, Oxford, UnitedKingdom, 4 Environmental Research Institute, University College Cork, Cork, Ireland, 5 Max Planck Institutefor Evolutionary Anthropology, Leipzig, GermanyAbstractThe advent of genome-wide dense variation data provides an opportunity to investigate ancestry inunprecedented detail, but presents new statistical challenges. We propose a novel inference frameworkthat aims to efficiently capture information on population structure provided by patterns of haplotypesimilarity. Each individual in a sample is considered in turn as a recipient, whose chromosomes arereconstructed using chunks of DNA donated by the other individuals. Results of this “chromosomepainting” can be summarized as a “coancestry matrix,” which directly reveals key information aboutancestral relationships among individuals. If markers are viewed as independent, we show that thismatrix almost completely captures the information used by both standard Principal Components Analysis(PCA) and model-based approaches such as STRUCTURE in a unified manner. Furthermore, whenmarkers are in linkage disequilibrium, the matrix combines information across successive markers toincrease the ability to discern fine-scale population structure using PCA. In parallel, we have developedan efficient model-based approach to identify discrete populations using this matrix, which offersadvantages over PCA in terms of interpretability and over existing clustering algorithms in terms ofspeed, number of separable populations, and sensitivity to subtle population structure. We analyseHuman Genome Diversity Panel data for 938 individuals and 641,000 markers, and we identify 226populations reflecting differences on continental, regional, local, and family scales. We present multiplelines of evidence that, while many methods capture similar information among strongly differentiatedgroups, more subtle population structure in human populations is consistently present at a much finerlevel than currently available geographic labels and is only captured by the haplotype-based approach.The software used for this article, ChromoPainter and fineSTRUCTURE, is available fromhttp://www.paintmychromosomes.com/.Author SummaryThe first step in almost every genetic analysis is to establish how sample members are related to eachother. High relatedness between individuals can arise if they share a small number of recent ancestors,e.g. if they are distant cousins or a larger number of more distant ones, e.g. if their ancestors come fromthe same region. The most popular methods for investigating these relationships analyse successivemarkers independently, simply adding the information they provide. This works well for studies involvinghundreds of markers scattered around the genome but is less appropriate now that entire genomes can
be sequenced. We describe a “chromosome painting” approach to characterising shared ancestry thattakes into account the fact that DNA is transmitted from generation to generation as a linear molecule inchromosomes. We show that the approach increases resolution relative to previous techniques, allowingdifferences in ancestry profiles among individuals to be resolved at the finest scales yet. We providemathematical, statistical, and graphical machinery to exploit this new information and to characterizerelationships at continental, regional, local, and family scales.Citation: Lawson DJ, Hellenthal G, Myers S, Falush D (2012) Inference of Population Structure using Dense Haplotype Data.PLoS Genet 8(1): e1002453. doi:10.1371/journal.pgen.1002453Editor: Gregory P. Copenhaver, The University of North Carolina at Chapel Hill, United States of AmericaReceived: July 13, 2011; Accepted: November 21, 2011; Published: January 26, 2012Copyright: 2012 Lawson et al. This is an open-access article distributed under the terms of the Creative CommonsAttribution License, which permits unrestricted use, distribution, and reproduction in any medium, provided the originalauthor and source are credited.Funding: DJL was funded by the Wellcome Trust by grant number WT082930MA, DF by the Science Foundation of Irelandgrant 05/FE1/B882 and the Max Planck Society. GH was funded by the Wellcome Trust by grant number 075491/Z/04/Z andPolygene grant LSHC-CT-2005-018827. This work was carried out using the computational facilities of the AdvancedComputing Research Centre, University of Bristol (http://www.bris.ac.uk/acrc). The funders had no role in study design,data collection and analysis, decision to publish, or preparation of the manuscript.Competing interests: The authors have declared that no competing interests exist.* E-mail: daniel falush@eva.mpg.de# These authors contributed equally to this work.I NTRODUCTIONTechnologies such as high density genotyping arrays and next generation resequencing have recentlyfacilitated the production of an enormous quantity of data with which to investigate genetic relationships inhumans and in other organisms. These data have the potential to provide a new level of insight into patternsof dispersal and mating, and recent and ancient historical events. However there are challenges, in terms ofcomputational burden and statistical modelling, that are yet to be fully addressed. Two of the most popularapproaches to investigate population structure using genetic data are exemplified by principal componentsanalysis (PCA) [1], which is often regarded as a non-parametric approach, and STRUCTURE [2], based onexplicitly modelling population structure. It is common to apply both approaches to the same dataset, inorder to provide a useful summary of the basic features of the data. The PCA approach is based on analysinga matrix (which can be defined in several different ways, e.g. [3]–[5]) whose entries quantify the geneticsimilarity between pairs of individuals. The principal components (PCs) of this matrix thus represent
directions in sample space that maximally explain the observed pattern of genetic similarity. Visualisation ofkey patterns of structure in the data can be achieved by plotting successive PCs: clusters of individuals canbe interpreted as genetic populations, while admixture of two populations results in sets of individuals lyingalong a line [6], although other historical events can also produce identical PC signals [4] and other issuescan also complicate the interpretation of PCs [4], [7].Model-based methods attempt to more directly reconstruct historical events. In the simplest version of theSTRUCTURE approach [2], individuals are assumed to come from one ofdiscrete populations. Populationmembership and allele frequencies in each population are jointly estimated from the data via a Bayesianmodelling framework. A group of very widely used (e.g. [8]–[10]) current approaches powerfully extend thismodel by allowing individuals be admixed, i.e. to have ancestry from more than one population (e.g. [2],[11]–[17]). Individuals are assigned ancestry vectors, representing the proportion of their ancestry thatcomes from each of thedetermination ofpopulations. Although powerful, these approaches have drawbacks –is difficult despite some technical advances [18], [19], and typicallyis requiredfor satisfactory convergence, due to issues of computational cost and the presence of distinct local optima,affecting even the fastest methods such as ADMIXTURE [15]. Further, little information is provided about therelationships between inferred populations, though observing how results change with varyingcan aidinsight.The central issue that we address in this work is the fact that both PCA, and the most popular STRUCTURElike approaches analyse single mutations individually, and do not use information about the relative positionsof these mutations in the genome. However the advent of high-density variation data, together with bothcomputational [20]–[22] and experimental [23], [24] advances in techniques for haplotype phasing offernew opportunities for researchers investigating ancestry, due to the possibility of exploiting correlatedvariation patterns, at sets of closely positioned markers. Markers on the same chromosome are inheritedtogether unless separated by recombination. At a population level, this results in linkage disequilibrium (LD)between close markers that reflects a shared history of descent, invalidating the independence assumption.Haplotype based analysis has the potential to harness this information [25]–[31], but there is as yet noaccepted paradigm for how to utilise shared haplotypes to infer population structure. Methods to exploreadmixture have been developed that aim to be robust to the presence of LD [14], [32], [33], or directlymodel LD patterns [34] to identify ancestry segments. However, the latter model-based approach requiresrepresentative individuals from the admixing populations to be specified in advance, so does not represent aframework for identifying population structure.Here we develop and apply both non-model and model based approaches, analogous to the PCA andSTRUCTURE approaches described above, that aim to use much of the information present in haplotypestructure. Both approaches are based on analysing the same matrix, which we call the coancestry matrix.Although our main aim is to introduce a framework to exploit LD information where present, our methodscan also treat markers independently as a limiting case. We show theoretically and in practice that in thissetting, the coancestry matrix approximately contains all the information used by both PCA, and the modelbased STRUCTURE-like approaches, unifying these apparently different approaches. Moreover, we show insome settings our model based approach can be more sensitive than either STRUCTURE or ADMIXTURE, andis able to reliably infer over 100 populations simultaneously. When dense marker sets are available, ourhaplotype-based algorithm performs substantially and uniformly better than all methods treating markers
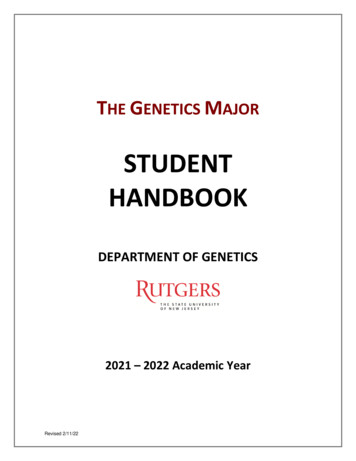
independently. We illustrate our approach using the Human Genome Diversity Panel (HGDP) dataset,comprising over 600,000 markers typed on 938 individuals. Worldwide, we show that the use of haplotypeinformation improves separation of groups, and reveals differences in genetic ancestry even amongindividuals coming from the same labelled population, and not detectable by the non-LD-based equivalentapproaches.M ETHODSChromosome paintingOur approach attempts to capture the most relevant genealogical information about ancestry in compactform. We construct and motivate the approach using an example (Figure 1). At each locus within achromosome, the sample history can be represented by a genealogical tree (Figure 1A), whose structurechanges along the genome reflecting ancestral recombination events. First considering a single haplotype,the tree relationship to the other haplotypes is fully represented by the most-recent common ancestor(MRCA) time with each. For every individual haplotype, at each locus there exists one or more closestrelative(s), which we denote their “nearest neighbour” haplotype(s) in the sample. Conceptually, we can viewour haplotype as the ‘recipient’ of genetic material from a nearest neighbour ‘donor’ haplotype, who donatesa contiguous DNA segment, bounded by recombination sites altering the ancestral relationship between thehaplotypes (Figure 1B–1C), and thus beginning new segments, from a different ‘donor’. From the point ofview of our haplotype, the chain of nearest neighbours along the genome corresponds to the most recentgenealogical events, and so we assume it captures most of the information on their current populationstructure that would be provided by the complete genealogy at the locus. Further, we also assume thatdifferent nearest neighbour segments (which correspond to distinct coalescence events in regions unbrokenby recombination) provide reasonably independent information on the ancestry of the individual. Finally, weaim to capture information on the joint structure of the entire dataset by constructing donor-recipientrelationships for every haplotype, in the same way.Figure 1. Illustration of the painting process to create the coancestry matrix.We show the process by which a haplotype (haplotype 1, black) is painted using the others.A) True underlying genealogies for eight simulated sequences at three locations along agenomic segment, produced using the program ‘ms’ [52] and showing coalescence times betweenhaplotypes at each position. B) The Time to the Most Recent Common Ancestor (TMRCA) betweenhaplotype 1 and each other haplotype, as a function of sequence position. Note multiple haplotypes canshare the same TMRCA and changes in TMRCA correspond to historical recombination sites. C) Truedistribution of the ‘nearest neighbour’ haplotype. D) Sample ‘paintings’ of the Li & Stephens algorithm. E)Expectation of the painting process, estimating the nearest neighbour distribution. F) Resulting row of thecoancestry matrix, based on the expectation of the use the set of genealogies consistent with a given dataset is complex to describe, and typically huge,approximate methods are required in order to make inference computationally practical [21], [22]. We useone such method, the Hidden Markov Model (HMM) introduced by Li and Stephens [35], which explicitly
reconstructs the chromosome of a ‘recipient’ individual as a series of chunks from the other ‘donor’individuals in the sample, using information on the types of the recipient, and potential donors, at eachmutation. We assume our dataset consists of biallelic markers. We do not order the haplotypes in the samemanner as the ‘Product of Approximate Conditionals’ likelihood used by Li and Stephens. Instead, we use anapproach in which a single haplotype within an individual is reconstructed using the haplotypes from all otherindividuals in the sample as potential donors. This process is repeated for every haplotype in turn, so everyindividual is ultimately reconstructed in terms of all the other individuals. We interpret the donor of eachchunk as representing a nearest neighbour of the recipient haplotype for that stretch, with each chunkrepresenting a different nearest neighbour relationship. In the simulated setting shown in Figure 1A,haplotype 1 actually shares a common ancestor 80 generations ago with haplotype 5 (orange) from positions0 to 284, and 150 generations ago with haplotype 4 (pink) from positions 421 to 750. In between, there is astretch where there are multiple nearest neighbour haplotypes (Figure 1C), with the shared ancestor furtherback in the past. Figure 1D shows three sample reconstructions - or ‘paintings’ of the haplotype, produced bythe Li and Stephens algorithm. The algorithm recovers the true genealogical relationships reasonably well,with some uncertainty about boundary regions, and with regions with multiple nearest neighbourrelationships showing sampling variability. In addition to producing specific realizations of the paintingprocess, the powerful toolkit associated with HMMs makes it possible to calculate expectations of whichhaplotype acts as donor to haplotype 1 as a function of position, over an infinite number of such paintings(Figure 1E). Figure 1F shows the expected number of chunksgiven the data. Extending this across all individuals, the matrixinferred from each donorto haplotype ,formed by all recipient rows is called the‘coancestry’ matrix, and is summed over chromosomes. This matrix forms the basis of our inferenceprocedure, motivated by our assumption that chunks provide independent information about ancestry.Intuitively, the coancestry matrixcounts the number of recombination events leading to individualbeingmost closely related to , so gives a natural measure of ancestry sharing. We note that the expected lengthsof the chunks donated by donorto haplotype ,, and the number of mutationsin donated chunks,may provide additional information in principle, but we do not exploit this here. To implement this approachin practice, we require previously phased (e.g. [21]) haplotype data from individuals at a defined set of loci,and (optionally) a previously estimated genetic map of the recombination distance between these loci. The Liand Stephens model has two scaling parameters, the recombination rateand the mutation rate , which weset to be the same for all individuals in the dataset. When analysing markers and using LD information, weestimateusing the Expectation Maximisation (EM) algorithm [36]. Following [35],is fixed to Watterson'sestimate although the parameter can also be estimated directly from the data using EM. Full details of thealgorithm, which is available for download as part of the ChromoPainter package, are provided in Text S1.One important special case is when markers are widely enough spaced as to be effectively unlinked, i.e. therecombination rate between any pair of markers is infinite. It is straightforward to produce our coancestrymatrix in this setting by setting the recombination rateto infinity (full details in Text S1). In this setting,chunks will automatically consist of only a single marker, and thus markers are essentially independent. Bypainting a single biallelic marker, all potential donor haplotypes carrying the same type as the recipientindividual are equally likely to actually be chosen as donors, while potential donor haplotypes carrying theother type will be very unlikely to be donors. If we additionally exclude SNPs that vary in only a singleindividual, which provide no information in our framework, then this ‘unlinked’ coancestry matrix can betrivially calculated analytically for any given value of . This is a symmetric matrix, and it is advantageouslynot necessary to obtain haplotypic phase (see Text S4). We therefore implement this as a special case in
practice, setting. Importantly, the unlinked coancestry matrix can be calculated for any dataset, even inthe case where markers in fact are in LD, in which case we view it as summarising available ancestryinformation, without utilising LD information. As we will explain below, this interpretation is justifiable, byconsidering the standard PCA and model-based approaches to analyse structure.Principal components analysis using the coancestry matrixWe developed and implemented an approach to perform principal components analysis (PCA), byeigenanalysis of a normalised version of our coancestry matrix (Text S4). Our method can be thought of as anatural extension of the approach of Price et al. [5] to a setting where information is available on therelationships between densely typed markers. Specifically, we show (Text S4, Proposition 1) that asour coancestry matrixreduces to the symmetric unlinked coancestry matrix described above,,isapproximately proportional to that used for the Eigenstrat PCA decomposition, and that our approach yieldsPCs corresponding to those calculated under the Eigenstrat PCA decomposition [5]. Thus, the Eigenstratmethod corresponds approximately to a special case of our approach. In the results section, we demonstratethat in practice both methods indeed give almost identical principal components foranalyse data as linked (. Where we), we simply apply an identical approach to the unlinked case, and in this casethe identified PCs account for LD patterns, so differ.Model-based likelihood of the coancestry matrixAs stated above, our coancestry matrixestimates the fraction of chunks in the genome that individual 'slineage coalesces with one of the two lineages from (diploid) individualIntuitively, if individualand individualbefore that of any other individual.are in the same population, or related populations, they areexpected to share more recent common ancestors in this manner than are pairs of individuals fromhistorically separated groups, sois expected to be relatively large. Even if individualadmixed with a group closely related to that whichis only partiallybelongs to, we expect an inflation, albeit of smallermagnitude. Thus, the coancestry matrix is expected to contain rich information about populationrelationships. In developing a model-based approach, we have not yet implemented a model directlyincorporating admixture, but concentrate on a clustering model (but where we can infer the number ofclusters, deal with a very large number of potential clusters, explore relationships between groups, andquantify ancestry sources in each group). The aim of such a model is to partition the dataset intogroupswith indistinguishable genetic ancestry, which we interpret as individual populations. We utilise a Bayesianapproach, employing reversible-jump MCMC.To formalise this idea, we considerpopulations characterized by a donor matrix,which canbe thought of as a population-level coancestry matrix and gives the underlying proportion of chunks fromany individual in populationthat come from population . A populationis a group ofindividuals where:(i) all individuals within the group are equally related, so receive the same underlying fractionof their chunks from each of theother members of the group, (ii) all individuals within the group shareidentical relationships with any other population , so receive the same fractionof their chunks fromeach member of any other population , and so (iii) all individuals within the group donate the same fraction,, of the chunks found in any member of population . Thus, a chunk from any recipient individualwithin populationhas an identical donor distribution, and an identical recipient distribution, across the
sample.Our model is now defined by our earlier stated assumption that donated chunks within an individual areindependent, and no additional information is carried in their size (which for example determines the numberof chunks in the genome). For individuals ,chunk is donated to individualfromin populationsisandwhere if,respectively, the likelihood a singleand when,(because individuals cannot donate to themselves). Since chunks are independent, we may simply multiplythe likelihood across chunks. Thus, if there arethe overall likelihood for individualchunks in total donated from individualisto individual ,. At this point, we make an approximation to thelikelihood, which we partially justify later. Specifically, we replace the observed number of chunksthe expected number of chunkswithgiven by the coancestry matrix, which although not an integer still allowsa well-defined likelihood. We treat chunks in different individuals as independent, so multiply acrossindividuals to give a complete likelihood:(1)Note that this likelihood depends on the data only through the termsof the coancestry matrix, which welater show are approximately sufficient statistics for our inference which aids computational efficiency. In thislikelihood, we have divided the chunk countsby a valuein order to account for a) non-independence ofchunks in practice, and b) our substitution of the expected for the observed number of chunks copied.canbe thought of as defining an ‘effective number of independent chunks’, which can be either less than, orgreater than, the true average number of chunks - we discuss calculation oflater.In our Bayesian approach, we must model the number and distribution of the underlying populations via aprior for. Given sufficient data, the choice of prior should only weakly affect the results (as discussed inResults, we believe this is an important strength of our approach). We choose a Dirichlet priorwhere, which is conjugate to the multinomial likelihood in Equation 1.Thevalues are proportional to the a-priori expected value of eachvaluedecreases the variance of all elements ofby a factorby a. From the genealogical process, we wouldexpect excess donor/recipient relationships within a group, i.e. thatthese elements we construct the prior, and scaling the vectoris larger thanwith. Fromas the product of three elements: a shared variance term(analogous to the correlated allele frequency of Falush et al. [12]), a within population increaseand an otherwise uniform distribution of thechunks donated by populationin total. Specifically,(2)
The factorsandare adjustments for the fact that individuals do not act as donors tothemselves. We wish to infer the parametersandand therefore place on them a broad hyperprior basedon Gamma distributions. Finally, the assignment of individuals to populations is given a Dirichlet ProcessPrior, which is weakly informative and allows for direct estimation of the number of populations. Furtherdetails are provided in Text S2.MCMC scheme for assigning individuals to populationsWe have implemented our approach as a software package we refer to as fineSTRUCTURE. Because we havechosen the prior ofas conjugate to the likelihood in Equation 1, these population specific parameters canbe integrated out analytically. The posterior probability of a population configuration, which we call apartition, is conditional on only global parameters (derived in Text S2). The target of inference is thesehyper-parameters (and ) but primarily the population assignment . This we represent in an unorderedform as a list of co-assignments, avoiding the problem of associating labels with populations. Inference foris performed using a Markov chain Monte Carlo (MCMC) algorithm closely related to that of Pella and Masuda[19] and also that implemented in the program STRUCTURAMA [37]. The space of possible partitions isexplored using an algorithm which proposes new partitions that are modified versions of the previous one(see Text S3). Specifically, the partition is modified by merging or splitting populations, merging thenresplitting, or moving individuals. The proposed partition is accepted, meaning that it replaces the previousone, with a probability that depends on the ratio of the likelihood with the previous partition.andareupdated within the algorithm using standard Metropolis-Hastings MCMC updates. In common with otherMCMC algorithms, ours is run for a so-called burnin, after which the parameters are periodically recorded. Ifthe algorithm is burned in and run sufficiently long, then the parameter samples converge to the posteriordistribution (see e.g. [38]) of the parameters given the data, with variation found between samples reflectingposterior statistical uncertainty of parameter estimates. We test for convergence to the posterior byconsidering the pairwise assignment of population membership for two runs initialised with different randomseeds. If the algorithm is converged then the frequency of coassignment should differ only due to MonteCarlo error between runs.Estimation of the normalization parameterThe statistical model that we have derived has a likelihood depending on the termsmatrix, which are rescaled by dividing eachby a factor(see above). The factorof the coancestrycan increase ordecrease depending on many factors.Different chunks will not in practice be fully independent of each other, tending to decrease the ‘effective’number of chunks and therefore increase . A first reason is that if individualsandshare a distinctivehaplotype tract, then they will both be counted as donors for each other and the same chunk will appeartwice in the likelihood, once inand the second in. Secondly, adjacent chunks inferred on the samehaplotype may not be fully independent of each other due to limitations of the Li and Stephens algorithm inmodelling recombining genealogies [39] and to the non-Markovian nature of genealogical relationshipsthemselves [40]. Thirdly, inaccuracies in the data such as phasing errors may create misleading chunkboundaries.
Conversely, by averaging over chunk assignment uncertainty in the painting step we smooth the chunk countdistribution for each individual, decreasingby reducing variability in chunk numbers relative to randomdraws. The effect is particularly large where there is a great deal of uncertainty about chunk assignment, asis the case for weakly linked or unlinked markers. In Text S4, we show that for the special case of unlinkedmarkers (or more generally when we use the unlinked coancestry matrix for inference), appropriate choice ofresults in our likelihood being asymptotically (in large datasets not dominated by rare markers) equivalentto that of STRUCTURE, provided population structure is not too strong. See Figures S4 and S5 and Text S6for how strong structure with truly unlinked loci affects our inference. This validates (for moderate structure)the idea of using a multinomial-form likelihood for the coancestry matrix. Further, we show analytically thatthe correct value ofisin the unlinked case.Although we have not been able to derive such a formula for linked data, we can estimateSpecifically, we calculate the variance of contributions to the coancestry matrixempirically.from non-overlappingchromosomal regions that are large enough that the chunk counts in each will be approximatelyindependent. We chooseto match the mean observed variance of these contributions to that predicted bythe (rescaled) multinomial model using the average number of chunks in the region. The principle of thisapproach is to achieve a multinomial likelihood matching the statistical uncertainty in the real coancestrymatrix terms. In the case of truly unlinked data, this approach will approximately return the theoreticallycorrect value,. In both this and the linked setting, using extensive empirical validation we find thatacross a range of settings, our estimation procedure finds a conservative, close to optimal estimate for(Text S6).Our estimation ofis similar in approach to the block jackknife of SmartPCA [41] tho
Inference of Population Structure using Dense Haplotype Data Daniel John Lawson1, Garrett Hellenthal2, Simon Myers3#, Daniel Falush4,5#* 1 Department of Mathematics, University of Bristol, Bristol, United Kingdom, 2 Wellcome Trust Center for Human Genetics, Oxford, United Kingdom, 3 Department of Statistics, University of Oxford, Oxford, United Kingdom, 4 Environmental Research Institute .